How might the past four years of economic shocks inform the next Farm Bill agenda?
January 13, 2022
PAER-2022-4
Author: Roman Keeney, Associate Professor of Agricultural Economics
![]()
![]()
![]()
![]()
![]()
Each year I begin my Agricultural Policy course for undergraduates with a discussion about “What is Agricultural Policy?” Readers of the PAER probably already understand that the punchline to that talk is “everything!” In fact, a significant learning objective of that course is to develop an understanding of how policies that are not specifically aimed at agriculture might end up causing adjustments in the food and farm economy of the US.
The global trading system and pandemic shocks that have dominated economic fortunes of the past four-plus years have made the “everything is agricultural policy” clear in the data – as agricultural support payments have spiked to a level that averages to nearly 30% of net farm income over the 2018-2021[1] period. This is nearly three times the rate of support (12%) observed in the previous six years (2012-2017).
As we consider where we are in the “Agricultural Policy Legislative Clock” created by the expiration of the 2018 Farm Bill (at the end of the government’s fiscal year 2023), the political calendar (2022 is a federal midterm election year) and federal pandemic response (economic support payments appear to be winding down) it is instructive to look at the past ten years in agricultural income and policy support payments to give some guidance on the outlook for food and farm policy.
Farm Support – Ten Year Review
In Figure 1, we see the ten-year history of farm payments as a percentage of national net farm income – including the 2012-17 and 2018-21 breakouts that were cited in the previous section. The graphic indicates a dramatic rise in the relative role farm support plays in net farm income starting in 2019 when the largest tranches of trade adjustment payments under the auspices of USDA’s market facilitation program (MFP) were delivered. These payments began in 2018 and many of the payments received in 2019 were based on previous year’s estimated losses from retaliations against US trade measures aimed at NAFTA partners and China.
A renegotiated NAFTA (set to begin in July 2020) and a phase 1 agreement with China (reached in January 2020) promised a settling of some of the biggest shocks facing agriculture with hopes that the 2020 crop year would transition the sector back to a “more normal” equilibrium with resumed market access to larger importers of US agricultural products. The news of a phase 1 deal with China was coupled with uncertainty about actual enactment as that was the same time that international reports indicated the possibility of a global pandemic which would surely play havoc with the global economy.
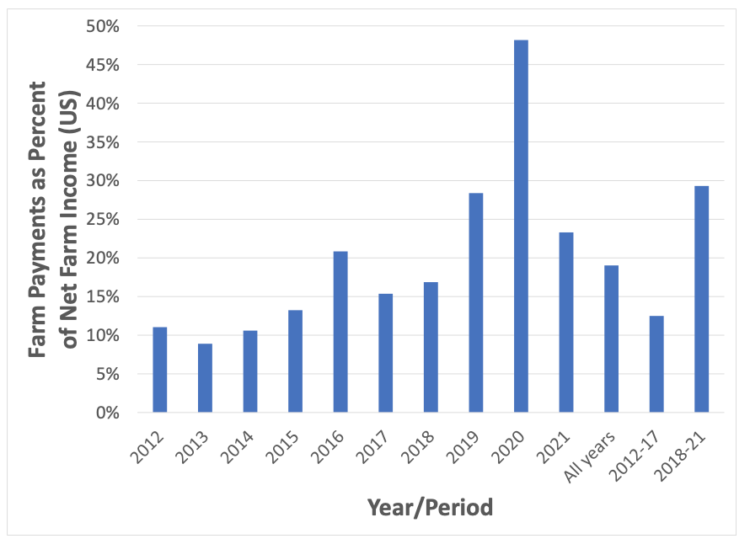
Figure 1. Government payments as a percentage of national net farm income. Source. Author’s calculations using USDA reports (see references).
This of course came to fruition and nearly all economic activity since early 2020 has to be viewed through the lens of pandemic response. For agriculture this appears as a large government transfer in 2020 ($24 billion in USDA administered pandemic assistance plus $6 billion directed to agriculture from outside USDA) that accounted for more than half of government spending in agriculture that year. Subsequent to the 2020 USDA allotment for the pandemic was an additional $16 billion in 2021 (from USDA and other administered funds).
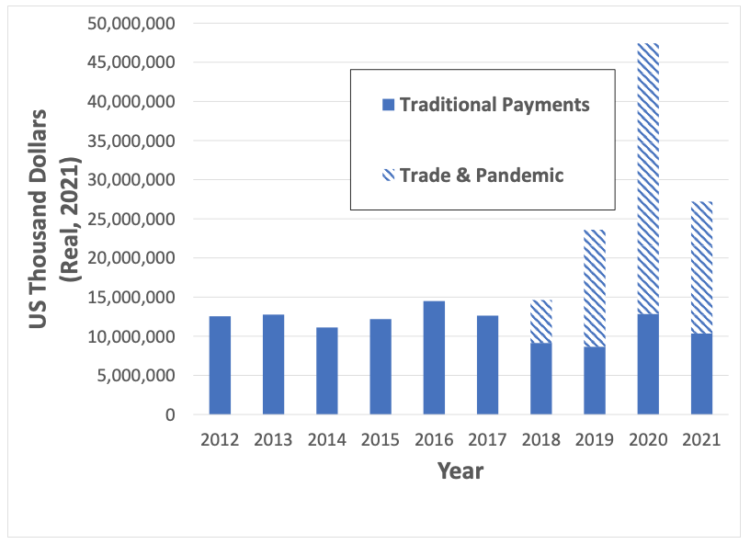
Figure 2. Role of trade and pandemic payments in agricultural support, 2012-21
Source. Author’s calculations using USDA reports (see references).
Figure 2 gives some perspective on both the baseline agricultural support programs as enacted in traditional farm bill programs and the role of government response to economic shocks that affect agricultural incomes. The solid bars in the graph representing “traditional payments”[2] produce the pattern one might expect observing the farm economy in the US over that time period. The past ten years has seen an increasing role for federal crop insurance as a protection against income losses which has relegated direct outlays to producers as those with a programmatic focus that is not farm incomes (e.g. conservation) or the so-called “shallow loss” programs that seek to stabilize farm incomes against sustained small reductions in farm earnings. It is not surprising that 2020 and 2021 saw these shallow loss claims increase given the economic shock of the pandemic permeating into farm prices and incomes.
While the pandemic response funds have been duly legislated, the 2018-19 emergency response to losses incurred through the trade war were provided at USDA’s discretion using the market facilitation program. These payments were made based on formulae developed by the department to determine the losses associated with trade retaliations aimed at agriculture. Even though these payments were made under pre-existing legislation, they can be viewed as similarly ad hoc because the trade loss assistance formulae are not permanent features of the legislation.
Taken as a whole, the data in figure 2 demonstrate a functional farm policy design that is geared to deliver between ten and fifteen billion dollars per year to agriculture through the various programs income support programs as well as programs that benefit agriculture while pursuing other objectives in areas of rural development or conservation.
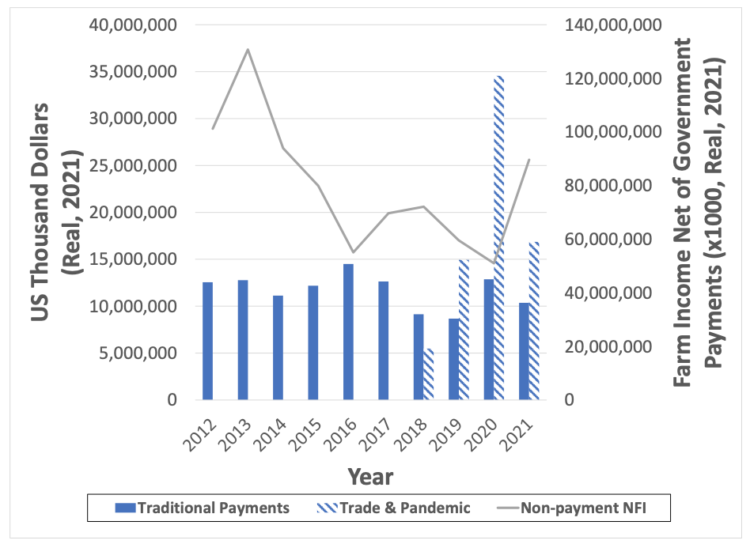
Figure 3. Farm earnings vs. support payments, 2012-21
Source. Author’s calculations using USDA reports (see references).
In Figure 3, we add the role of farm earnings (measured as national net farm income less receipts from government) to the traditional and emergency support measures we saw in figure 2. In this graphic, the farm earnings measure is read from the right-hand axis while government support levels are read from the left. The data make clear the more limited role for direct government support in traditional programs. The declining net farm incomes in the period 2012-2017 were met with small changes in direct support – by design. The transition of the farm safety net to crop insurance and shallow loss coverage means that we would not expect volatility in farm incomes year-over-year to show up similarly in direct government outlays.
The last four years of the data show total government disbursements to agriculture to be large and quite responsive to the levels of income decline in agriculture with trade adjustment and pandemic relief payments being triggered by the declines seen in the aggregate income measure displayed. Note that approximately the same level of agricultural earnings (net of all government transfers) is seen in 2016 and 2020. Only in 2020, when there was a large economy-wide shock did income support arrive in the form of pandemic relief and stimulus. Agricultural incomes in 2016 were dependent on a small increase in the programmatic funds seen in the graph plus indemnities in insurance contracts to stabilize income levels at a national level.
Closing Thoughts
This brief examination has clarified a pair of summary thoughts as we consider the evolving role of government in the agricultural economy. First, the farm support structure, first begun with reforms to direct payments envisioned in the 2008 and 2014 Farm Bills, appears to be working as planned. Programmatic payments are relatively constant, leaving the income stabilization role to an expanded crop insurance program. Second, when there is a broad economy-wide shock, government response (executive and legislative) in the form of ad hoc actions that include agriculture have been key in supplementing the farm bill’s limited payment options.
Taken together, these would seem to signal that the reforms of farm spending embodied in the last two Farm Bills are working as intended – if the thinking is that major economy-wide shocks will see agriculture as a full and proportional beneficiary of any ad hoc efforts at stabilization. If Congress wants to take a more direct role in defining when ad hoc assistance is considered and activated for agriculture, expanding the directions to the executive branch and USDA in the various existing programs like MFP or disaster relief would be an important step. It’s clear that a more limited role for program payments in the farm safety net has taken effect, an important consideration for participants in the next debate over farm bill legislation look to the specifics of how the agricultural economy responds to large economic disruptions in trade, supply chain, health etc. and make clear in the legislation whether and when emergency provisions within the farm bill should be triggered by these broader economy shocks rather than just the traditional weather and drought related programmatic efforts. As the agricultural economy’s fortunes continue to be influenced by policies and shocks that originate outside of agriculture, the farm bill’s safety net design needs to make explicit consideration of this.
Sources and References
USDA’s Farm Income and Wealth Statistics. “Federal Government Direct Payments by Program.” Retrieved December 10, 2021.
USDA’s Farm Income and Wealth Statistics. “Value Added by US Agriculture”. Retrieved December 10, 2021.
[1] All data used in this brief are from USDA reporting (see references). All data and calculations that incorporate a 2021 value should be taken as “Forecast” since those data will not be completed and finalized in government reports until later in 2022. The forecast values used are those supplied by USDA reporting.
[2] Here, traditional payments refers to direct transfers received by farms. This includes the various income and price support programs (e.g. ARC, PLC) as well as conservation program payments. It does not include crop insurance premium subsidies (the farmer sees those only as a reduced cost for crop insurance) nor indemnities. We focus on payments made to producers only here to key in on the role of traditional and emergency support to agriculture that show up as direct transfers.
![]()
![]()
![]()
![]()
![]()