

2024 Newsletter 1: Special Issue on Succession
Linking Business income to Family Support, Time Spent Together, and Flexibility in the Family Business
by William Walls | Graduate Student | Department of Agricultural Economics
Many small businesses also double as family businesses, and challenges ranging from finances to personal struggles can be a hinderance to the growth of the business. Since small businesses continue to play a role in agricultural production in the United States economy, we sought to better understand the correlation between family/work cohesion and socioemotional wealth (SEW). SEW can be described as the non-financial components of the business that provide value in other ways to the business-owning family. Examples of SEW can be family identity, family control, and family legacy (Zellweger and Astrachan, 2008). The Small Business Values Survey (SBVS) (Marshall and Wiatt, 2019) data finds that profit was the second most important business goal to small business owners in the United States. Analyzing average business annual income as a comparison across a number of variables can provide patterns in profitability of small businesses that owners may not have noticed before. Three data visualizations were created, using the SBVS (Marshall and Wiatt, 2019), to illustrate the correlation of average financial success against components of SEW (family and non-family businesses) and work-family balance.
Figure 1 portrays the percentage of time that small business owners reported to spend with family versus their business, and the 2018 annual average income associated with that percentage. There is a significant outlier at the thirty percent of time spent with family point, observing that the average annual 2018 business income surpasses $1.2 million when owners spend 30 percent of their time with the family and 70 percent of time with the business. It distinctly deviates from the trend of the rest of the data, which follows a bell curve shape with a long tail to the right. Respondents that spent seventy, eighty, or ninety percent of time with family received profits that were roughly $800,000 or higher. When small business owners spent approximately equal percentages of time with family and business (between 40% and 60% of time spent with family), average 2018 income ranged between $477,000 and $580,000. Although this graph combines both family and non-family small businesses, it is apparent that family time is an important factor for small business income and that maintaining and protecting family time can be an asset to small businesses.
Figure 1. Percentage of Time Spent with Family 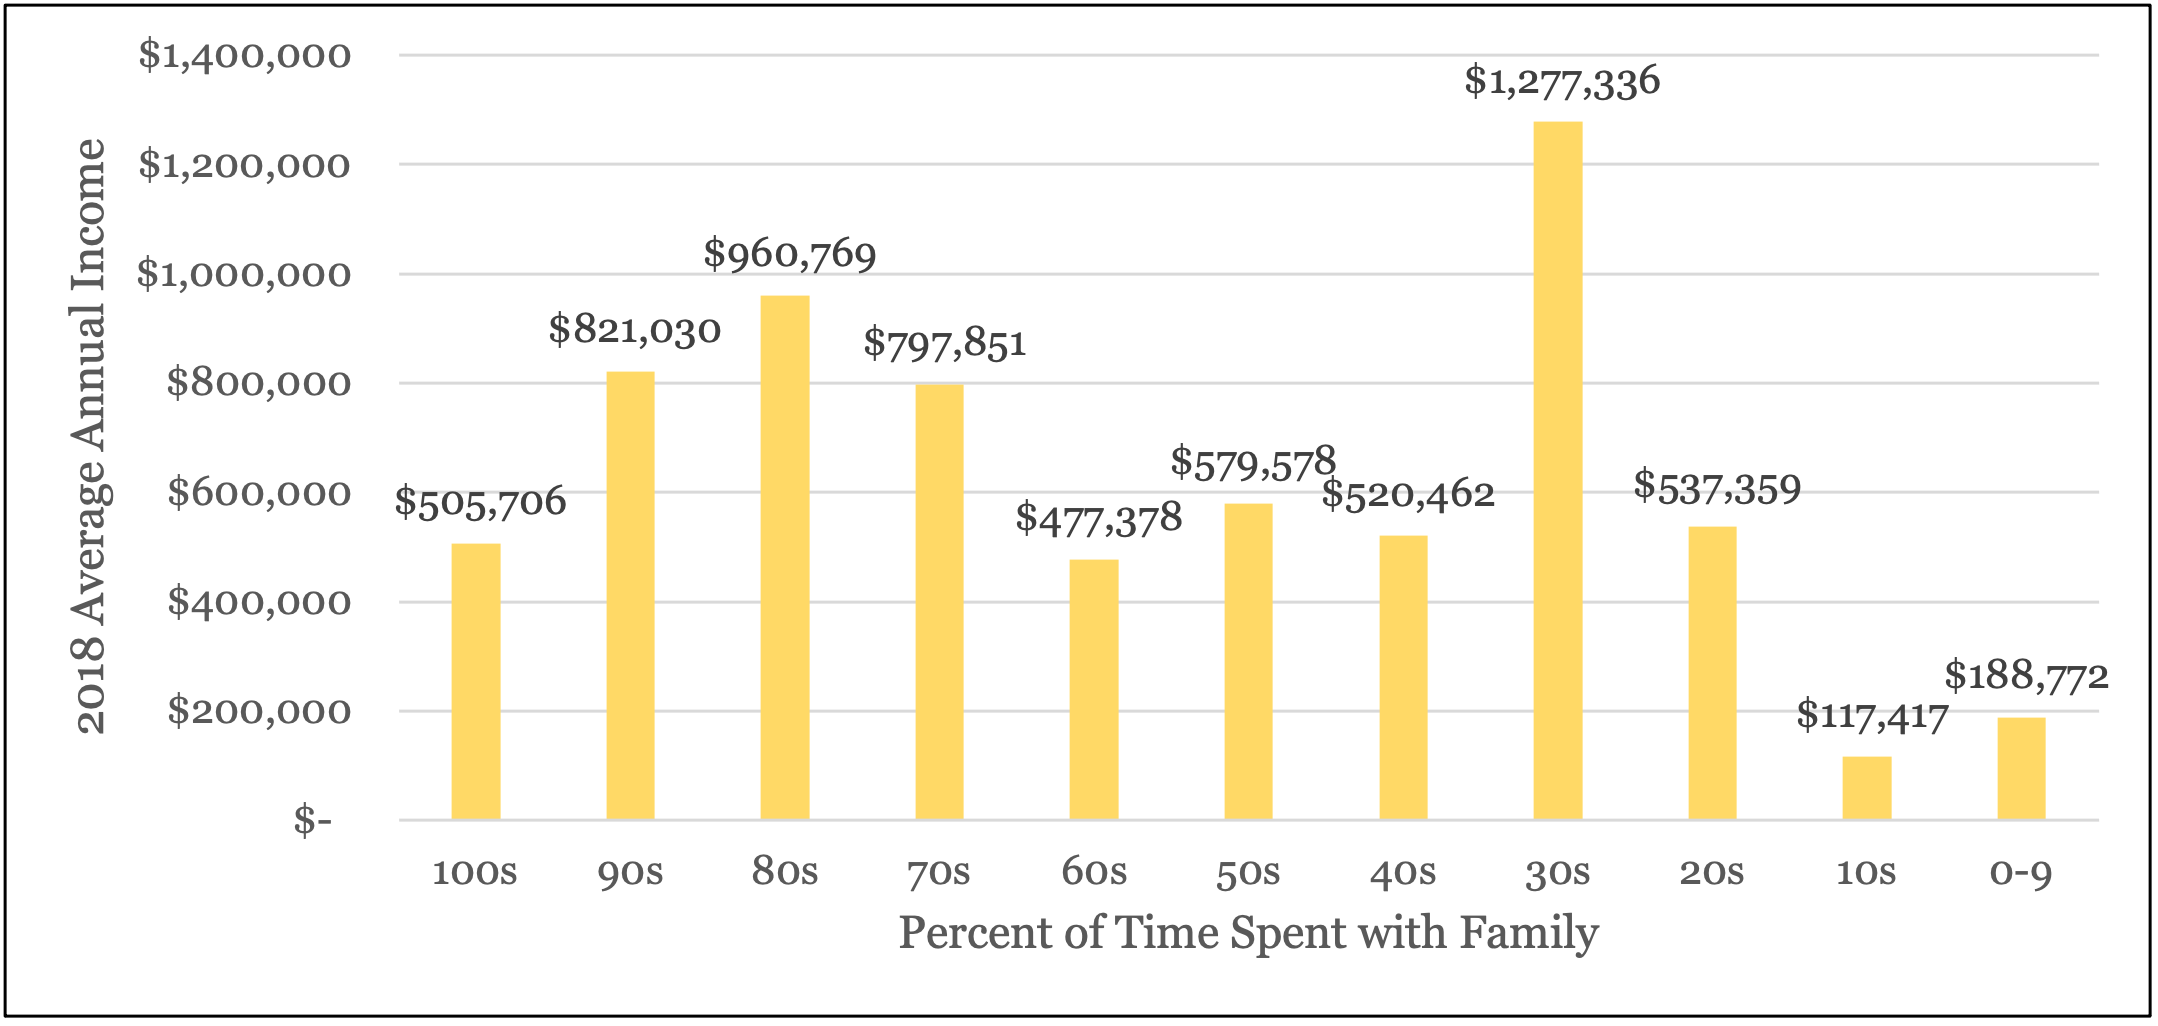
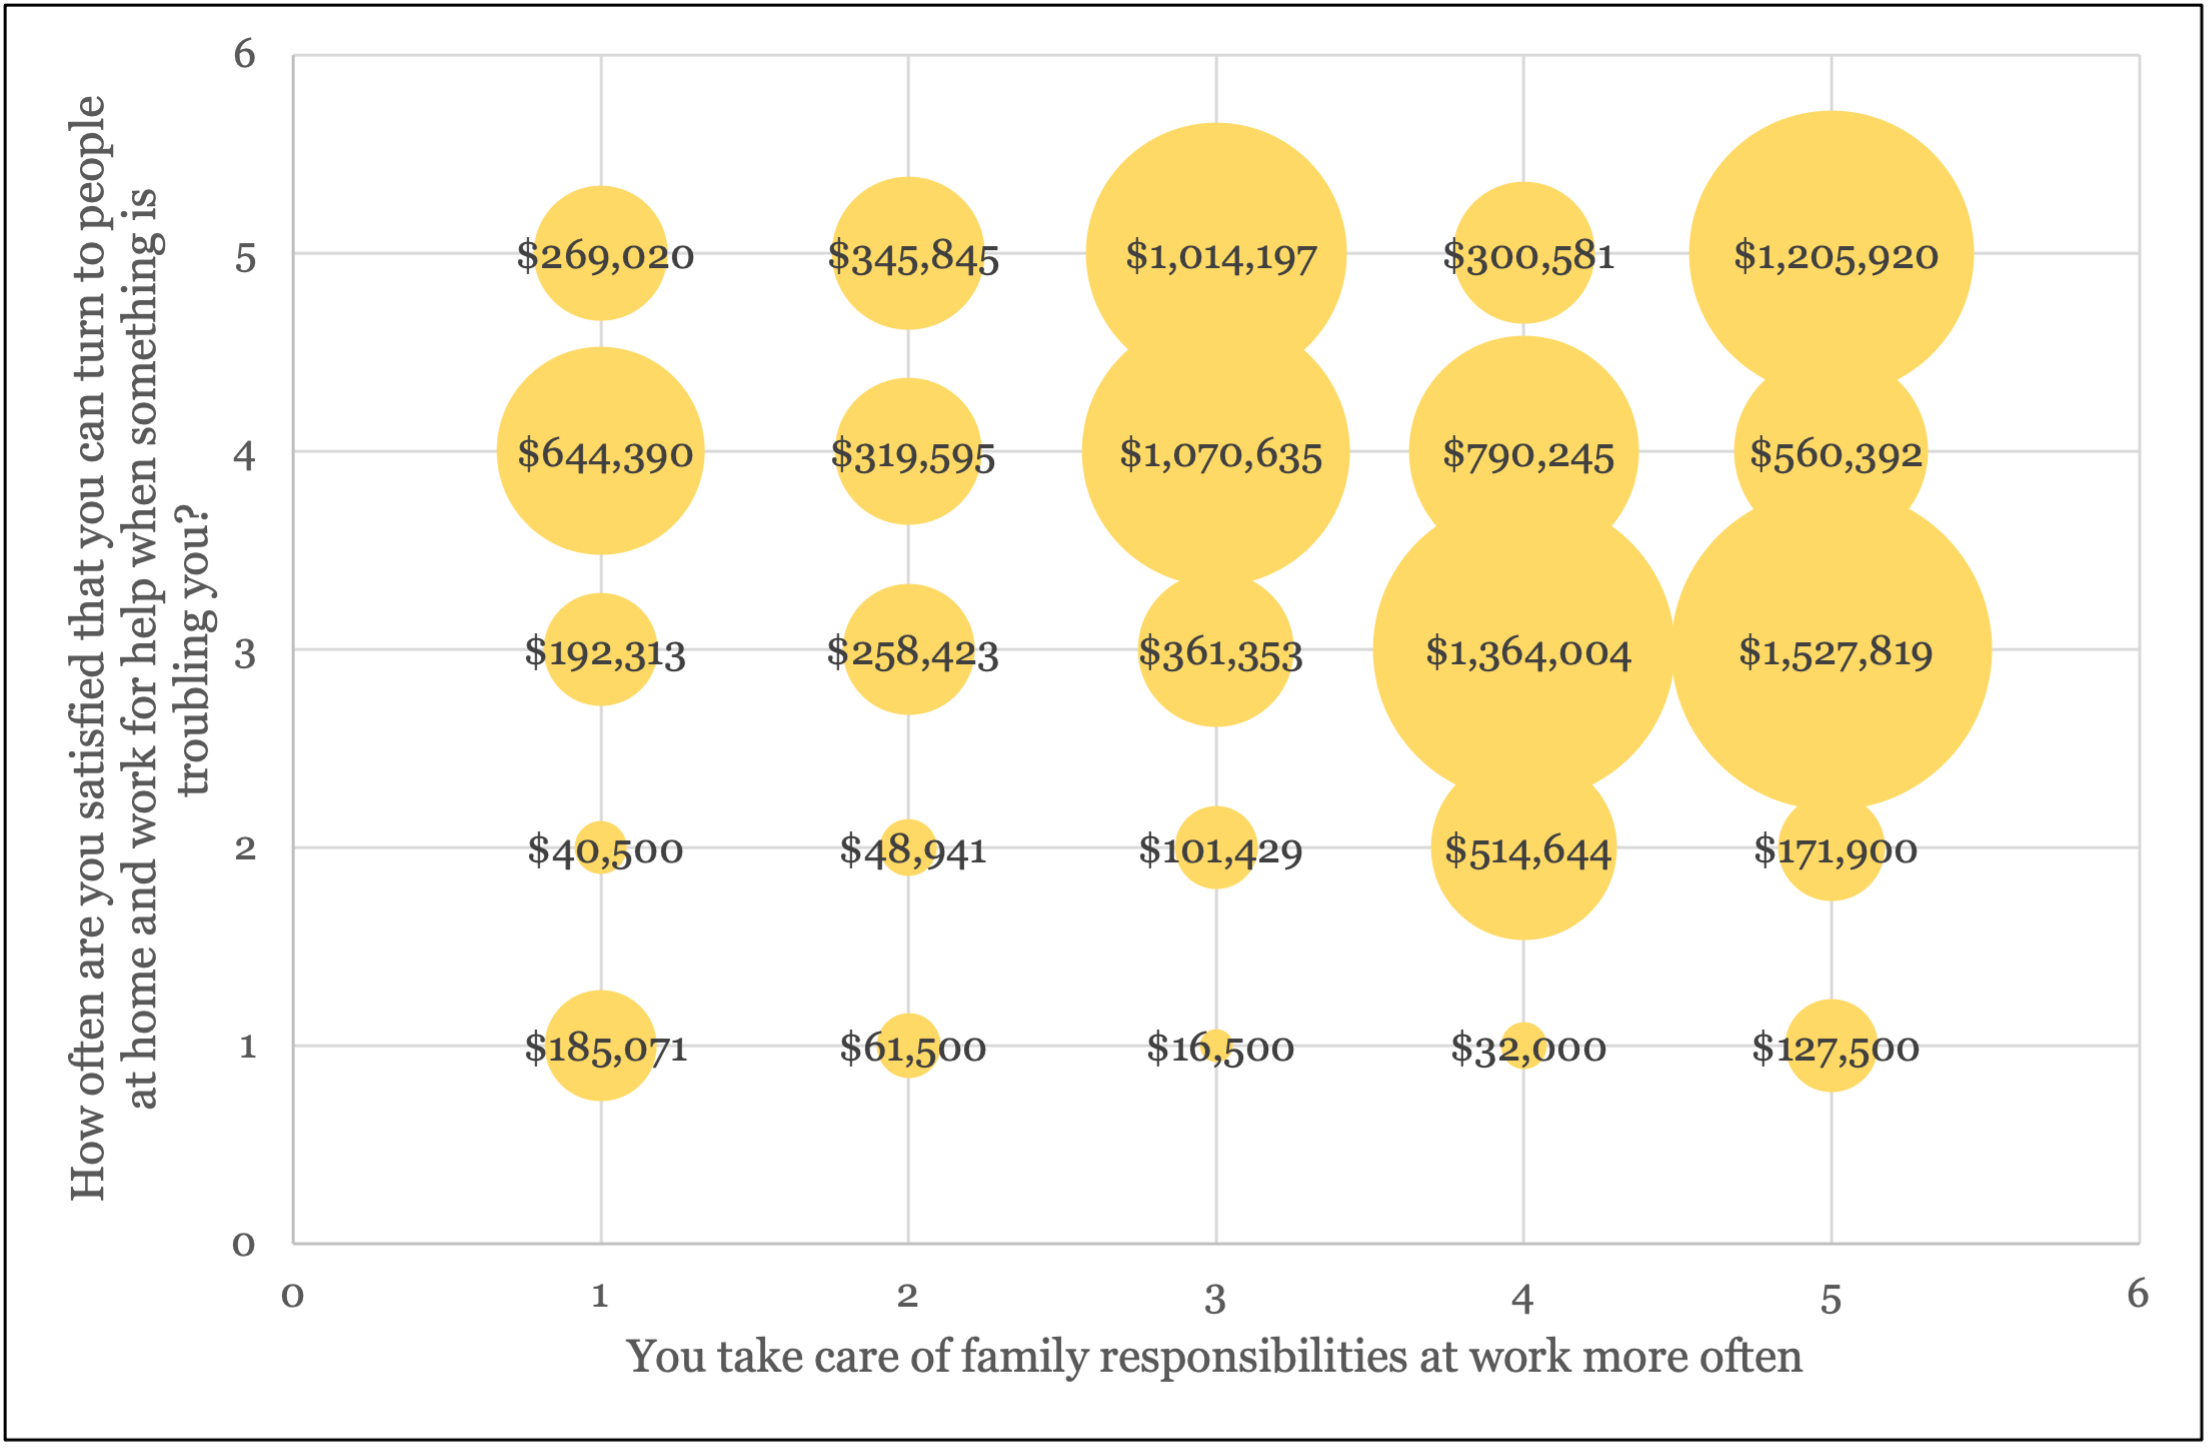
Figure 2’s data observes how small business owners’ adjustment strategies, and small business owner satisfaction in support received when something is troubling them at home and in the business impacts the financial prosperity of a small business. The bubbles suggest that utilizing adjustment strategies and feeling supported lead to greater financial success (measured in 2018 average annual income). The adjustment strategy of taking care of family responsibilities at work more often was measured on a scale where one indicated “never” and five indicated “always”, represented along the x-axis. The satisfaction in support when something is troubling the business owner was measured on a five-point scale, where one represented “never” and five represented “all of the time”, represented along the y-axis. The categories representing high support when something is troubling the business owner and more often taking care of family responsibilities at work have the largest associated average annual business incomes per category. Noticing the financial strength of small businesses where owners followed the trend of flexibility and support; this data analysis reveals that flexibility at work along with support from both the business and the family are important to a business’ profitability.
Figure 2. Work/Family Support and Work Flexibility by 2018 Average Annual Income
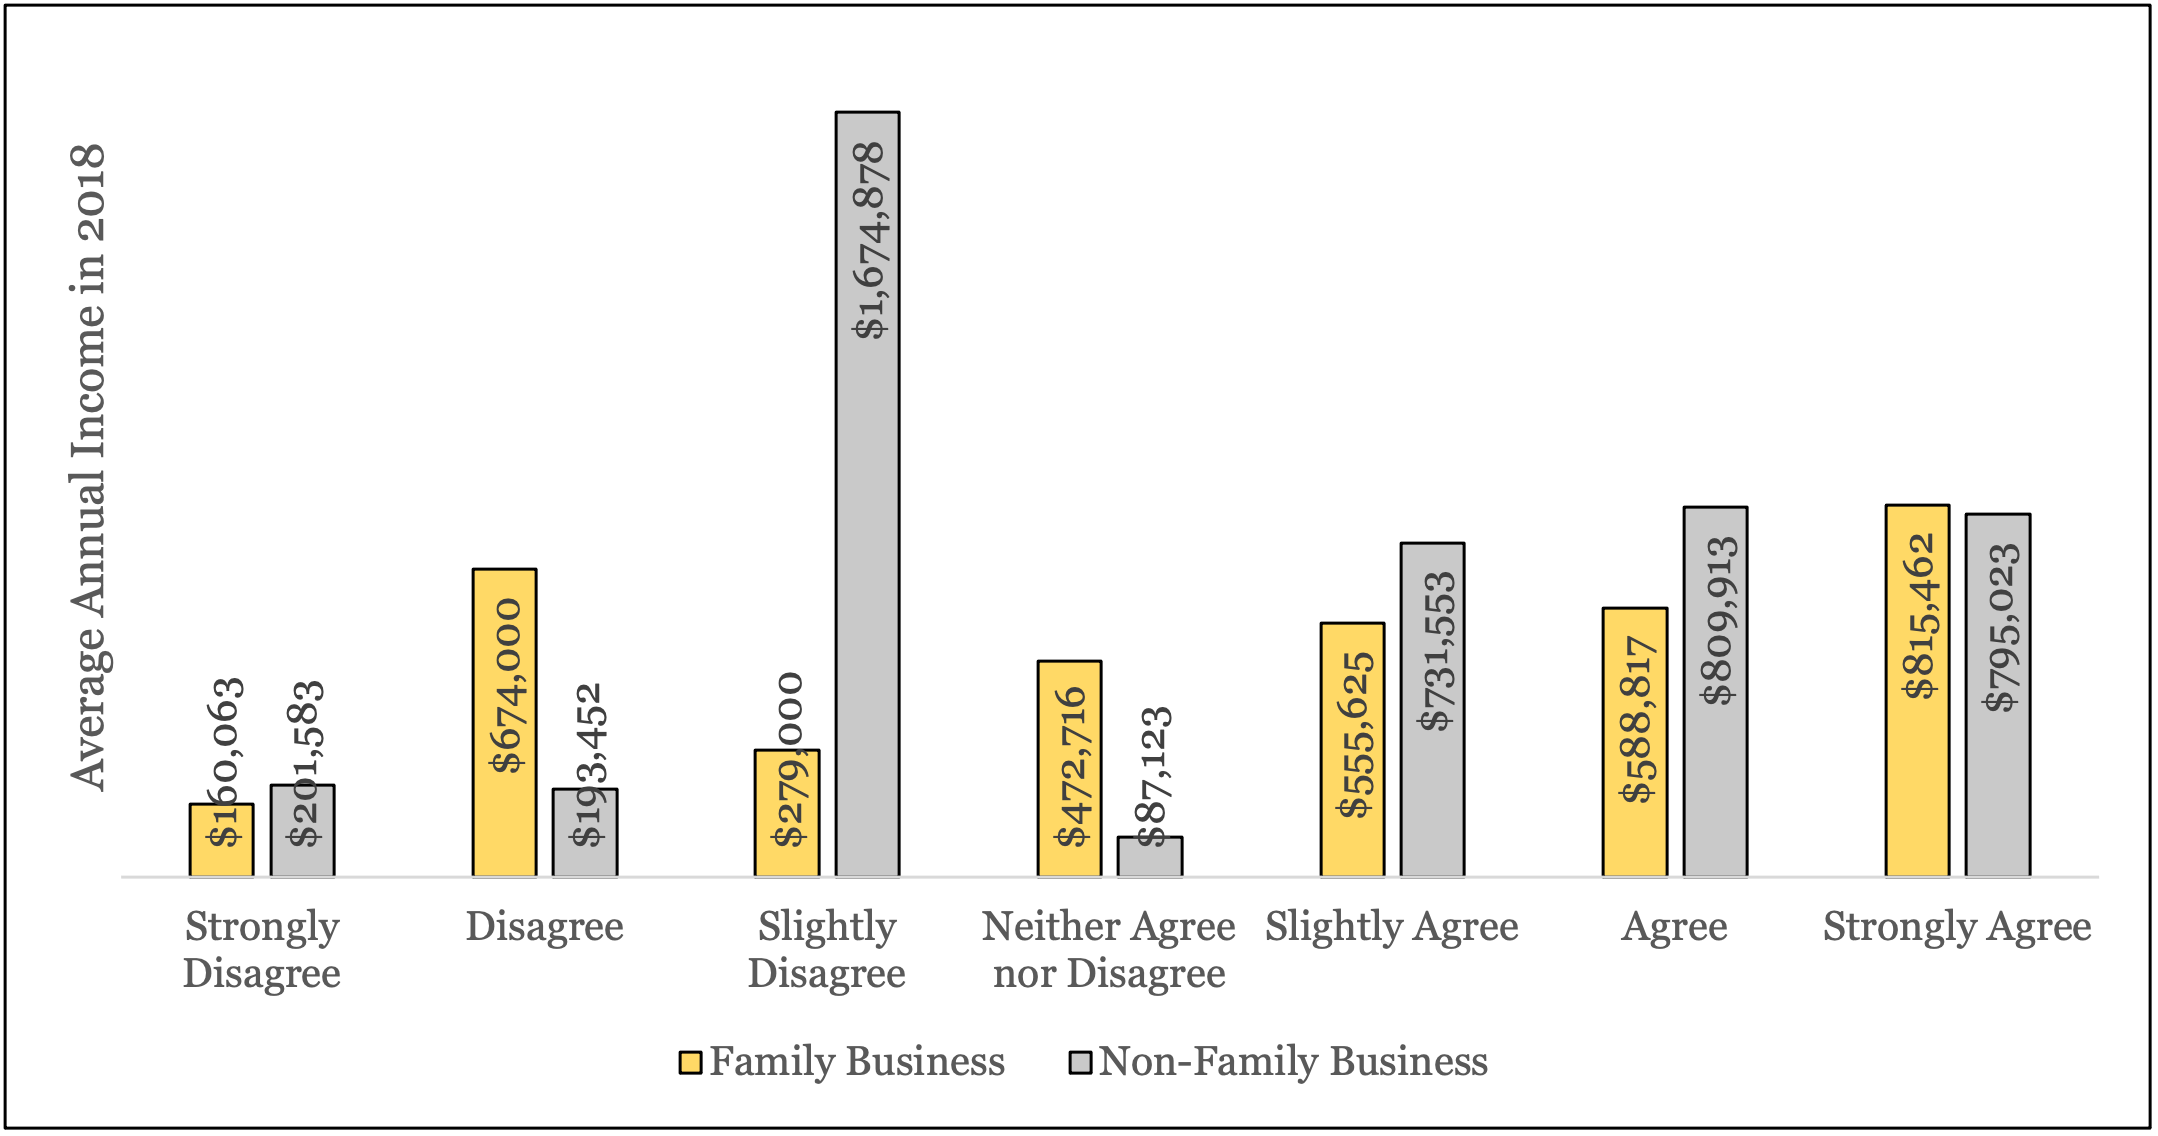
In figure 3 we observe whether small business owners, both family and non-family, feel warmth towards each other and measure their associate average annual income in 2018. Similar to figure 1 we again spotted an outlier, but this time specifically in the non-family business category. The highest income non-family business category occurred when respondents slightly disagreed that people in the business felt warmth towards each other, followed by the three categories “Agree”, “Strongly Agree”, and “Slightly Agree”. After censoring the data so that businesses listing incomes greater than $10 million were adjusted to $10 million, we observed that the difference between the “Slightly Disagree” category and the aforementioned three categories was around $800,000. The family business observations had a smoother trend and less variation among categories. There remains an outlier at “disagree” that is higher than its surrounding categories for family businesses. With that said, the highest average income for family businesses is at “Strongly Agree” for people feeling warmth towards each other in the business, and the remaining data points (other than “Disagree”) follow an upward trend in average annual income.
Figure 3. People Feel Warmth Towards Each Other in My Business
These three data visualizations provide insight into how balance between the business and the family, support in times of trouble in the family and the business, flexibility at work, and feeling warmth towards people in the business impact the financial strength of small businesses. Although it is important not to dismiss the outliers, the trends of all three visuals follow that respondents who had positive business experiences were a part of businesses that had higher levels of annual income. As we have stated in previous articles, all small businesses operate differently and therefore strategic business management decisions should be individualized based on a business’ needs. Yet, for small businesses that may be looking for financial help, struggling with planning, or striking a balance between the family and business systems, it could be beneficial to gauge employees’ satisfaction and ensure their well-being is considered through periodic check-ins. Small business owners can often change business policies to create a more beneficial culture and work/life balance for their employees.
References
- Marshall, Maria I. and Wiatt, Renee. (2019). Small Business Values Survey [data file and codebook]. Purdue Institute for Family Business, Purdue University. Unpublished data.
- Zellweger, T.M. and Astrachan, J.H. (2008). “On the emotional value of owning a firm”. Family Business Review, 21(4). DOI: https://doi.org/10.1177/08944865080210040106
Suggested citation:
Walls, W. (2024, January 30). Linking Business Income to Family Support, Time Spent Together, and Flexibility in the Family Business. Purdue Institute for Family Business 2024 Newsletter 1. https://ag.purdue.edu/department/agecon/fambiz/_docs/newsletters/2024newsletter1_4.html
Published: January 2024