
land use planning resources
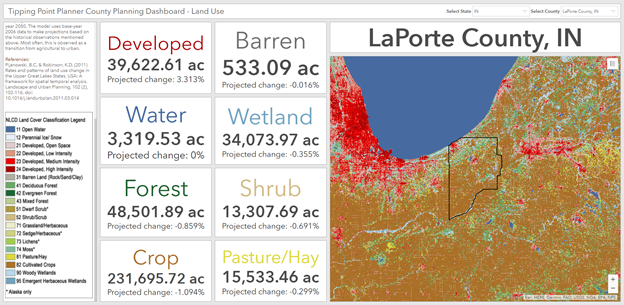
Illinois-Indiana Sea Grant (IISG) and Purdue Extension have developed County Land Use Planning and Water Resources Dashboards to help community leaders and residents better understand their natural resources at the county level, where many land-use decisions are made. These models are based on the work of several collaborators as part of the Tipping Point Planner decision support system. Dashboard profiles are available for all counties within Great Lakes states.
Dashboard Functions:
- See land-use change forecasts for your county.
- Identify the total amount and sub-types of open space in your county.
- Identify the areas of prime farmland in your county.
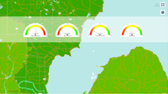
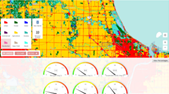
- Review a summary of water quality indicators for your county.
LAND USE PLANNING AND WATER RESOURCES DASHBOARDS
Tipping Point Planner Model Resources
Land Transformation Model
Discover future land use under three scenarios: business as usual, rapid urban expansion, and biofuels expansion.
Sparrow Model
Examine the percent contribution of nutrient sources from HUC 8 watersheds into Great Lakes.
Stream Health Model
View stream segment health based on land use and sensitive aquatic invertebrate taxa.
Food Web Model
Explore how Phosphorus loading from the Saginaw Bay watershed impacts fish, plant, and algae biomass.
Spatially Explicit Nutrient Sources Map
Pinpoint major sources of nitrogen and phosphorus in a HUC 12 watershed.
Long-Term Hydrologic Impact Assessment
Discover how changes to the land use will affect stormwater runoff and water quality.
The following interactive dashboards allow investigation into several indicators of water quality at either HUC 8 or HUC 12 watershed scales. To dive deeper into any of the watersheds, consider visiting Tipping Point Planner and creating a project for the watershed of interest to you.
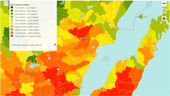
USGS Sparrow Model – Understand the sources and quantity of phosphorus in Great Lakes watersheds at the HUC 8 scale.
Stream Health Model – Identify the past and future IBI scores of Great Lakes watersheds at the HUC 12 scale.
Spatially Explicit Nutrient Sources (SENS) Model – Explore the sources of phosphorus and nitrogen in Great Lakes watersheds at the HUC 12 level.
Impervious Surfaces Model – See the Great Lakes Watersheds at the HUC 12 scale that have the highest percentages of impervious surfaces.
US Census OnTheMap – Explore a variety of geographies and their demographic and economic characteristics.
ESRI Tapestries – Investigate demographic characteristics by ZIP code.
NOAA Digital Coast – NOAA Digital Coast is host to a broad range of tools for environmental planning.
IndianaMAP – Comprehensive collection of free Indiana-based spatial data for online viewing or use with desktop software.