

The question
Petunia is one of the most popular bedding plants grown in the U.S. Several petunia varieties with a wide range of flower colors and traits are grown in greenhouses to meet wholesale and retail demand.
Authors
Ranjeeta Adhikari and Krishna Nemali
Different petunia varieties can require from five to nine weeks for finishing in greenhouses. Varieties with shorter finishing time may flower earlier and appear smaller compared to varieties with longer finishing time.
Early-flowering varieties may have different fertilizer needs than late-flowering varieties with longer finishing time and a prolonged vegetative phase before flower initiation. However, fertilizer recommendations are usually not variety-specific. Because fertilizer concentration affects plant growth and quality, it is important to understand whether fertilizer concentration for maximum growth and quality varies among varieties with differences in their finishing time.
This fact sheet provides information on the optimal fertilizer requirements of three petunia varieties that differ in their number of weeks to initiate flowering.
The study
We compared growth of three petunia varieties that differed in the number of weeks to finish under different fertilizer treatments: Plush Salmon (PS, five to seven weeks to finish), Easy Wave Yellow (EWY, six to seven weeks to finish) and Wave Purple Classic (WPC, seven to nine weeks to finish). The study was conducted over the summer at a Purdue University greenhouse in West Lafayette, Indiana.
Plants were grown in 6-inch containers (1.33 L volume) filled with peat-based soilless substrate — Sunshine mix #8 containing 75% peat, 20% perlite and 5% vermiculite — and using a custom-built Ebb-Flow sub-irrigation system.
Plants were grown under five fertilizer treatments using fertilizer solution with electrical conductivity (EC) levels of 0.75, 1.5, 2.5, 3.5 and 4.5 dS/m. Fertilizer solution treatments were prepared with water-soluble fertilizer containing 15N:2.2P:12.5K (Peters Excel 15 5-15 Cal-Mag, ICL Specialty Fertilizer). Plants were sub-irrigated with fertilizer solution only once a week to create a range of nitrogen levels in the plant tissue. On the remaining days of the week, plants were subirrigated with plain water.
The fertilizer treatments were repeated three times. The substrate pH was maintained in the range of 6.0 to 6.5 during the experiment. We measured numbers of flowers approximately five weeks from sowing. Nine weeks from sowing, we harvested plants from all treatments, dried the shoot material in a drying oven for a week and recorded its dry weight.
Results
Table 1 shows the average number of flower buds per plant in the PS, EWY and WPC varieties five weeks from sowing. Several flower buds were observed in PS and EWY, while no flower buds were seen in WPC. The fertilizer treatment did not affect the number of flower buds in each variety. On average, PS had a few more flower buds than EWY.
| Fertilizer EC (dS/m) | ||||||
|---|---|---|---|---|---|---|
| Variety | 0.75 | 1.5 | 2.5 | 3.5 | 4.5 | Average |
| PS | 20 | 23 | 18 | 21 | 19 | 20 |
| EWY | 14 | 18 | 18 | 22 | 20 | 18 |
| WPC | 0 | 0 | 0 | 0 | 0 | 0 |
This data supports that flowering time is earliest in PS followed by EWY, and both PS and EWY are earlier than WPC. Flower buds in WPC were initiated seven weeks from sowing.
Based on statistical analysis (not shown here), the shoot dry weight of the WPC and EWY varieties (with longer finishing time) increased up to a fertilizer EC of 3.5 dS/m (Figs. 1 and 2). In both varieties, shoot dry weight was numerically lower at 4.5 compared to 3.5 dS/m (Fig. 1).
The decrease in shoot dry weight at highest EC treatment is likely due to osmotic stress from increased fertilizer salts added to the substrate. Osmotic stress reduces plant water uptake, thus lowering shoot dry weight. Interestingly, shoot dry weight of the PS variety, which has the shortest finishing time among three cultivars, increased only up to 2.5 dS/m.
There were no differences in shoot dry weight of the PS variety between 2.5 and 3.5 dS/m. Similar to other varieties, shoot dry weight was numerically lower in PS at 4.5 dS/m compared to 2.5 dS/m (Fig. 1), likely due to osmotic stress.
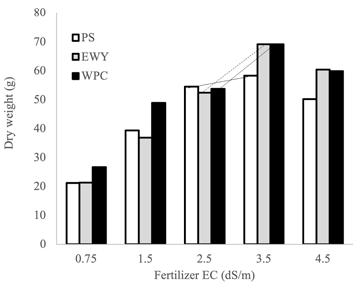
Yellow (EWY), and Wave Purple Classic (WPC) varieties in different fertilizer treatments. Note increase in dry weight between 2.5 and 3.5 dS/m treatments in EWY and WPC but not in PS.
These results suggest that the fertilizer concentration resulting in maximum growth is higher for varieties with longer finishing time than those with shorter finishing time.
- For EWY, with finishing time of six to seven weeks, and WPC, with finishing time of seven to nine weeks, a fertilizer EC of 3.5 dS/m resulted in maximum growth (Figs. 1 and 2).
- For PS, with finishing time of five to six weeks, a lower fertilizer EC of 2.5 dS/m resulted in maximum growth.
The PS variety was smaller in appearance and had the lowest shoot dry weight among the three cultivars (Fig. 1), which is also likely due to its shorter finishing time. Varieties with longer finishing time likely put on more vegetative growth due to the prolonged vegetative phase before flower initiation. Increased vegetative growth can demand a higher level of nutrients in the substrate.
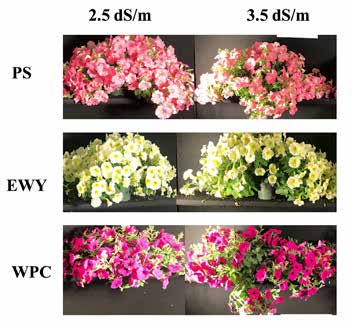
These results suggest that optimal fertilization requirements for petunia varieties in greenhouses can vary by finishing time, and that varieties that flower early with shorter finishing times may require a lower dose than those with longer finishing times.
The authors thank Drs. Allen Hammer and Joshua Craver for their expert reviews.