

Introduction
Farmers markets have become an increasingly important component of US local food systems. The rising popularity of farmers markets in American communities is reflected in the greater consumption of fruits and vegetables and the availability of better markets in low-income neighborhoods (McCormack, et al., 2010). In 2017, the US Department of Agriculture estimated that farmers market sales reached $2.8 billion (USDA-NASS, 2017), providing significant benefits to consumers, communities, and the food system (Hofmann et al., 2009).
Authors
Sanchez Philocles, Enrique Velasco, and Ariana Torres
Farmers markets provide access to local, healthier, and fresher products, contributing to diversity in consumer diets. For small and medium-size farmers, a higher share of consumer dollars, lower transportation costs, and long-term relationships with customers are possible, thanks to such markets (Hofmann, Dennis & Marshall, 2009).
Fruit production is growing in Indiana. The 2017 Census of Agriculture reported the sales value of fruits, tree nuts, and berries reached $16 million, a 24% increase in the past two decades (USDA, 2017). Similarly, the number of operations increased to 846, a 42% increase since 1997 (Torres, 2019).
The following publication provides the weekly prices of the five most-sold fruits at Indiana farmers markets during the 2019 season. This publication is the second of a series of three articles illustrating the prices of vegetables, fruits, and other specialty produce sold at farmers markets in Indiana. Each publication provides the lowest and highest prices of specialty crops sold at Indiana farmers markets in 2019. The reports can help farmers compare prices of products over time, evaluate the market window for different crops, choose the appropriate crop mix that can help maximize farm profitability, and understand market competition by looking at different price ranges.
Purdue Farmers Market Project
Data for this publication comes from a project led by researchers with the Purdue Horticulture Business Extension Program. Since 2017, researchers have collected and published weekly prices of specialty crops sold at Indiana farmers markets. The ultimate goal is to collect foundational data to support real-time decision-making of specialty crops farmers.
Through collaborations with farmers market managers, extension personnel, and volunteers, 2019 prices were collected weekly at 6 Indiana farmers markets located in 4 Indiana counties. Highest and lowest prices collected for each crop highlight how prices vary weekly. Units of products included pound, bag, box, and bunch. Farmers markets participating in the project were Bloomington Community Center Farmers’ Market and Bloomington Winter Farmers’ Market (Monroe County), Lafayette and West Lafayette (Tippecanoe County), Plymouth (Marshall County), and Growing Places Indy Winter Market (Marion County). Prices are published weekly at the Horticulture Business Program website.
Results
Figure 1 through 5 illustrate the price variation of the most frequently sold fruits at Indiana farmers markets during the 2019 market season.
Figure 1 illustrates the price variation and market window of apples sold by the pound. Apples were sold from January ($2.00/lb.) through October ($1.00/lb.). The average price remained between $1.50 and $2.00 from January until July; then the highest price increased to $3.50/lb. The lowest price paid for apples ($1.00/lb.) occurred in early September and October.
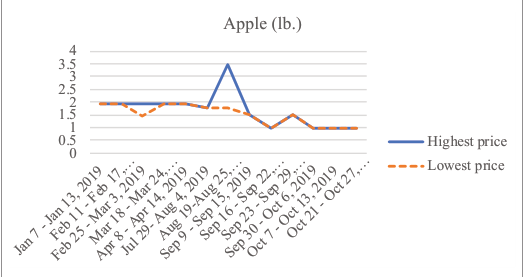
at Indiana farmers markets in 2019.
Figure 2 displays the weekly prices and availability of nectarine (by qt.). Nectarines were reported from early May to late September. As nectarine prices increased from May ($1.50/qt.) to August ($5.00/qt.), both highest and lowest prices overlapped during this period. The highest price paid for nectarine was $5.00/qt. (mid-September), and the lowest price was $1.50 (reached in early May).
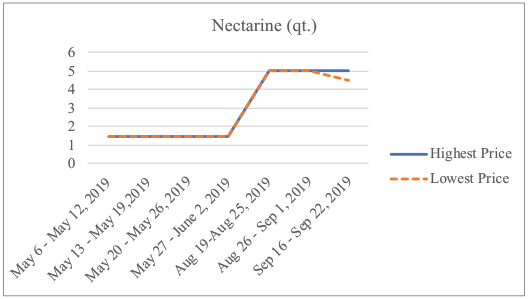
Figure 2. Highest and lowest prices of nectarine ($/qt) sold at Indiana farmers markets in 2019.
Prices of peaches (by qt.) are displayed in Figure 3. Peaches were available at Indiana farmers markets from May ($2.00/qt.) to September ($5.00/qt.). Prices reported did not show significant variation between highest and lowest prices until July, when the lowest price for a qt. of peaches went from $5.00 to $3.00. The lowest price of peaches was $2.00/qt. in May. The highest price was $5.00/qt., reported from July to September.
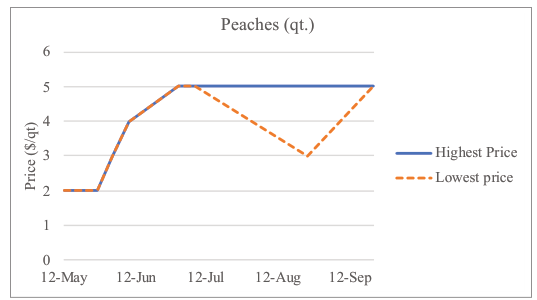
Figure 3. Highest and lowest prices of peaches ($/qt) sold at Indiana farmers markets in 2019
Weekly prices of pears (by lb.) are displayed in Figure 4. The following figure shows the availability of pears from September ($1.50/lb.) and October ($2.50 to $1.50/ lb.). Both lowest and highest prices overlapped in late September, but diverged for the rest of the season. The lowest price paid for pears was $1.50/lb. (September), while the highest price was $2.50/lb. (September and late October).
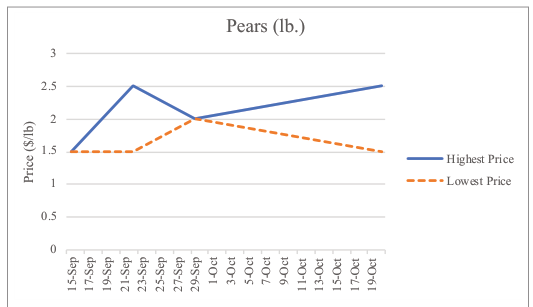
Figure 4. Highest and lowest prices of pears ($/qt) sold at Indiana farmers markets in 2019.
Figure 5 displays the price of watermelon (each) sold at Indiana farmers markets in 2019. Watermelon was sold at the beginning of the season (June) for $4.50. Prices increased considerably in September, reaching a high of $7.00/each, then decreased by October. The highest and lowest prices for each watermelon differed greatly, ranging from $1.00/each (early September) to $7.00/each (early October).
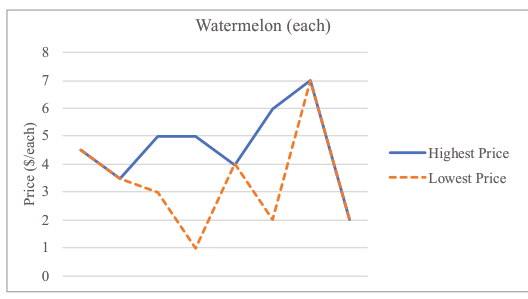
Figure 5. Highest and lowest prices of watermelon ($/each) sold at Indiana farmers markets in 2019
Take-home Message
This article is a result of the Purdue Farmers Market Pricing project developed by the Purdue Horticulture Business Extension Program. This publication presents the price trends and market availability of the most frequently sold fruits at Indiana farmers markets. Data presented shows the highest and lowest prices during the 2019 market season. A complete list of prices is available at Purdue Horticulture Business.
Our report shows that fruits have a shorter market window at farmers markets, compared to vegetable and other specialty products. For example, most fruits reported in this publication were available for no longer than five months, except apples (January to October). Shorter market window for fruits, which can affect profitability, may be due to seasonality, crop management, and shelf-life.
Farmers can use findings from this publication to evaluate market window of some fruits. They can also use this report to choose an appropriate crop mix that can help maximize farm profitability, as some fruits tend to experience price hikes at different seasons of the year. Finally, farmers can use this information to understand the gap between highest and lowest prices of fruits sold at farmers market.
References
Ariana Torres. (2019). What Does the 2017 Census of Agriculture Tell Us About Indiana Agriculture? Purdue Extension, HO-307-W
Hofmann, C., Dennis, J.H., & Marshall, M. (2009). Factors influencing the growth of farmers’ markets in Indiana. HortScience, 44(3), 712-716.
McCormack, L.A., Laska, M.N., Larson, N.I., & Story, M. (2010). Review of The Nutritional Implications of Farmers’ Markets and Community Gardens: A Call for Evaluation and Research Efforts. Journal of the American Dietetic Association, 110(3), 399-408.
USDA-NASS. (2017). 2017 Census of Agriculture. Complete data available at
www.nass.usda.gov/AgCensus.