

Introduction
Introduction
Water management is critical in vegetable farming, regardless of farm size and crop type. Both inadequate and excessive water can lead to issues, with the extent of damage influenced by environmental conditions, soil properties and plant characteristics. This publication aims to help small-scale and diversified vegetable farms improve their water management practices for both open-field and high-tunnel production. While this content is intended for Indiana farmers, the information may also be relevant to growers in other humid and temperate regions.
Authors
Wenjing Guan, Clinical engagement associate professor, Department of Horticulture and Landscape Architecture, Purdue University
Elizabeth Maynard, Clinical engagement professor, Department of Horticulture and Landscape Architecture, Purdue University
Contents
Chapter 1 - Common Vegetable Crops’ Responses to Water Stress
- Poor Water Management Leads to Unhealthy Plants
- Poor Water Management Leads to Uneven Seed Germination
- Poor Water Management Delays Harvest and Reduces Yield
- Poor Water Management Leads to Unmarketable Fruit and Reduced Quality
- Priorities in Irrigation Management at Small and Diversified Vegetable Farms
Chapter 2 - Principles of Water Management on Small Farms
Chapter 3 - Estimating Soil Moisture Status
Chapter 4 - Irrigation Methods and Systems
- Low-Flow Overhead Irrigation
- Drip Irrigation
- Irrigation Systems and Principles in Designing Irrigation Zones
Chapter 5 - Irrigation Water Quality
- Chemical Characteristics of Irrigation Water
- Biological Characteristics of Irrigation Water
- Physical Characteristics of Irrigation Water
- Irrigation Water Tests
Chapter 1. Common Vegetable Crops’ Responses to Water Stress
Plants experiencing water stress — whether from too little or too much water — appear less healthy, become more susceptible to diseases and pests, and produce lower yields and unmarketable produce. Extreme water stress can lead to a complete crop loss. While various factors may prevent plants from achieving their maximum economic value, poor water management is often one of the most significant issues limiting crop yields at small farms.
Poor Water Management Leads to Unhealthy Plants
Insufficient water supply leads to drought, which progresses in stages. In the early stages, when the transpiration demand is high and roots cannot absorb water fast enough to meet the plant’s needs, the stomata in the leaves close to conserve moisture. When stomata close, photosynthesis halts in most plants. Once conditions improve, the stomata reopen, and photosynthesis can resume within minutes. Over extended periods of drought, plants adapt by altering root growth, with drought-tolerant crops often developing deeper roots. This allows them to access water stored deeper in the soil, helping them recover and resume normal water and nutrient uptake, as well as their usual growth rate.
However, if drought continues, photosynthesis begins to decline significantly. Prolonged stress slows the development of new leaves and shoots, and existing leaves show signs of poor health, including nutrient deficiencies, increased susceptibility to diseases and pests, and wilting (Figures 1 and 2).
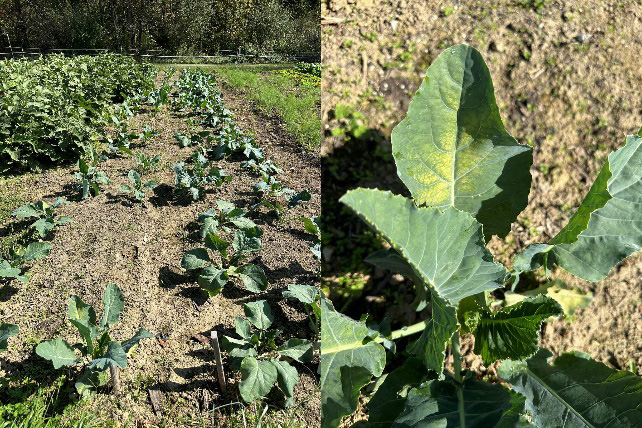
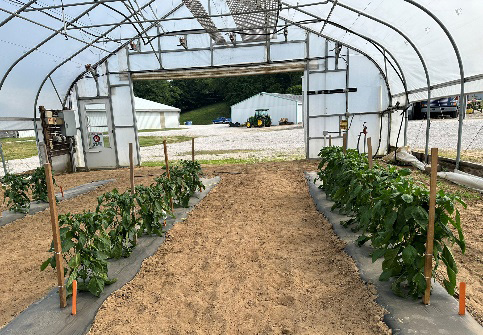
Figure 2. Comparison of peppers grown under deficient water supply (left row) and optimal water supply (right row) in a high tunnel.
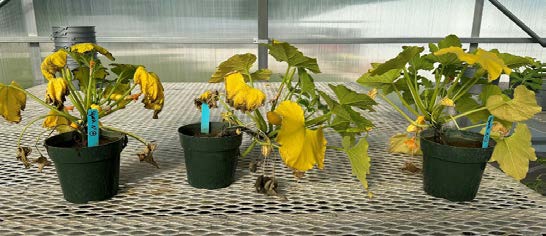
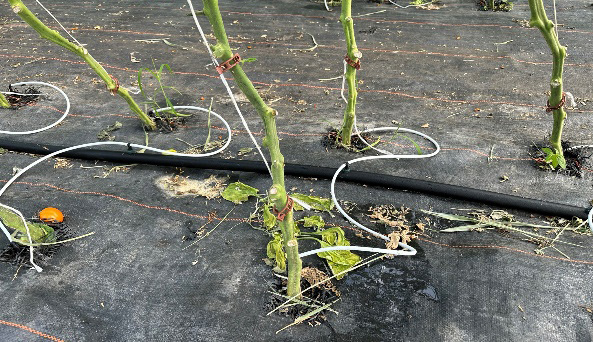
Too much water can also cause plant wilt, stunted growth and yellowing, similar to drought-related aboveground symptoms. When soil becomes waterlogged, oxygen is displaced from soil pores, creating an oxygen-deficient environment. This lack of oxygen inhibits root respiration and damages the roots. Damaged roots cannot supply the water needed for transpiration, so the stomata in leaves close and leaves wilt. Additionally, oxygen deficiency significantly reduces photosynthesis, decreases chlorophyll content, and accelerates leaf senescence, resulting in leaf yellowing (Figures 3-5). The injured root systems are also more susceptible to soil pathogens.
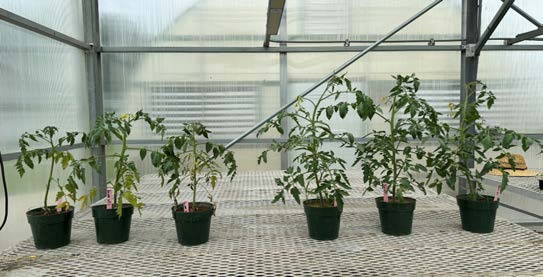
In the picture, the three tomato plants on the left experienced waterlogging;
the three plants on the right grew under optimal conditions during the same period.
The stressed plants exhibit wilting, yellowing and stunted growth.
Poor Water Management Leads to Uneven Seed Germination
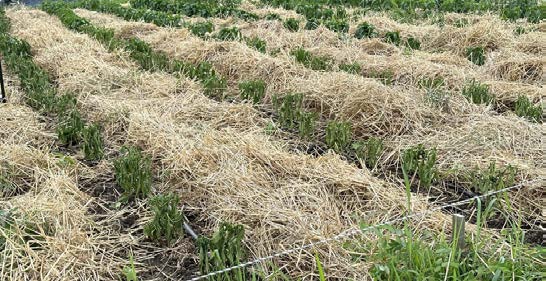
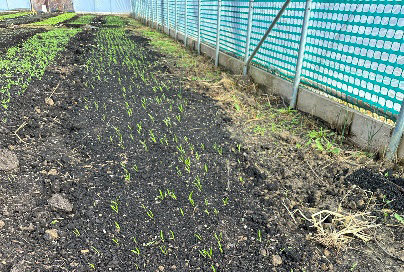
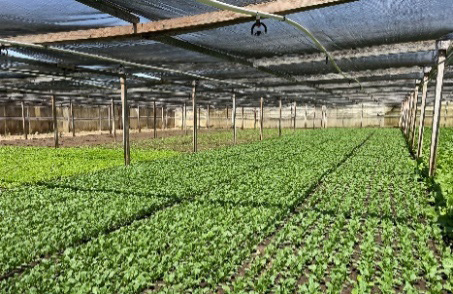
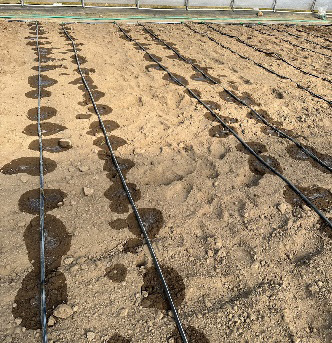
For directly seeded crops, such as salad greens, spinach, root crops, sweet corn and direct-seeded pumpkins, evenly distributed and adequate soil moisture is crucial for seed germination and uniform crop growth (Figure 6). Poor seed germination not only wastes seeds but also encourages weed growth due to the resulting uneven stand. Additionally, uneven crop growth caused by delayed germination complicates subsequent crop management. Ensuring proper soil moisture is essential for successful seed germination, which is the critical first step in growing direct-seeded crops.
Poor Water Management Delays Harvest and Reduces Yield
Insufficient water during flowering and fruit-setting stage can severely disrupt pollination and early fruit development, leading to flower bud abortion, poor or failed pollination, early fruit drop, and premature ripening (Figures 7 and 8). Although additional fruit may set after adequate water becomes available, losing early fruit set will delay harvest and lead to economic losses.
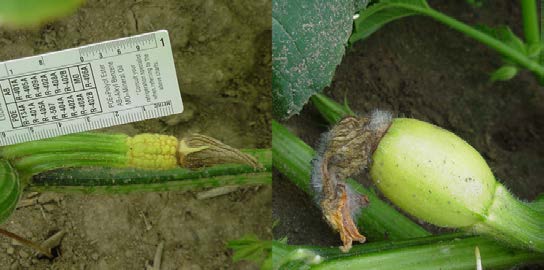
It is important to note that deficient water supply is not the only factor that can cause flower and fruit abortion and misshaped fruit. A lack of pollinators, inadequate pollen, adverse weather conditions, poor overall plant health, and nutrient deficiency or excessiveness can also cause fruit abortion.
For fruiting vegetables such as watermelons, melons, and pumpkins, insufficient water not only affects fruit set but also leads to smaller fruit when drought occurs during fruit expansion, which negatively impacts yield.
A lack of water slows root expansion in root crops like carrots, beets and radishes. In leafy crops like lettuce and Asian greens, a reduced water supply stunts leaf growth. The end result can be a decrease in yield and income, either because the crop is harvested at a smaller size, or takes longer to reach the desired size, resulting in slower turnover rate of crops on one bed.
Poor Water Management Leads to Unmarketable Fruit and Reduced Quality
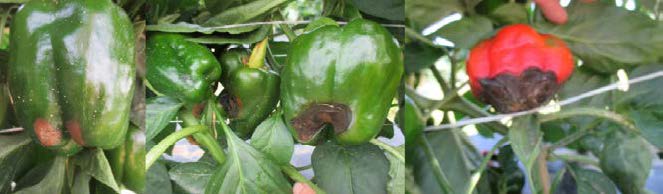
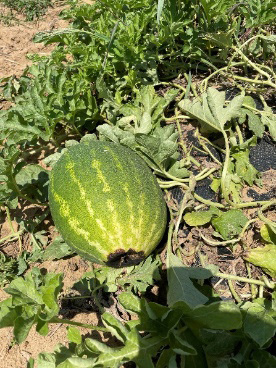
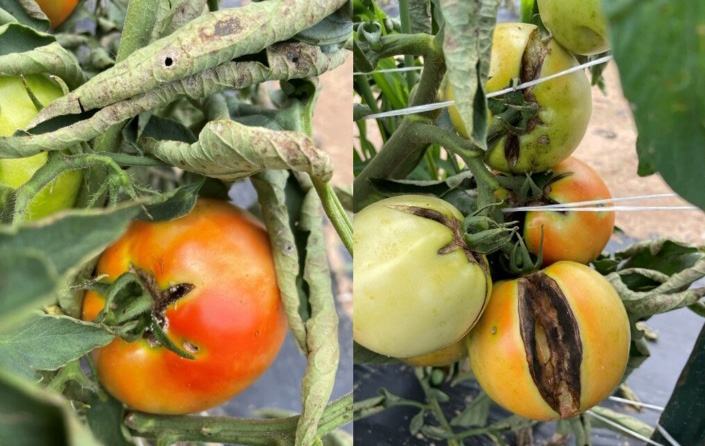
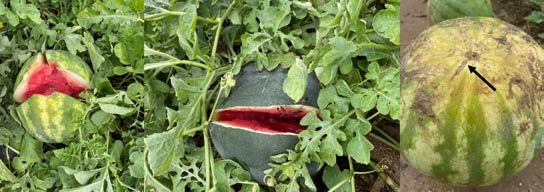
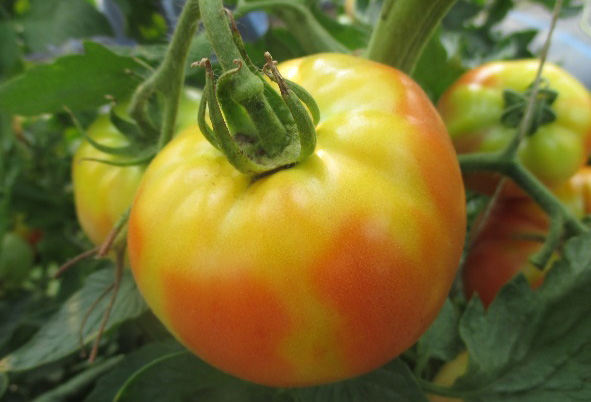
Water stress causes physiological disorders in fruits, reducing their marketability, which can lead to significant economic losses. One of the most noticeable fruit disorders related to water stress is blossom end rot (BER), frequently seen in tomatoes and peppers, and occasionally in watermelons (Figures 9-11). BER initially appears as a small dark or watersoaked area at the blossom end of the fruit. This spot darkens, enlarges, and dries out as the fruit matures. The fruit becomes unmarketable. Additionally, saprophytic pathogens may colonize the affected area, leading to fruit rot.
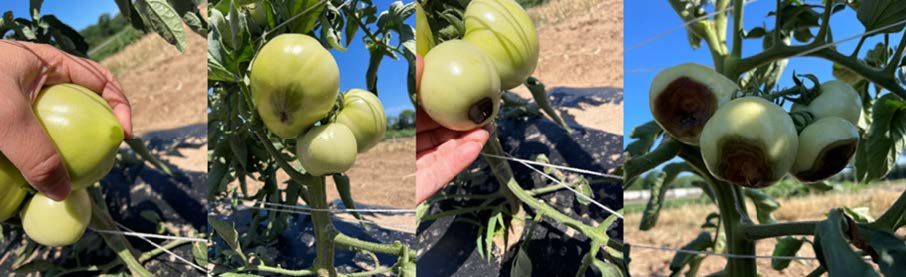
The direct cause of BER is a calcium deficiency in the developing fruit. However, a lack of calcium in the soil is rarely the key factor leading to BER. Calcium moves into plant roots with water, and moves from roots to shoots and developing fruits with water. The driving force for water movement is transpiration, and leaves demand much more water than developing fruit. When transpiration is inhibited even a little, developing fruit will receive a reduced amount of calcium along with the reduced water supply compared to leaves, because leaves have a stronger pull on the water than fruit. So, when transpiration is inhibited — whether due to limited water supply or diseases — it can lead to BER even with sufficient calcium in the soil. When tomatoes are grown in natural soil, BER is more commonly associated with deficient water supply than with other factors in Indiana.
As tomatoes and peppers set fruit over a long period of time, BER can occur at any time from the first fruit set until toward the end of the season, whenever stress conditions take place. In peppers, direct exposure to sunlight and high temperatures can cause sunburn, with symptoms similar to BER (Figure 12). Distinguishing between these factors can be challenging. However, the most dramatic damage of sunburn typically occurs under dry conditions combined with high temperatures or sun exposure.
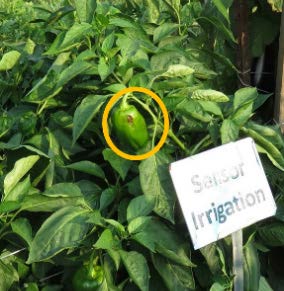
Figure 12. When the symptom occurred on the
sun exposure side,the symptom is more likely
caused by sunburn rather than BER.
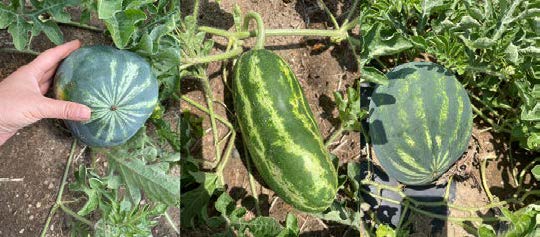
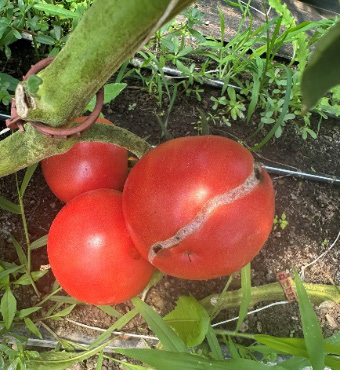
Ripening tomatoes and melons may crack or split when plants are suddenly exposed to excessive water, especially after an extended dry period. This physiological disorder is related to a rapid uptake of water by the fruit. The fast water uptake affects the strength and elasticity of the fruit skin, resulting in skin breaking (Figures 13-15).
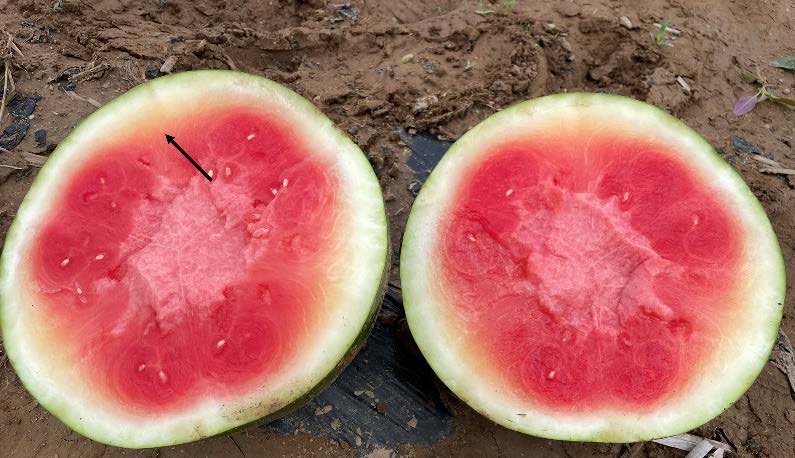
In addition to external damage that makes fruit unmarketable, excessive water during the fruit-ripening stages may reduce fruit sugar content and cause ripening disorders that reduce the internal fruit quality (Figure 16).
Priorities in Irrigation Management at Small and Diversified Vegetable Farms
Most small-scale vegetable farms grow a wide variety of crops, requiring farmers to juggle planting, harvesting and various crop management tasks. As a result, it can be challenging for farmers to dedicate sufficient attention to the irrigation needs of every crop. Additionally, small farms often have limited irrigation capacity. Therefore, understanding how to prioritize irrigation management is crucial for maximizing overall efficiency at small farms.
To plan irrigation on small farms, a top priority should be placed on ensuring adequate soil moisture for germinating direct-seeded crops. If soil is moist, irrigation may not be needed. If not, soil should be thoroughly watered after seeding, with careful attention to prevent the germination zone from drying out. If a crust develops on the soil surface and prevents emergence, a light irrigation applied slowly can soften the crust to allow emergence.
In addition to soil moisture, temperature is another crucial factor affecting seed germination. Depending on the season, the temperature of the irrigation water — whether too warm or too cold — should be considered, especially for temperature-sensitive crops. More information about irrigation water quality is discussed in Chapter 5.
Newly germinated seeds and recently planted transplants have shallow roots, making them vulnerable to both excessively dry and overly wet topsoil conditions. It is generally more desirable to start with plenty of moisture in the soil before transplanting, rather than to try to wet the soil afterward. This approach ensures ample water is stored in the soil to support healthy root development, while reducing the risk of waterlogging in young plants. Even with plenty of moisture in the soil at the beginning, applying a small amount of water and fertilizer solution to each transplant at transplanting or shortly after planting is recommended.
Close attention should be given to high-value crops during critical irrigation periods, as fluctuations in soil moisture can greatly impact both yield and marketability (Table 1). It is important to note that susceptibility to water-related disorders varies among cultivars. For instance, cherry tomatoes rarely experience BER, while fruits of certain slicer tomatoes and Roma tomatoes may often develop BER, and some heirloom tomato cultivars are particularly prone to splitting as they ripen. Farmers should consider the specific water sensitivities of different cultivars and apply tailored water management practices accordingly.
During the early growth stage of fruiting vegetables, plants are generally more tolerant of drought. Moderate drought can encourage deeper root growth, resulting in more resilient plants later in the season. At the final fruit-ripening stage, when the fruit has reached its full size and is undergoing chemical changes to enhance flavor, color, and aroma, reducing water supply can actually benefit flavor development. Drier conditions are often preferable during these phases.
Sidebar 1. Vegetable Crops vary in the susceptibility to natural water fluctuations
Vegetable crops vary in their susceptibility to natural fluctuations in water availability, with some suffering greater economic losses than others. In 2022, we conducted a demonstration comparing the growth of tomatoes, peppers, and eggplants under irrigated and non-irrigated conditions at two locations in Indiana: The Southwest Purdue Agricultural Center (SWPAC) in Vincennes and the Pinney Purdue Agricultural Center (PPAC) in Wanatah. At both locations, crops were grown on plastic-covered beds, with irrigation provided through a single drip tape placed beneath the plastic mulch. In irrigated plots, water was applied daily as needed to maintain optimal soil moisture in the top foot of soil under the drip tape throughout the monitoring period.
At SWPAC, plants grown without irrigation experienced significant drought for most of the season, leading to substantial yield reductions. Marketable yield of tomatoes, in particular, decreased by 73% compared to those grown on irrigated beds, while pepper and eggplant yields declined by 17% and 20%, respectively. At PPAC, drought was less severe, resulting in higher overall crop yields than at SWPAC. Nevertheless, the absence of irrigation still caused yield losses in all three crops, with peppers experiencing the greatest marketable yield reduction at 37%. Despite Indiana often receiving adequate precipitation, erratic rainfall distribution makes irrigation essential for achieving acceptable yields in fresh-market tomatoes, peppers, and eggplants.
However, it is not uncommon for watermelons to be grown on dry land in southern Indiana. A three-year study comparing seedless watermelons grown on irrigated and non-irrigated lands revealed that, although plants grown on dry land exhibited smaller vine coverage during drought periods, a yield reduction, approximately 16%, occurred in only one of the three years. In the other two years, yields were comparable between the irrigated and non-irrigated conditions. This study indicates that watermelons generally tolerate natural fluctuations in water availability, and in most years, yield may not increase with irrigation in Indiana.
Table 1. Vegetable crops and growth period most critical for irrigation requirements.
* For continuously flowering plants such as tomatoes, peppers and cucumbers, the critical irrigation period extends through most of the growing season.
| Crop | Most Critical Periods |
|---|---|
| Broccoli, cabbage, cauliflower, lettuce | head development |
| Carrot, radish, beet, turnip | root enlargement |
| Sweet corn | silking, tasseling, and ear development |
| *Cucumber, eggplant, pepper, tomato, melon, watermelon | flowering, fruit set, and fruit development |
| Bean, pea | flowering, fruit set, and development |
| Onion | bulb development |
| Potato | tuber set and enlargement |
Chapter 2. Principles of Water Management on Small Farms
Annual precipitation in Indiana generally meets the water needs of most crops. However, the erratic distribution of rainfall throughout the growing season makes effective water management essential when producing crops as a business. This management must address both drought conditions and the risks of excessive water after heavy rains.
A deep understanding of soil and its relationship with water is critical for successful water management. The rate of water infiltration into the soil determines how quickly water is absorbed and the likelihood of waterlogging or runoff after significant rainfall. The soil’s water-holding capacity determines the maximum amount of water it can retain after heavy rainfall, the upper limit for water application during a single irrigation event, and the desired frequency of irrigation. Key soil characteristics — texture, structure, slope, organic matter content, compaction, and water table — collectively influence the soil-water relationship and play a crucial role in effective water management.
Managing Excessive Water
Natural soil properties and field topography are fundamental for water infiltration and drainage and determine the risk of waterlogging at a given location. While the type of soil is hard to change, various approaches to improve soil health, such as cover cropping and reduced tillage, can enhance water infiltration and drainage of naturally poorly drained soils. Additionally, understanding the farm’s topography and incorporating a well-designed water drainage system early in the planning stages can be highly effective in directing surface water away from crop areas, thereby reducing the risk of waterlogging and enhancing crop production.
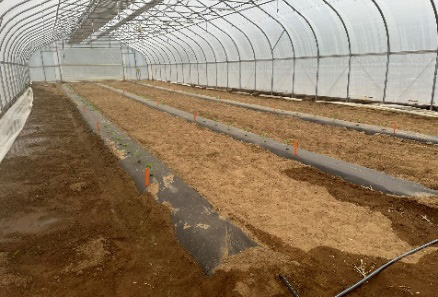
High tunnel and caterpillar tunnels are commonly used on small farms. While these structures prevent rainfall from reaching the crops directly, the water that runs off the plastic accumulates within a few inches of the tunnel edges. If this excess water is not redirected, it can seep into the high tunnel, complicating water management (Figure 17). In cases where irrigation falls short of meeting crop water needs inside the high tunnels, water entering from the tunnel sides may benefit crop growth, leading to better plant performance of the side rows. However, when ample irrigation has already been provided, excess water from outside the tunnel could potentially cause waterlogging on the side rows. This issue can be easily overlooked because the waterlogging may occur deeper in the soil; above-ground symptoms may not appear until several days after the stress; and various pathogens may be isolated from the damaged roots and plant stems, complicating diagnosis.
The Indiana High Tunnel Handbook provides suggestions for improving drainage when constructing a high tunnel, and the article ‘Water Drainage at High Tunnel Improved’ by Missouri State University provides an example of installing drainage tiles along the sides of a high tunnel. Additionally, growing crops on raised beds may prevent waterlogging from occurring in the part of the soil where the majority of the roots are located.
Sidebar 2. Estimating Plant Water Needs
Estimating plant water needs is based on the estimated water use by a non-stressed, well-watered grass or alfalfa crop that completely covers the ground, plus evaporation. The estimate of plant water use plus evaporation is called reference or potential evapotranspiration, abbreviated PET. PET is calculated based on weather conditions. Most healthy, well-watered vegetable crops at full growth will use about the same amount of water as the grass or alfalfa; taller crops or staked crops will use a little more. Earlier in the season, when vegetable plants are smaller, the water use will be less. Crop coefficients (Kc) have been developed to convert PET into expected evapotranspiration for specific crop (ETc). The crop coefficients take into account the specific crop and the stage of growth.
Reference evapotranspiration (PET) is available from the National Weather Service and the Indiana State Climate Office. These two articles describe how to find the relevant information: Reference Evapotranspiration forecasts across Indiana, Monitoring potential evapotranspiration across Indiana. For a detailed explanation of the evapotranspiration method and suggested crop coefficients (Kc) for vegetable crops, refer to Crop evapotranspiration – Guidelines for computing crop water requirements - FAO irrigation and drainage paper 56.
Managing Irrigation
During periods without rainfall, irrigation is crucial to ensure acceptable crop production. Consider the following factors for successful and effective irrigation management.
- Plant water needs
- Soil water-holding capacity
- Root structures
- Irrigation system capability
Plant Water Needs
During the peak of summer, most full-grown vegetable crops use 1 to 1.5 inches of water per week (Sidebar 2: Estimating Plant Water Needs), which equates to approximately 27,000 to 40,500 gallons per acre. For crops grown on a 3-foot-wide by 50-foot-long bed, this translates to about 100 gallons of water per bed per week during the summer. In a 30-foot by 96-foot-high tunnel, it requires about 1,500 to 2,500 gallons of water weekly. Although this may seem like a large amount of water, a significant portion of the water often comes from precipitation or soil moisture accumulated from heavy rains, either during the growing season or before planting in open-field production systems in Indiana.
Soil Water-Holding Capacity
Effective irrigation planning requires a comprehensive understanding of moisture content in the soil. If this is not fully considered, there is a risk of overwatering. Conversely, the risk of underwatering is equally critical. Soils that hold less water can quickly dry out without additional rainfall or irrigation. Typically, heavier soils retain more water than lighter ones, but organic matter content, soil structure, and other characteristics also play crucial roles in determining how much water the soil can supply after a heavy rain or through irrigation event (Sidebar 3: Soil Water Relationships and Total Available Water for Soils of Different Textures).
Sidebar 3. Soil Water Relationships and Total Available Water for Soils of Different Textures
Concepts of soil water relationships
Saturation: all the empty space between soil particles is filled with water. Plants may suffer waterlogging stress due to the lack of oxygen.
Field capacity: water in large pores has drained by gravity. Field capacity is the optimal soil moisture status for plant growth.
Permanent wilting point: the remaining water is held so tightly to soil particles that plants can no longer extract water from the soil.
Total available water: the amount of water available for plants to take up, which is the difference between soil water content at field capacity and permanent wilting point.
Total available water for soils of different textures in Indiana
Soil Texture* Inches per foot soil
Sand 0.6
Sandy loam 1.3
Loam 1.8
Silt loam 2.2
Clay loam 1.9
Clay 1.8
The information is adapted from Irrigation of field crops in Indiana: a guide for evaluating irrigation potential on your farm, 1977. ID-119, Purdue Extension
* Soil testing laboratories often offer services to assess soil texture. Additionally, the Soil Texture Calculator developed by NRCS provides a tool for farmers who want to perform this calculation by themselves.
On a larger production scale, the USDA’s Natural Resources Conservation Service offers the Web Soil Survey, a tool that provides detailed information about soils across the state, including the available water capacity of specific soils. However, this tool may be less practical for small-scale farmers, particularly in urban areas where construction may have significantly altered topsoil characteristics, or where soils have been heavily amended with organic materials, altering their waterholding capacity. In such cases, laboratory analysis is needed to accurately determine the soil’s water-holding capacity. For most small-scale farmers, however, general knowledge and experience are usually sufficient for irrigation management. Soil moisture sensors, which are discussed in detail in Chapter 3, offer additional support for fine-turning irrigation practices.
Root Structures
Root condition profoundly impacts crop yield, health, and resilience to environmental stresses. However, due to their underground nature, root status is easily overlooked. While the general root structures of specific crops are genetically determined (Sidebar 4: Root Structures of Tomato and Watermelon), cultural practices including water management can significantly influence root growth, which in turn affects crops’ irrigation needs.
Sidebar 4: Root Structures of TOmato and WAtermelon
The root structures of common vegetable crops grown in a natural environment reveal fascinating patterns and adaptations. The descriptions and root illustrations are adapted from “Root Development of Vegetable Crops” 1927, by John E. Weaver and William E. Bruner, McGraw-Hill Book Company, Inc.
Tomato
A tomato plant’s roots can occupy soil up to 2 to 2.5 feet on all sides of the plant and extend to a depth of up to 3 feet. Generally, they have numerous and profusely branched lateral roots growing from the base of the stem. These lateral roots may extend horizontally outward or vertically downward. Mid-season, when the plants are actively blooming, the root system occupies soil approximately 1.5 feet around the plant and reaches a depth of 1 foot. In mature plants, the roots spread up to 2.5 feet on all sides and penetrate 2 to 3 feet deep into the soil.
Cucurbit plants
Unique to cucurbit plants of all kinds, their root growth spreads widely in relatively shallow soil. In early development, a few but very strong lateral roots grow horizontally within the top foot of soil, often exceeding the spread of the vines above ground. Most transplanted cucurbit plants lack a taproot so that the main laterals are grown near soil surface. Even for directly seeded plants, when a strong taproot can extend beyond 3 feet deep, the main lateral roots still
occur within the top foot of soil and spread as wide as the vines. These lateral roots have numerous branches growing in all directions, forming an extensive root system that can occupy mostly surface soil areas up to 30 feet in diameter.
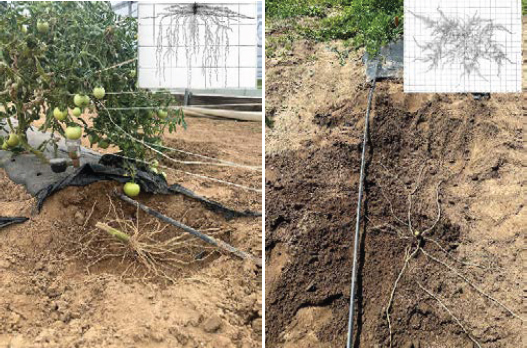
When ample water is available in the topsoil, roots are generally less likely to penetrate deeper into the soil (Figure 18). Similarly, when soil conditions are dry and irrigation only wets a small area, roots tend to remain within the moist zone, avoiding drier regions. In both cases, the irrigation management practices limit root expansion. Similarly, when plants are grown in pots with soilless medium, the root volume is confined by the size of pot (Figure 19).
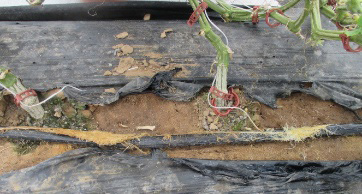
Figure 18. The cucumber plant roots accumulate near the emitters of the drip tape.
The plants were grown in a high tunnel, where water was frequently supplied through drip irrigation.
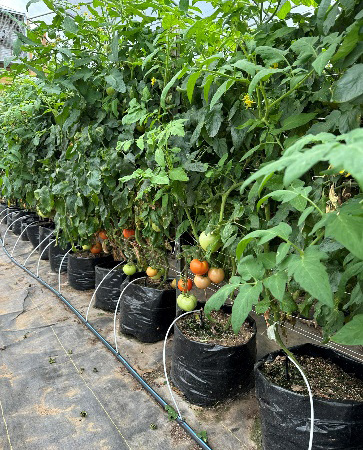
Limited root growth does not mean lower yields. In fact, excellent yields can be achieved in soilless systems where roots are restricted to a small volume. Maximizing yields in these systems requires intensive crop management, including frequent irrigation – sometimes as often as every few minutes – combined with fertigation to consistently supply water and nutrients to the small roots. However, given the limited root system in these systems, even a brief disruption in water and nutrient supply can lead to significant yield loss.
Conversely, when crops are grown in soil without physical barriers to root expansion and are exposed throughout the season to cycles of soil moisture from full saturation to gradual dry down, crops like tomatoes can develop extensive root systems. These large root systems are better equipped to handle environmental fluctuations, such as drought or excess moisture, and can access a broader range of stored soil water and nutrients later in the season. Under these conditions, crops often thrive with less need for intensive inputs.
Considerations for Irrigation Frequency
We’ve discussed that irrigation frequency should take root status into account. But when should intensive root zone management be prioritized, and when should extensive root growth be encouraged? When high-value crops like tomatoes and cucumbers are grown in high tunnels or greenhouses, frequent irrigation that maintains soil moisture at field capacity is often preferred. This approach typically results in earlier harvests, higher yields, and consistent fruit quality, ensuring high economic returns. Depending on soil type, irrigation may be applied once or multiple times a day.
Conversely, when tomatoes, peppers, and melons are grown in open-field under natural environmental conditions with limited resources, irrigating only when the soil dries out may be more beneficial. While this method may not always result in maximized yields, the moderate water stress generally encourages deeper root growth, improving the plants’ resilience to environmental stresses and enabling them to thrive with minimal intervention. Methods for determining soil moisture status are discussed in Chapter 3.
Other factors also influence irrigation frequency decisions. For crops grown in well-drained sandy soils, frequent irrigations that apply smaller quantities of water are advisable. This will reduce nutrient leaching by avoiding large applications that would be necessary if applied less frequently. In addition, sandy soils often require frequent irrigation because they don’t hold enough water for longer periods. In contrast, in a soil with a larger water holding capacity less frequent irrigation would make sense. Less frequent irrigation may also be more effective in soils that are poorly drained, or in those with low permeability in which water does not move through the soil quickly. In these soils less frequent irrigation will reduce the risks of waterlogging due to unanticipated and excessive rainfall and the associated plant stress. Because these soils often retain a significant amount of water, plants are less prone to drought even with less frequent irrigation.
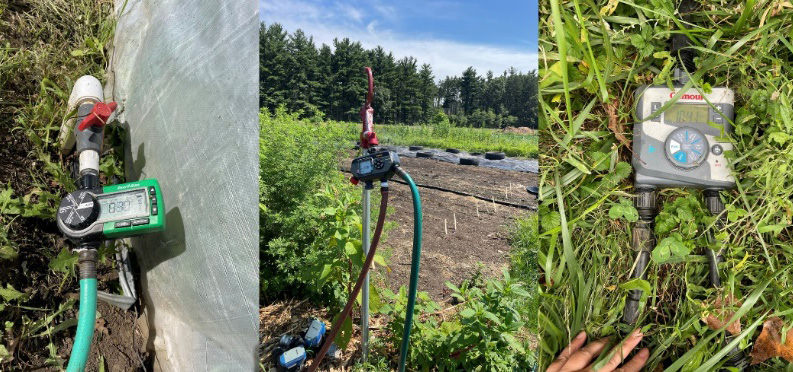
On small farms, irrigation frequency is often constrained by system capabilities. Without an automated system, applying irrigation more than once per day may not be practical. When frequent irrigation is necessary, many farms use automatic systems controlled by timers connected to the water source (Figure 20). These systems significantly reduce labor for irrigation management. However, most timers require regular monitoring and maintenance to ensure proper operation. Irrigation schedules controlled by timers should be promptly adjusted to account for rainfall, optimizing water use and preventing over-application.
Chapter 3. Estimating Soil Moisture Status
Feel-and-Appearance Method
As discussed in Chapter 2, effective irrigation planning requires a thorough understanding of soil moisture conditions. The feel-and-appearance method is a widely used approach for assessing soil moisture. The article “Estimating Soil Moisture by Feel and Appearance” provides detailed explanations of this method for different soil types. This method typically offers insights into the soil moisture status of the top 2 to 4 inches. When used with a soil probe, it can be extended to evaluate soil moisture levels at depths of 8 to 10 inches.
For shallow-rooted crops, such as leafy greens, the feel-and-appearance method is generally sufficient for managing irrigation. However, for deep-rooted crops like tomatoes, it is important to assess moisture in deeper soil layers. This can be difficult using the feel-and-appearance method, especially when the surface soil is dry (Figure 21). In such cases, soil moisture sensors provide a valuable tool for assessing soil moisture status at greater depths.
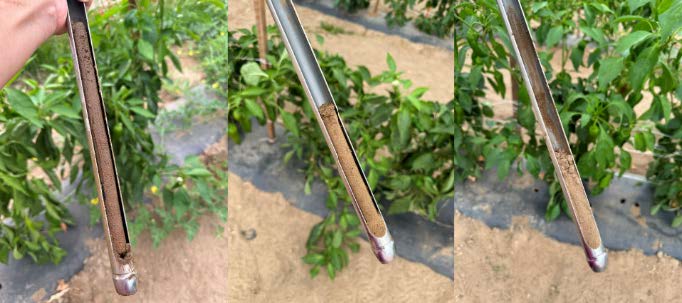
levels shown in the images represent conditions at approximately field capacity (left), permanent wilting
point (right), and an intermediate state (middle) of a sandy loam soil. Note: It was significantly easier to
penetrate the soil profile when the soil was wet (left) compared to when it was dry (right).
Soil Moisture Sensors
A variety of soil moisture sensors are commercially available, offering a wide range of prices, sensitivities, accuracies, and capabilities for estimating soil moisture levels of different soil depths and volumes.
Soil moisture sensors can be broadly classified into two main groups. One group measures or estimates the volumetric water content (VWC) of the soil, expressed as a percentage or in cubic meters of water per cubic meter of soil (m³/m³). The second group measures soil tension, which is the force required by plant roots to extract water from the soil, expressed in centibars (cbar). Each type of soil moisture sensor has its own advantages and limitations. For a detailed explanation of the sensors and how to install the sensors, refer to “Improving Irrigation Water Use Efficiency: Using Soil Moisture Sensors” by Michigan State University Extension.
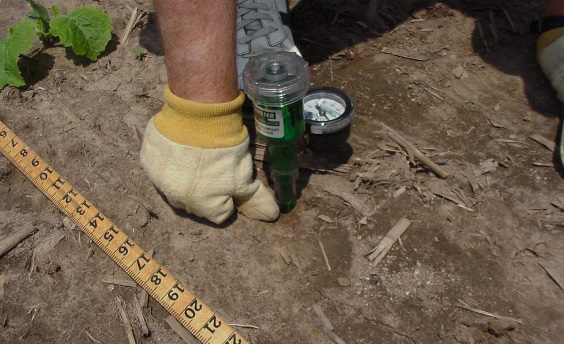
Tensiometers, a type of soil water tension sensor, provide an affordable option for assessing soil moisture. These devices provide readings that directly reflect the water stress experienced by plant roots, making them easy to interpret. Tensiometers have various tube lengths, with the most common being 6 inches, 12 inches and 18 inches, used to measure soil moisture at corresponding depths (Figure 22). However, tensiometers require frequent maintenance, especially in dry conditions, respond slowly to changes in soil moisture, and often require manual reading and data collection.
Sensors that measure volumetric water content (Figure 23) respond quickly to changes in soil moisture. While some models require manual readings, most modern sensors automatically record data using integrated loggers, such as the Onset Hobo® MX2306, or connect with separate data loggers like the METER TEROS 12, which enable remote data access. However, these sensors are generally more expensive than tensiometers. Some models incorporate multiple individual sensors to measure soil moisture content at various depths, but this significantly increases the cost of the sensors.
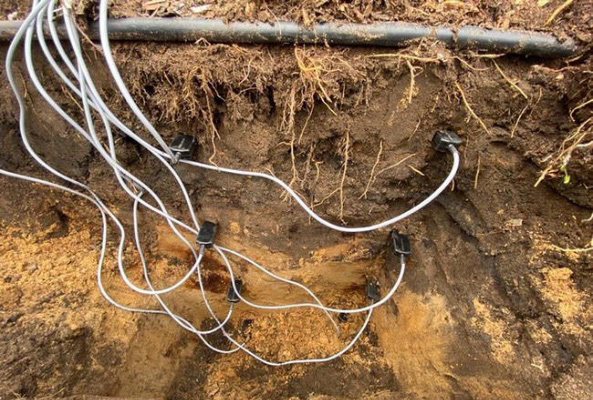
were placed at different soil depths. The photo was
adapted from Dong, Y. (2023). “Irrigation Scheduling
Methods: Overview and Recent Advances.”
Multiple Ways of Using Soil Moisture Sensors
Irrigation management involves decisions about when, how long, and how often to irrigate. While soil moisture sensors can be valuable tools, they are not a one-size-fits-all solution that will automatically provide these answers after installation. Instead, it is essential to have a plan that identifies the key questions in the irrigation decision-making process, and to strategically select the appropriate sensor types, and install them at the targeted location. Below are three ways we have found soil moisture sensors particularly helpful in guiding irrigation decisions.
1. Using soil moisture sensors to guide when to irrigate
We often use tensiometers for this purpose and find them helpful. The tensiometers measure soil water tension, which is close to zero when the soil is saturated, indicating that no irrigation is necessary. At field capacity the tensiometer may read from 5 to 40 centibars (cbar), depending on soil texture (Table 2). As the tension reading increases, it signals that the soil is beginning to dry out. At this point, we consider weather conditions, crop growth stages, and the specific soil depth being monitored to decide whether immediate irrigation is needed.Table 2. Soil tension values for different soil textures for use in scheduling irrigation
This table is adapted from the Midwest Vegetable Production Guide (mwveguide.org).
| Soil Tension Values (in centibars) | ||
|---|---|---|
| Soil Texture | Field Capacity | 20-25% Depletion of Total Available Water |
| Sand, loamy sand | 5-10 | 17-22 |
| Sandy loam | 10-20 | 22-27 |
| Loam, silt loam | 15-25 | 25-30 |
| Clay loam, clay | 20-40 | 35-45 |
Unlike tensiometers, sensors that measure VWC have high values when the soil is wet. As the soil dries, the VWC value decreases, in contrast to the increasing tension readings of tensiometers as soil dries. If water is applied to already saturated soil, the VWC reading will spike before gradually decreasing as the soil approaches field capacity. This is different to tensiometers, which remain around zero in saturated soil. Some experience is required to interpret the VWC readings and changing trends in order to determine whether the soil is merely draining or actually drying out. Therefore, when using VWC sensors to decide when to irrigate, it’s crucial to accurately determine the VWC readings at field capacity for the specific soil and to initiate irrigation only if the sensor reading is below field capacity. The practical method to determine VWC readings at field capacity can be found in “Principles and Practices of Irrigation Management for Vegetables” by the University of Florida, IFAS Extension.
In precise irrigation management, an irrigation threshold is established based on the allowable percentage of available water depletion. Irrigation is initiated when this threshold is reached. Table 2 shows tensiometer readings that correspond to 20-25% depletion of available water for different soil textures. For drought-sensitive crops or those in critical growth stages, irrigation should begin when water depletion reaches or approaches 20-25% at the soil depth where the majority of roots are located. This means tensiometer readings for the corresponding soil textures should be maintained at or below the values listed in the table for 20-25% depletion.
When using sensors measuring VWC, farmers may find it challenging to adopt precise irrigation management practices based on a threshold. This difficulty arises partly because converting the water depletion threshold into specific sensor readings requires accurate estimations of the sensor readings at both field capacity and the soil’s permanent wilting point (Sidebar 5: Formula for calculating percent water depletion and converting percent soil water depletion to sensor volumetric water content). Estimating these values involves tracking soil moisture changes from full saturation to the permanent wilting point – a complex task, especially if sensors are installed for only part of the growing season.
Sidebar 5: Formula for calculating percent water depletion and converting percent soil water depletion to sensor volumetric water content.
- Percent Water Depletion = [1- (Sensor VWCPWP)/(FC-PWP)]*100
- Sensor VWC = FC – [(SWD*(FC-PWP)/100]
- VWC: Volumetric Water Content (m³/m³) PWP: VWC at permanent wilting point (m³/m³)
- FC: VWC at field capacity (m³/m³)
- SWD: Soil water depletion (%)
Regardless of the sensor type, precise irrigation management is more effective when soil moisture sensors are integrated with automated irrigation systems that trigger irrigation as soon as the threshold is reached. While implementing the automated systems is possible for small-scale farms, farmers need to weigh both the costs and maintenance of the automated system in the decision-making process.
2. Using soil moisture sensors to fine-tune an irrigation schedule
Both types of soil moisture sensors are suitable for fine-tuning a preset irrigation schedule controlled by a timer. Small farmers may use this system to grow high-value crops, such as tomatoes and cucumbers, in a high tunnel or greenhouse. Irrigation may be scheduled multiple times a day, depending on crop stage. Sensors are usually installed at a depth of 10-12 inches beneath the plants, considering most root activity occurs within the top foot of soil in frequently irrigated crops.
The soil is often well-watered at the start of the season. An initial irrigation schedule is established to maintain optimal soil moisture for young plants. As the plants grow, the sensors may detect a declining trend in soil moisture content or an increasing trend in soil tension, indicating that the current irrigation schedule is not meeting the plants’ increasing water demands. In response, the irrigation duration or frequency may be increased to stabilize and maintain consistent soil moisture levels. When the volume is increased, it is important to avoid over-irrigation that wets soil beyond the root zone. (That will be discussed in the next section.) If soil moisture content continues to decrease, further adjustments to the irrigation amount may be necessary.
Typically, as plant growth slows down and begins to decline later in the season, plant water needs decrease. In such cases, sensors may show a general trend of gradual rise in soil moisture, signaling the need to reduce the irrigation amount. It is important to note that, when the soil is close to field capacity, tensiometers cannot detect soil saturation. Sensors measuring VWC are more helpful in detecting possible excess water application.
We find this approach is most beneficial for farmers with prior experience in managing irrigation within the targeted cropping system. Incorporating the soil moisture sensors allows them to fine-tune their irrigation practices, adapting to each season’s specific environmental and crop conditions.
3. Using soil moisture sensors to prevent over-irrigation at a single event
When using drip irrigation, it’s easy to over-irrigate during a single event, especially when crops require large amounts of water to recover from a drought stress. Over-irrigation in one irrigation event can cause water to drain beyond the root zone, which not only wastes water and nutrients but also raises environmental concerns. While it is possible to calculate the maximum irrigation duration based on the soil’s water-holding capacity, these calculations can be complex and rely on multiple assumptions that may not always be accurate for specific conditions.
A more reliable method for optimizing irrigation duration is by using soil moisture sensors. To do this effectively, soil moisture status should be monitored beneath the emitter and at relatively shallow depths that respond to each irrigation event. Additionally, a separate sensor should be installed below or at bottom of the root zone. The estimated rooting depth of common crops is listed in Table 3.
The moisture sensor placed nearer the surface should respond to each irrigation event, confirming that irrigation is functioning properly. Meanwhile, soil moisture monitored by the deeper sensor should remain stable. If soil moisture at the bottom of the root zone increases after an irrigation event, it indicates that the irrigation duration is too long. In such cases, the irrigation volume should be reduced or the time between irrigations should increase.
Table 3. Estimated effective rooting depth of common vegetable crops.
Shallow (6-12 inches)
- Beet
- Broccoli
- Carrot
- Cauliflower
- Celery
- Greens and herbs
- Onion
- Pepper
- Radish
- Spinach
Moderate (18-24 inches)
- Cabbage, Brussels sprouts
- Cantaloupe
- Cucumber
- Eggplant
- Pea
- Potato
- Snap bean
- Squash, summer
- Sweet corn
- Tomato
Deep (> 36 inches)
- Asparagus
- Lima bean
- Pumpkin
- Sweet potato
- Watermelon
- Squash, winter
Chapter 4. Irrigation Methods and Systems
Low-flow overhead and drip irrigation are the two most commonly used irrigation systems on small farms in Indiana. On farms growing a diverse range of crops, both systems are often utilized to meet the specific needs of each crop, and sometimes for the same crop at different stages of growth.
Low-Flow Overhead Irrigation
Most small farms opt to set up low-flow overhead systems, either hanging inside high tunnels (Figure 24) or using portable setups on the ground in both high tunnel and open-field condition (Figure 25). Low-flow overhead irrigation is commonly used for directly seeded cash crops, such as salad greens, spinach, carrots, and beets. It is also applied to cover crops and high-density plantings.
the roof of a tunnel.
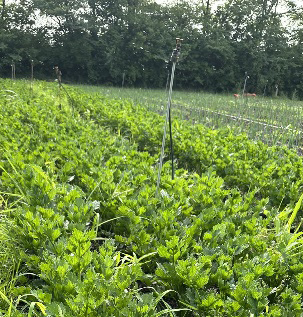
positioned along the length of the bed and
placed on the ground, is used to irrigate directly
seeded and high-density crops.
The low-flow overhead irrigation system typically involves multiple micro-sprinklers or wobblers installed on a quarter-inch feeder tube attached to a water supply line. The coverage areas and water volume can be adjusted by selecting different emitters, spacing them at various distances along the header line, and modifying their height from the ground. Many irrigation supply companies offer services to help farmers design customized systems and select emitters based on the designed coverage area.
Achieving uniform water application is essential for effective overhead irrigation. A non-uniform system can lead to areas being under- or over-irrigated, complicating management and risking crop loss. To assess irrigation uniformity, place rain gauges or containers across the entire target area (Figure 26). After irrigating for a set period, measure the water collected at each location. It’s recommended to evaluate uniformity after installing a new irrigation system and to conduct regular checks, as sprinklers or wobblers may become clogged, and system pressure can fluctuate over time.
to assess irrigation uniformity.
A well-designed overhead irrigation system wets the entire planting area, ensuring even seed germination and eliminating the need for multiple drip tapes on the beds. In the summer, overhead irrigation may also help lower the temperature for cool-season crops.
Overhead irrigation has drawbacks: It encourages weed growth, is less water-efficient, and can create wet canopies that favor foliar diseases. Due to these pros and cons, for directly seeded high-value crops grown in high tunnels, farmers may use both overhead and drip irrigation methods for the same crop but at different stages. Overhead irrigation is employed during seed germination, with a switch to drip irrigation once plants have developed 4 or 5 leaves (Figure 27).
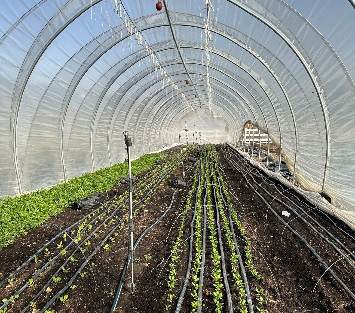
the caterpillar tunnel at different crop growth stage.
Drip Irrigation
Drip irrigation delivers water directly to the soil, ensuring high water-use efficiency and avoiding water contact with leaves, which significantly reduces the risk of foliar diseases. Most farms utilize drip tapes, which are available in a variety of thicknesses, emitter spacings, and flow rates to accommodate different needs. Drip tape is specifically engineered for agricultural use and differs from the soaker hoses commonly available for home gardens.
If drip tape is intended for reuse, choosing more durable tapes with thicker walls is advisable. The choice of emitter spacing should align with the crop in-row spacing. For crops spaced 2 feet or more apart, a 12-inch emitter spacing is commonly used, while closely spaced crops benefit from emitter spacings of 4 to 8 inches. When installing drip tape, it is recommended to position the emitters facing upward to reduce the risk of clogging. Additionally, placing drip tape under mulch improves water use efficiency and protects it from direct sunlight, which can shorten its lifespan.
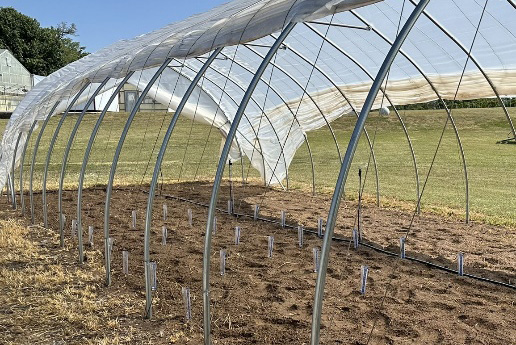
Since drip tapes can become clogged over time, which is often difficult to detect, some farmers prefer to use individual emitters and emitter tubing attached to a water supply line for high-value, widely spaced crops such as tomatoes (Figure 28). This system is effective and can be reused for multiple seasons, but it significantly increases the initial material cost.
attached to the water supply line is used in growing
tomatoes.
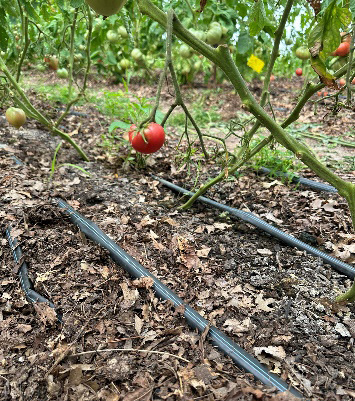
One drawback of drip irrigation is that it wets only the soil directly beneath the emitters (Figure 29). Depending on soil type, the maximum wetted area may extend 1 to 1.5 feet in diameter before water drains deeper into the soil profile. Due to the limited wetting areas, it is advisable to use multiple drip tapes per bed when planting multiple rows of crops on a single bed (Figure 27). This approach also benefits wider-spaced crops, such as tomatoes, peppers, and cucumbers, in high tunnels (Figure 30). This is because using multiple drip tapes ensures that a larger soil area is wetted, encouraging crops to develop a more extensive root system. Additionally, maintaining proper soil moisture is crucial for sustaining microbial activity, which plays a key role in converting soil amendments and organic matter into available nutrients that support plant growth.
beneath the emitters.
tomato bed.
Usually, two drip tapes per bed are recommended, though some farmers may use up to four. When additional drip tapes are added to the bed, irrigation timing should be adjusted accordingly.
Irrigation Systems and Principles in Designing Irrigation Zones
Irrigation system design varies based on water sources, system scale, and management practices. However, regardless of scale, every system should include key components such as drip tapes or sprinklers, header pipes, flow meters, pressure regulators, pressure gauges, filters, and backflow preventer if fertilizer or chemical are injected. Additionally, understanding flow rate is fundamental for irrigation system design.
The first step in this process is to determine the flow rate available from water source. If this information is not provided by the water supplier, farmers can measure it by timing how long it takes to fill a 5-gallon (or larger) container and then calculating the flow rate in gallons per minute (gpm) or gallons per hour (gph).
Flow rate information for micro-sprinklers, individual emitters and drip tape is provided by the manufacturer, expressed in gph per emitter or gpm per 100 feet at a certain pressure, e.g., 8 pounds per square inch (psi). To determine the total flow rate of an irrigation system, sum the flow rates of individual outputs (sprinklers, emitters, and drip tapes). It is crucial to ensure that the system’s total flow rate does not exceed the available flow rate from the water source. If it does, the system should be divided into separate zones, with each zone irrigated at different times.
Understanding flow rate is also important for effective irrigation management. For example, assume the goal is to apply 100 gallons of water through drip tape to one bed in a week. Farmers can calculate how long irrigation should run to deliver the required amount of water based on the drip tape flow rate.
Micro-sprinklers typically operate at a pressure range of 20 to 30 pounds per square inch (psi), while drip tapes are designed to function within a range of 8 to 15 psi. Operating the system within these optimal pressure ranges ensures the water is applied evenly and at the desired flow rate. It is important to note that water pressure decreases as it travels through the system.
The irrigation system will include a “mainline” pipe or hose to deliver water from the source to each irrigation zone. Each zone will have a “sub-main” or “header” that provides water to the drip or micro-sprinkler for that zone. A flow meter, a pressure regulator and a pressure gauge are often incorporated into each zone of the irrigation system. The pressure regulator and pressure gauge ensure the system runs at consistent and optimal pressure ranges. The flow meter monitors the actual volume of water being applied to the system to ensure expected amount of water is applied to the system.
Filters are important to prevent clogging in microsprinklers and drip irrigation. Screen filters with a 150 to 200 mesh screen or comparable disc filters are suitable for city water or ground water. Sand filters are necessary for surface water, and a sand separator might also be necessary. A thorough discussion of filters is available in “Filtration, Treatment, and Maintenance Considerations for Micro-Irrigation Systems” from Virginia Tech. If acid, fertilizers, or pesticides will be injected into irrigation water, a backflow preventer between the injection point and water supply is necessary to prevent the material from contaminating the water source.
Detailed information about irrigation components can be found in specialized irrigation publications. “Drip-Irrigation Systems for Small Conventional Vegetable Farms and Organic Vegetable Farms” by the University of Florida, IFAS Extension, offers an excellent overview of irrigation system designs and components.
Chapter 5. Irrigation Water Quality
Irrigation water quality can be evaluated based on its chemical, biological, and physical properties. It plays a critical role in vegetable production, influencing crop growth, soil conditions, equipment performance, and, in some situations, produce safety. Understanding these key water quality parameters and taking preventive measures, producers can avoid potential production issues.
Irrigation water quality should be assessed in the context of a given production system. This bulletin primarily addresses water quality for soil-based vegetable production. For hydroponic systems, where all plant nutrients are supplied through water, knowing the precise mineral content is crucial for determining any additional nutrients that need to be added. Hydroponic producers should follow guidelines specifically designed for these systems. This bulletin focuses on water quality parameters most likely to impact vegetable production on small farms in Indiana. Since most laboratories provide recommended ranges for each parameter in the reports, the desired ranges are not included in the bulletin.
Chemical Characteristics of Irrigation Water
The chemical characteristics of irrigation water encompass factors like pH, alkalinity, salinity, and the presence of specific minerals that can be of concern. Depending on water sources, attention should be placed on specific parameters.
pH and alkalinity
pH and alkalinity are related to irrigation water’s acidity and basicity and potential impact on soil pH. pH is a measure of whether the water is acidic or basic. pH 7 is neutral, less than 7 is acidic, and greater than 7 is basic. pH of Indiana well water typically ranges between 6.5 to 8. High pH is common in groundwater in Indiana, which is usually associated with high alkalinity.
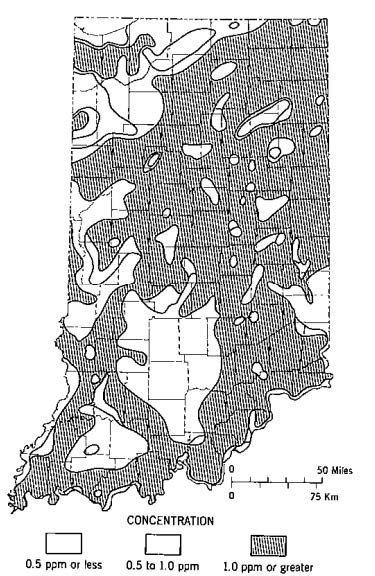
Alkalinity is the ability of water to neutralize acid. It is caused by bicarbonates, carbonates, and hydroxides dissolved in the water. Alkalinity is often reported as bicarbonate (HCO3) in units of milligrams per liter (mg/l) or parts per million (ppm). For Indiana groundwater, alkalinity is closely related to water hardness. Both alkalinity and hardness are also reported as calcium carbonate (CaCO3), in units of mg/l or ppm, or milliequivalents per liter (meq/l). Most Indiana groundwater is considered very hard. Localized areas of exceptionally hard water are found in northwestern Indiana in Lake County, south-central Indiana in Harrison and Washington counties, and northeastern Indiana in Adams County (Figure 31).
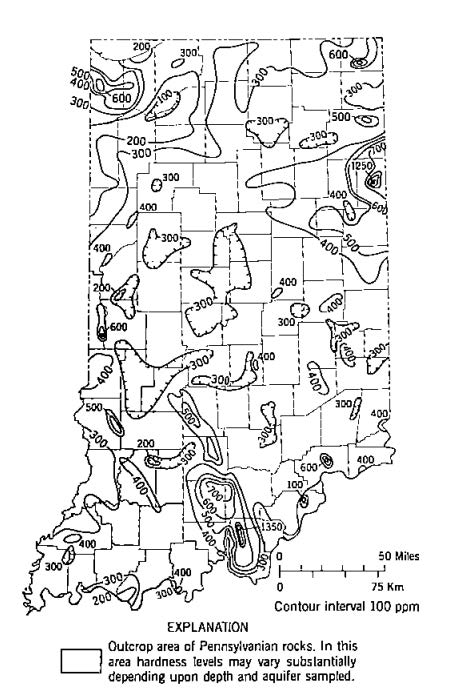
water hardness of groundwater in parts per million (ppm)
CaCO3. The map is adapted from Water Quality, Indiana
Department of Natural Resources. https://www.in.gov/
dnr/water/files/804_Water_Quality.pdf
Although high pH and alkalinity are common issues in Indiana’s groundwater, they are rarely a concern when surface water is used as the main water source for irrigation.
Problems caused by alkaline water
In open field production, high alkalinity in irrigation water can lead to problems such as emitter clogging and lime deposits on irrigation system components.
In high tunnels, in addition to the lime deposits, the primary concern with alkaline irrigation water is the gradual increase in soil pH over time. This is because the alkalinity often results from dissolved calcium and/or magnesium carbonates, which are essentially dissolved lime. With each irrigation, a small amount of lime is added, accumulating over the season. For example, applying an inch of water per week for 15 weeks with water containing 450 ppm bicarbonate is equivalent to applying 85 lb. per acre per week of calcium carbonate lime, or more than half a ton per acre over the 15 weeks.
Sandy soils will experience pH increase more rapidly than heavier soils or soils with greater cation exchange capacity. Eventually, the soil pH can rise to a level where mineral nutrients become less available for plant uptake. Micronutrients such as manganese, iron, and zinc become less available at high pH levels, with manganese availability declining the most rapidly.
In addition to raising soil pH, using high-alkalinity water in covered structures over time may elevate soil levels of calcium and/or magnesium. While calcium and magnesium are essential plant nutrients, excessive levels can interfere with the uptake of potassium. Tomatoes require substantial amounts of potassium to produce high-quality fruit. If soil calcium and magnesium levels are excessively high relative to potassium, plants may not be able to absorb enough potassium, which increases the potential of developing yellow shoulder fruit (Figure 32).
disorder typically occurs due to a deficiency in
potassium, which might be caused by high levels of
calcium and magnesium in the soil.
Strategies for addressing alkaline water
For soil production in the open field, as natural rainfall contributes significantly to plant water needs, it is less likely that alkaline irrigation water would raise soil pH. However, if scale buildup or plugging is a problem, water may need to be acidified as discussed below.
In high tunnels, it is important to monitor soil pH annually and track changes over time to identify the trends. If irrigation water alkalinity is causing an increase in soil pH, consider using an alternative water source with lower alkalinity or mixing it with the less alkaline water. Surface water from ponds, streams, or rainwater collected in tanks generally has low alkalinity.
If needed, high alkalinity water can be treated by injecting acids such as sulfuric, phosphoric, or nitric acid. A calculator to determine the appropriate amount of acid to use can be found at https://alkcalc.egromobi.com/. For more detailed guidance, the article “Adjusting alkalinity with acids” by University of Massachusetts Extension provides comprehensive information on acid use for irrigation water. It is essential to use the correct amount of acid to avoid excessively lowering the pH, which can lead to other issues. Additionally, concentrated acids are hazardous, so proper safety precautions must be followed. In organic production, some farmers may choose to use citric acid, though its effectiveness and economic feasibility have not been fully tested.
Acid injection can also be used intermittently to prevent clogging and carbonate precipitation. For this purpose, it is recommended to inject enough acid to lower the water pH below 4, then run the water for 30 minutes to an hour. Other water treatments, such as reverse osmosis, and potassium-based water softeners, can also be used to reduce alkalinity and lower pH. However, the cost-effectiveness of these systems has not been fully evaluated in soil production.
Most vegetable crops thrive in slightly acid soil with pH range of 6.0 to 6.5. If soil pH rises above 7, amendments such as elemental sulfur, and ammonium-based fertilizers can be used to lower it. For more detailed information on adjusting soil pH, refer to article “Lowering Soil pH for Horticulture Crops” by Purdue Extension.
Other chemical parameters
Iron – Groundwater in Indiana commonly has higher iron concentrations than the recommended maximum of 0.3 ppm (Figure 34). In aquifers, iron is in the ferrous form, dissolved in the water. When the water is brought to the surface and through an irrigation system, the pH and oxygen levels in the water increase, causing the iron to change to the insoluble ferric form. It forms orange or reddish precipitates that can plug emitters and look like a coat of rust on areas wet by the water (Figure 35). It can also promote growth of iron bacteria, which create slime and additional plugging.
concentration of iron in ground water (ppm). The map
is adapted from Water Quality, Indiana Department
of Natural Resources. https://www.in.gov/dnr/water/
files/804_Water_Quality.pdf
To prevent plugging, a common strategy is to force the iron into the insoluble form and remove the precipitate before it reaches the emitters. It is also possible to use softeners to remove iron in water. Refer to article “Management of iron in irrigation water” by Rutgers Cooperative Research & Extension.
Salinity – Salinity refers to the total concentration of dissolved salts in water, typically measured using electrical conductivity in units of deci-Siemens per meter (dS/m) or millimhos per centimeter (mmho/cm). High soil salinity levels can negatively affect crop growth, but this issue usually stems from salt accumulation due to fertilizers or certain soil amendments. In Indiana, high salinity in irrigation water is rarely a concern.
Sodium – Sodium contributes to salinity and is reported in units of mg/l or ppm. While high sodium levels in untreated well water are uncommon in Indiana, it can still occur. Some aquifers naturally contain elevated sodium levels, and sodium can also enter wells through contamination from road salts or other sources. Common water softeners remove calcium and magnesium and replace them with sodium. It is not recommended to use sodium-softened water for
irrigation.
Boron – Boron is a micronutrient essential for plant growth in very small quantities. However, excessive boron is toxic, and the range between sufficient and harmful amounts is narrow. Although high boron levels in well water are uncommon in Indiana, its presence should be monitored.
Chloride – Chloride levels are generally low in natural water sources in Indiana, but treated water may have higher concentrations. Chloride concentrations above 300 ppm are toxic to sensitive crops when absorbed through the roots. Additionally, overhead irrigation water with chloride levels above 175 ppm can cause toxicity in tomato leaves.
Manganese – Manganese levels in Indiana wells can exceed recommended levels. The primary concern for irrigation is that manganese can form a black precipitate, which may clog irrigation systems. However, manganese precipitates much more slowly than iron, making it less of an issue in irrigation water.
Sulfate – Sulfate concentrations can be high in Indiana well water, causing unpleasant taste and odor. However, since sulfur is an essential plant nutrient, its presence in irrigation water is not problematic. Instead, sulfur from irrigation water can be factored into nutrient management plan.
Nitrate-nitrogen – Nitrate-nitrogen is often measured in irrigation water, with high concentrations typically indicating contamination from fertilizer runoff, leaching, sewage, or manure storage. Concentrations above 10 ppm in drinking water pose significant health risks. However, since nitrogen is a key plant nutrient, nitrate-nitrogen in irrigation water is not a problem for plant growth. High levels can be incorporated into the overall nutrient management plans.
Biological Characteristics of Irrigation Water
Biological concerns include microbes — bacteria, fungi and others — and algae. Slime-producing iron bacteria were discussed above. There are similar sulfur bacteria that produce a white slime and can also be managed with chlorine.
Plant pathogens can occasionally be found in surface water. Pythium and phytophthora are two fungi like organisms — water molds — with spores adapted to moving around in water. Phytophthora has been found in surface waters, such as streams. The spores move with runoff from a field into retention ponds and streams, which may later be used for irrigation, moving the pathogen to another field. Plant diagnostic labs don’t routinely test irrigation water for plant pathogens, but they can help diagnose disease problems when you suspect a link to irrigation water quality. For help, contact Purdue Plant and Pest Diagnostic Lab.
Human pathogens in irrigation water are a food safety concern. Good Agricultural Practices (GAPs) for food safety include guidelines for assessing and reducing risk in irrigation systems, water sources, and irrigation practices. Producers covered under the federal Produce Safety Rule (PSR) of the Food Safety Modernization Act (FSMA) are required to assess agricultural water for potential contamination risks at least annually, which can include testing irrigation water for generic E. coli. In addition, growers should assess the entire irrigation system for risk and implement corrective actions if necessary. It is recommended that all producers of fresh produce follow these guidelines. Producers who are
required by their buyers to pass a third-party GAPs audit will likely need to test water as part of their food safety protocol. Learn more at Safe Produce Indiana, including how to determine if you are covered under the PSR.
A key approach to dealing with human pathogenic bacteria is to, when possible, understand relative risk of various practices, choose less risky practices, and use best practices to mitigate those risks. The source of the water is an important factor in risk. Municipal and other public water systems maintain water at standards for drinking and so are at very low risk for contamination with human pathogens. Private wells have a medium risk because they can become contaminated from septic systems, wildlife, or manure if not maintained properly, and are not tested as frequently. Ponds, streams, rivers and other surface water carry the most risk, as they are the most likely to contain pathogens.
The method of water application also influences risk of contaminating produce. Practices that allow irrigation water to contact the edible part of the crop are the riskiest: sprinkler irrigation of tomatoes, or for root crops, any irrigation that wets the soil around the edible root. Drip irrigation with the drip tape placed underneath a mulch or buried in the soil would have a low risk for a tomato crop.
Physical Characteristics of Irrigation Water
Water sediments
Irrigation water from a pond, stream, or cistern may contain algae or sediment that can plug or damage equipment. Algaecides containing chlorine or copper sulfate can be used in some situations. Filters are critical for catching sediment. Sand filters are commonly used for this purpose. A pair of containers filled with sand catches the sediment. Periodically the filters must be back-flushed. Sand filters are available from irrigation supply companies, or can be made on the farm as described in the publication “Low-Cost Irrigation Sand Filter” by the University of Vermont Extension.
Water temperatures
The temperature of irrigation water can significantly impact seed germination and plant growth. During the summer, using cooler water may enhance the germination of heat-sensitive seeds such as spinach and lettuce. Surface water may not be cool enough to make a significant difference, so if groundwater is readily available, that would be a better choice for cooling the soil. In later fall, winter and spring, when soil temperatures are low, irrigation with warm water can help raise soil temperatures, promoting faster plant growth. This is especially beneficial for warm-season crops, such as cucumbers, grown in the spring.
Irrigation Water Tests
Chemistry tests
Municipal and public water supplies are required to test water regularly and provide results to users. Contact a water department to request the results. The standard report mailed to customers may not include information on all of the chemistry discussed above.
Several commercial laboratories offer testing services for private well water or surface water to assess irrigation suitability. The followings are examples. This is not an all-inclusive list.
In addition to a comprehensive irrigation water suitability test by a commercial lab, on-farm tools are available for testing pH, electrical conductivity (EC), alkalinity (or hardness), and nitrate-nitrogen. The least expensive are color-based systems, such as litmus paper for pH, or alkalinity or nitrate test strips. While these methods are less precise, they offer quick and easy results.
For growers who frequently mix soluble fertilizer, inject acid into irrigation system, or regularly monitor growing medium pH or electrical conductivity, having a reliable pH and EC meter is extremely useful. These meters can also be used to test irrigation water. New technologies that integrate with smartphones are likely to become available, offering even more convenient and capable testing options.
Biological tests
Testing water for food safety purposes involves testing for the indicator bacteria generic E. coli. If generic E. coli is present, it is likely that the water has been contaminated with fecal matter, and human pathogens are more likely to be present. If indicator bacteria are present in high numbers the water must be treated before use, or applied in a way that it will not contact the edible portion of produce normally eaten raw.
Refer to the publication “Indiana Water Testing Labs” by Safe Produce Indiana for a complete list of labs that perform the test for generic E. coli. If you wish to use the water source for drinking, hand-washing or washing produce as well as irrigation, a presence/absence test is adequate because zero detectable E. coli is permitted in water used for those purposes. If you need to use the water source only for irrigation, choose a lab that offers quantification. Be sure to follow closely the instructions the lab will send for collecting the sample and sending it in for testing.
Frequency of irrigation water testing
The chemistry of well water can change over time. An annual test before the irrigation season would allow timely actions before the season starts. If annual tests show little to no variation, it may be reasonable to extend the time between tests, provided there are no changes (e.g., droughts or increased aquifer usage) that could impact water quality. For food safety purposes, it is highly recommended that water testing be conducted at least annually if the grower is held to no other regulatory or buyer-driven requirements. Be sure to consult specific food safety regulations for detailed water testing requirements.
For more information on irrigation water quality, the Clean Water3 website offers a wealth of resources covering this topic.
Chapter 6. Mulches and Water Management
Using mulch to maintain soil moisture is highly effective and widely adopted on small farms. In addition to conserving moisture, mulch plays a crucial role in controlling weeds and reducing soil erosion. Additionally, natural mulches contribute to soil fertility over time as they decompose.
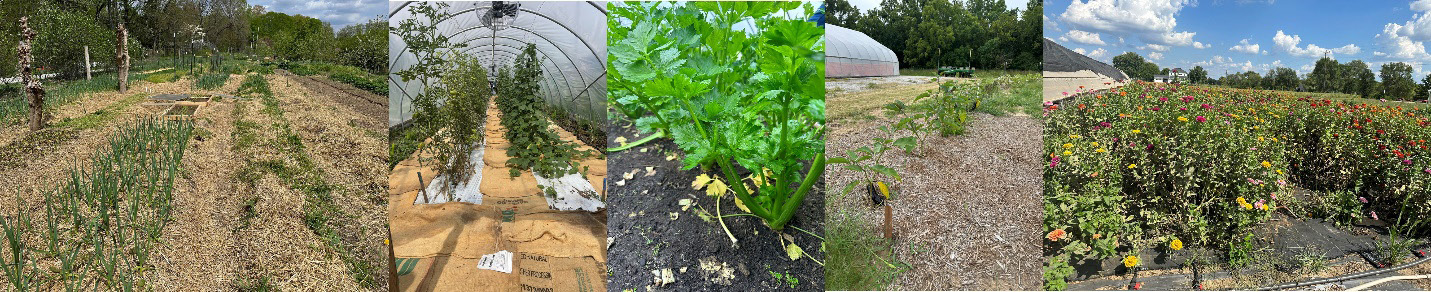
While traditional vegetable farms often rely on plastic mulches, small farmers tend to use a variety of materials tailored to their specific needs and availability (Figure 36). These include synthetic options, such as plastic mulch and landscape fabric, as well as natural materials, such as straw, woodchips, compost, leaves and wool. Biodegradable materials, including paper, cardboard, and burlap bags, are also utilized on small farms.
For a comprehensive overview of different types of mulches, their applications, and their effects on soil health, refer to the “‘Mulches for Small Farms and Gardens Overview” by NRCS. This bulletin mainly focuses on the relationships between common mulches and water management.
As mentioned earlier, plants with extensive root systems, like tomatoes and melons, often extend their roots beyond the planting beds. Applying mulch to both planting beds and pathways helps retain soil moisture over a larger area, supporting root expansion and benefiting soil microorganisms, which enhances overall soil health. The effectiveness of mulch in retaining soil moisture, influencing soil temperature, and impacting soil health depends on the type used.
Black plastic mulch raises soil temperatures, making it particularly useful in the spring for growing warm-season crops. In contrast, white plastic mulch cools soil, making it beneficial for crops transplanted after the soil has warmed. Farmers may use white plastic instead of black plastic for summer-planted tomato and pepper to prevent heat damage to young seedlings, particularly around the planting holes.
Plastic mulch is impermeable to water, and when combined with drip irrigation it significantly enhances irrigation efficiency. However, when plastic mulch is used with overhead irrigation or relies primarily on natural precipitation, the soil beneath it can become drier than adjacent areas. This is because roots absorb the moisture, and the plastic blocks water from reaching the soil underneath the plastic. Soil in the bed will get water only after heavier rain or irrigation leads to water infiltration into the bed from the sides and from the water that enters the planting holes. While drier conditions under plastic mulch can be advantageous in excessively wet situations, they negatively impact crops when irrigation and rainfall are limited. A drawback of using plastic mulch is the lack of options for reuse or recycling if it is not biodegradable.
Compost made from leaves and other plant materials, or food wastes, is often applied as a mulch on top of the soil. Typically, a 2-inch layer of compost is used, which effectively suppresses weeds and significantly improves soil fertility. Some farmers may plant seeds directly into the compost mulch. However, as the dark color of the compost can cause the surface to dry quickly, special attention must be given to maintaining adequate moisture for seed germination. Additionally, if the compost hasn’t been thoroughly watered, it may have high salts, which can inhibit seed germination. Compost made from plant- or animal-based materials can lead to excessive phosphorus buildup in the soil, potentially
causing nutrient imbalances. Regular soil tests should be conducted to monitor these changes.
Woodchips are highly effective at maintaining soil moisture, and when applied 3-4 inches deep, they often provide better weed control compared to straw mulch of the same depth. However, woodchips have drawbacks when used as mulch in vegetable planting rows. In excessively wet conditions, the soil beneath woodchips can become saturated for extended periods, which can hinder plant growth. If this saturation occurs early in the season, it can damage roots, making recovery difficult and potentially affecting growth and yield for the remainder of the season. As a result, woodchips are generally not recommended for vegetable planting beds in open fields exposed to natural rainfall in Indiana,
though they are an excellent choice for pathways. Additionally, when mulch materials with high carbon content are incorporated into the soil, additional nitrogen needs to be applied to support immediate crop production.
When using organic mulch with transplanted plants, ensure the mulch does not come into direct contact with the plant stems. Direct contact can increase the risk of diseases occurred around the stem, which may lead to plant death.
Suggested Resources
Chapter 1
Midwest Vegetable Production Guide.
Chapter 2
Water Drainage at High Tunnel Improved. Missouri State University.
Indiana High Tunnel Handbook. Purdue University Extension.
Web Soil Survey. USDA, NRCS.
Reference Evapotranspiration Forecasts Across Indiana. Vegetable Crops Hotline.
Monitoring Potential Evapotranspiration Across Indiana. Vegetable Crops Hotline.
Crop Evapotranspiration- Guidelines for Computing Crop Water Requirements – FAO Irrigation and Drainage paper 56.
Irrigation of Field Crops in Indiana. Purdue University Extension.
Soil Texture Calculator. USDA, NRCS.
Root Development of Vegetable Crops.
Chapter 3
Estimating Soil Moisture by Feel and Appearance. USDA, NRCS.
Improving Irrigation Water Use Efficiency: Using Soil Moisture Sensors. Michigan State University Extension.
Principles and Practices of Irrigation Management for Vegetables. University of Florida, IFAS Extension.
Chapter 4
Filtration, Treatment, and Maintenance Considerations for Micro-Irrigation Systems. Virginia Cooperative Extension.
Drip-Irrigation Systems for Small Conventional Vegetable Farms and Organic Vegetable Farms. University of Florida, IFAS Extension.
Chapter 5
Water Quality. Indiana Department of Natural Resources.
Adjusting Alkalinity with Acids. University of Massachusetts Extension.
Lowering Soil pH for Horticulture Crops. Purdue University Extension.
Management of Iron in Irrigation Water. Rutgers Cooperative Research & Extension.
Purdue Plant and Pest Diagnostic Lab.
Low-Cost Irrigation Sand Filter. University of Vermont Extension.
Waters Agricultural Laboratories.
Indiana Water Testing Labs. Safe Produce Indiana.
Chapter 6
Mulches for Small Farms and Gardens Overview. USDA, NRCS.
Acknowledgments
We extend our deepest gratitude to Dr. Sanjun Gu and Dr. Petrus Langenhoven for their comprehensive review of this publication and their valuable insights. We also thank Extension colleagues Drs. Younsuk Dong, Scott Monroe, Amanda Deering and Tom Creswell for their suggestions on individual chapters. Special thanks go to Cara Bergschneider, Indiana State Urban/Small-Scale Conservationist, for her valuable perspectives. Finally, we deeply appreciate the generosity of Indiana farmers, including Bud Vogt, Rachel Beyer, Jim Baughman, Juan Carlos Arango, and Mike Record, among others, who graciously shared their insights and experiences.
Funding for this publication was made possible by the Indiana State Department of Agriculture through grant A337-22-SCBG-21-003. Its contents are solely the responsibility of the authors and do not necessarily represent the official views of the ISDA.
All photos except Figure 23 by Wenjing Guan and Elizabeth Maynard.