Identifying Causes: Airflow Visualization
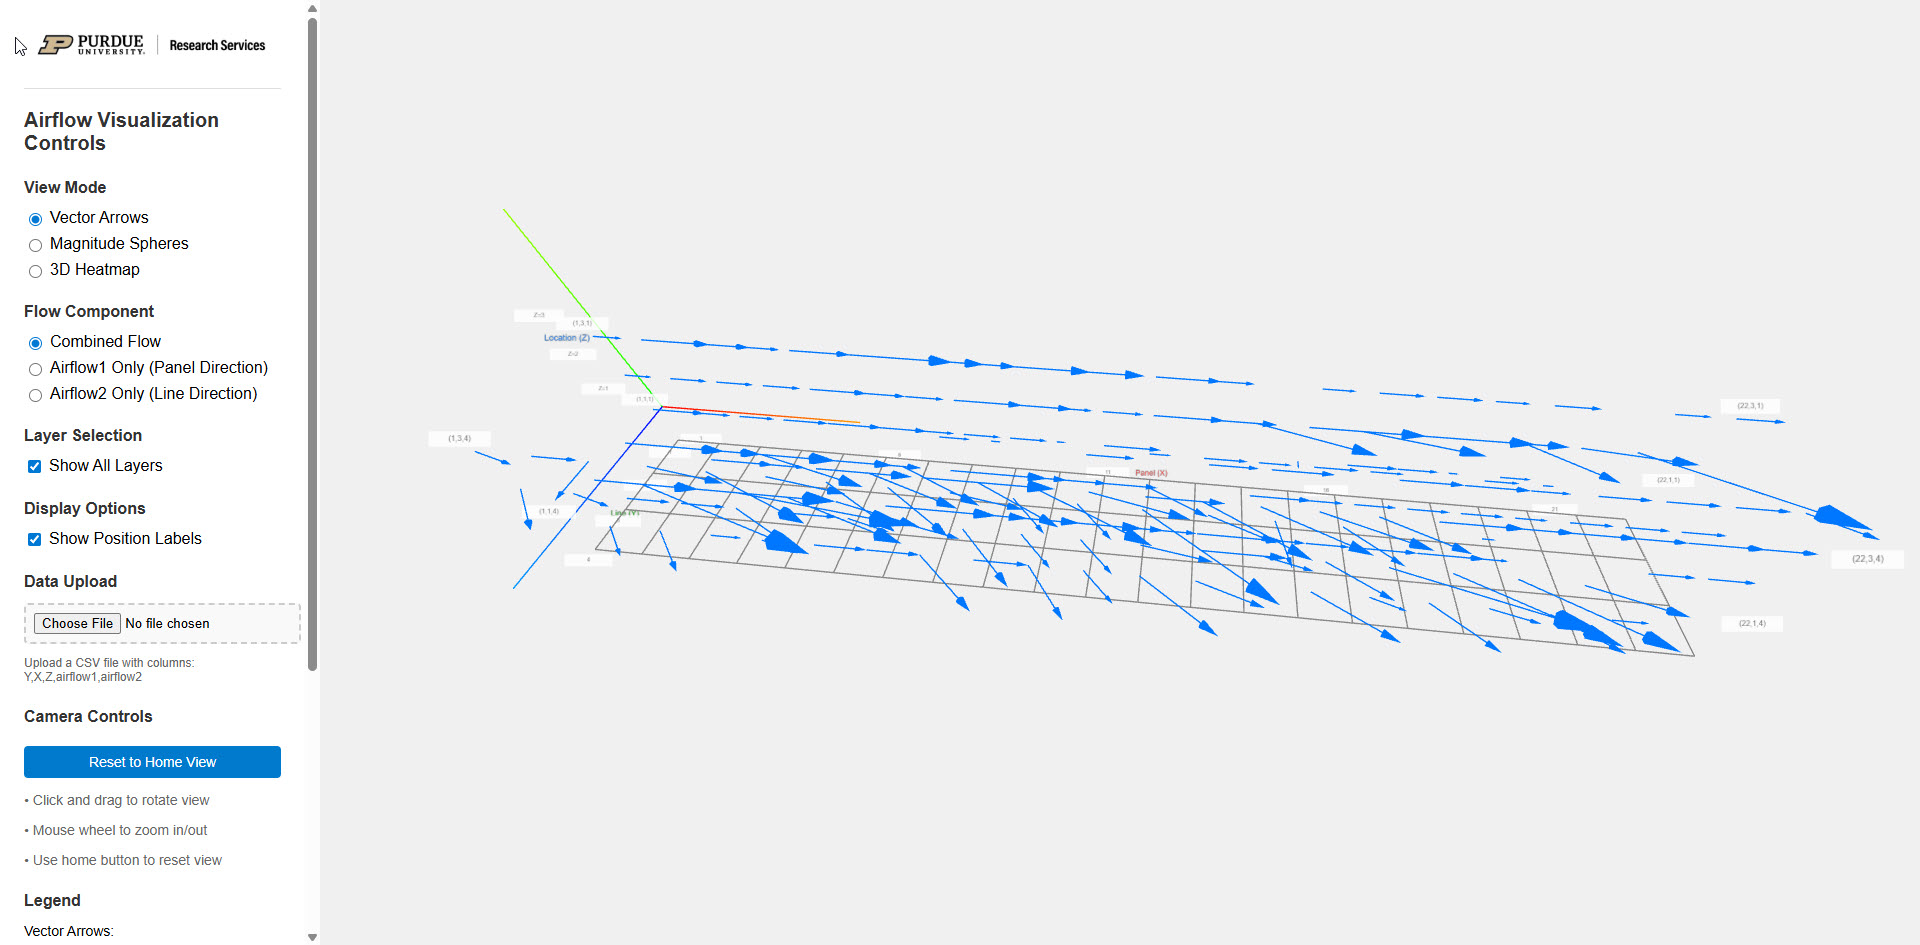
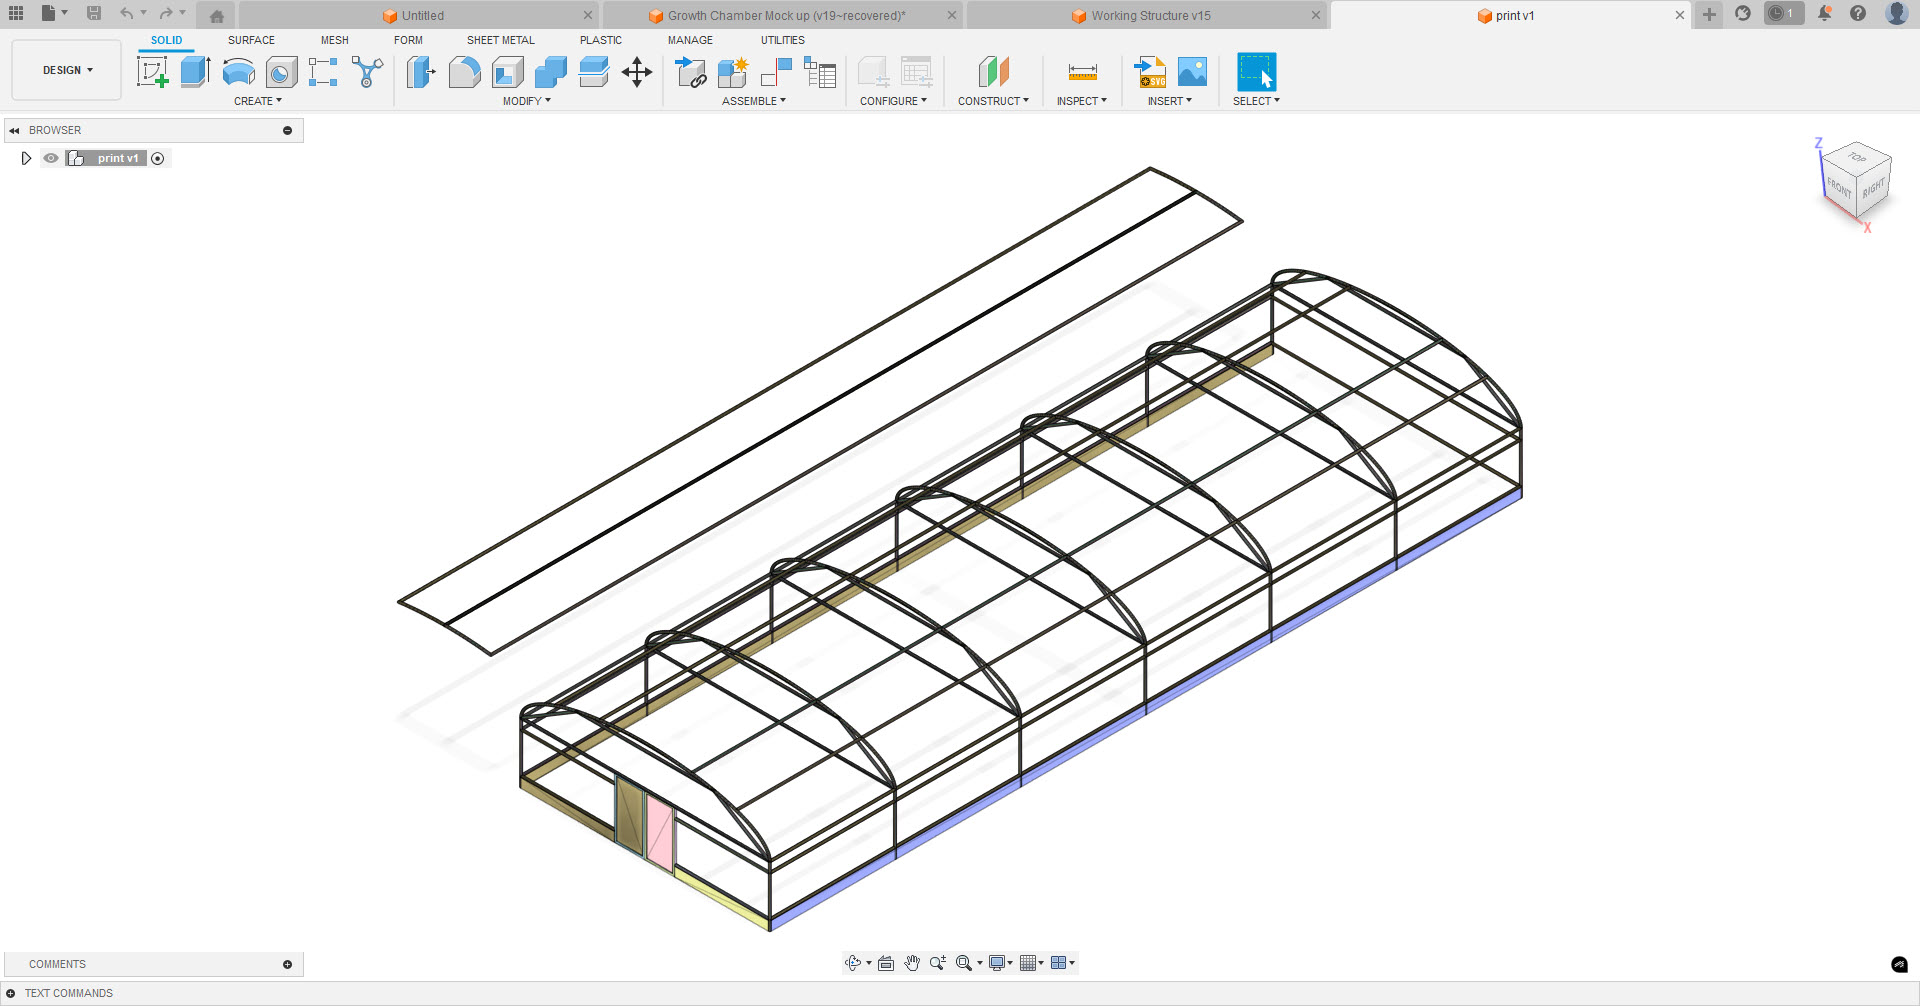
The Purdue Student Farm faced challenges with inadequate plant transpiration within their year-round controlled environment growing containers. While the farm team had collected airflow data through their own measurements, they needed a clearer way to interpret these findings. To address this need, Research Services developed an interactive web application that transformed their raw data into comprehensive 3D visualizations. This standalone tool allowed farm staff to explore their airflow measurements through multiple display options and independently update datasets as needed, eliminating the requirement for ongoing technical support.