

Equipment
CONTROLLED ENVIRONMENT PHENOTYPING FACILITY
The Ag Alumni Seed Phenotyping Facility (AAPF) employs a unique automated system that facilitates plant growth and high-throughput plant measurements in complex plant traits assessment. It supports a broad range of applications in plant science, crop breeding, agricultural engineering, molecular biology, and plant pathology. As researchers increasingly have access to relatively inexpensive genotypic data, there is a need for quantitative phenotypic data to complement this information. The AAPF can bridge this gap to help explain gene function, provide insight in nutrient use efficiency, soil-plant-atmosphere continuum dynamics, and how biotic or abiotic stress, such as drought stress, impact plant growth.
Two fully automated Conviron® growth chambers for >600 plants can provide precise environmental control over
- air temperature
- humidity,
- light intensity, and
- CO2 level (with the capability in CO2 enrichment in both chambers
The chambers can accommodate plants up to 4 meters (13 feet) tall. Both chambers are equipped with an automated, weight-based irrigation station that delivers precise amount of irrigation/fertigation solution to each individual plant. Multi-feed fertigation injection systems are able to provide multiple fertilizer recipes in both chambers.
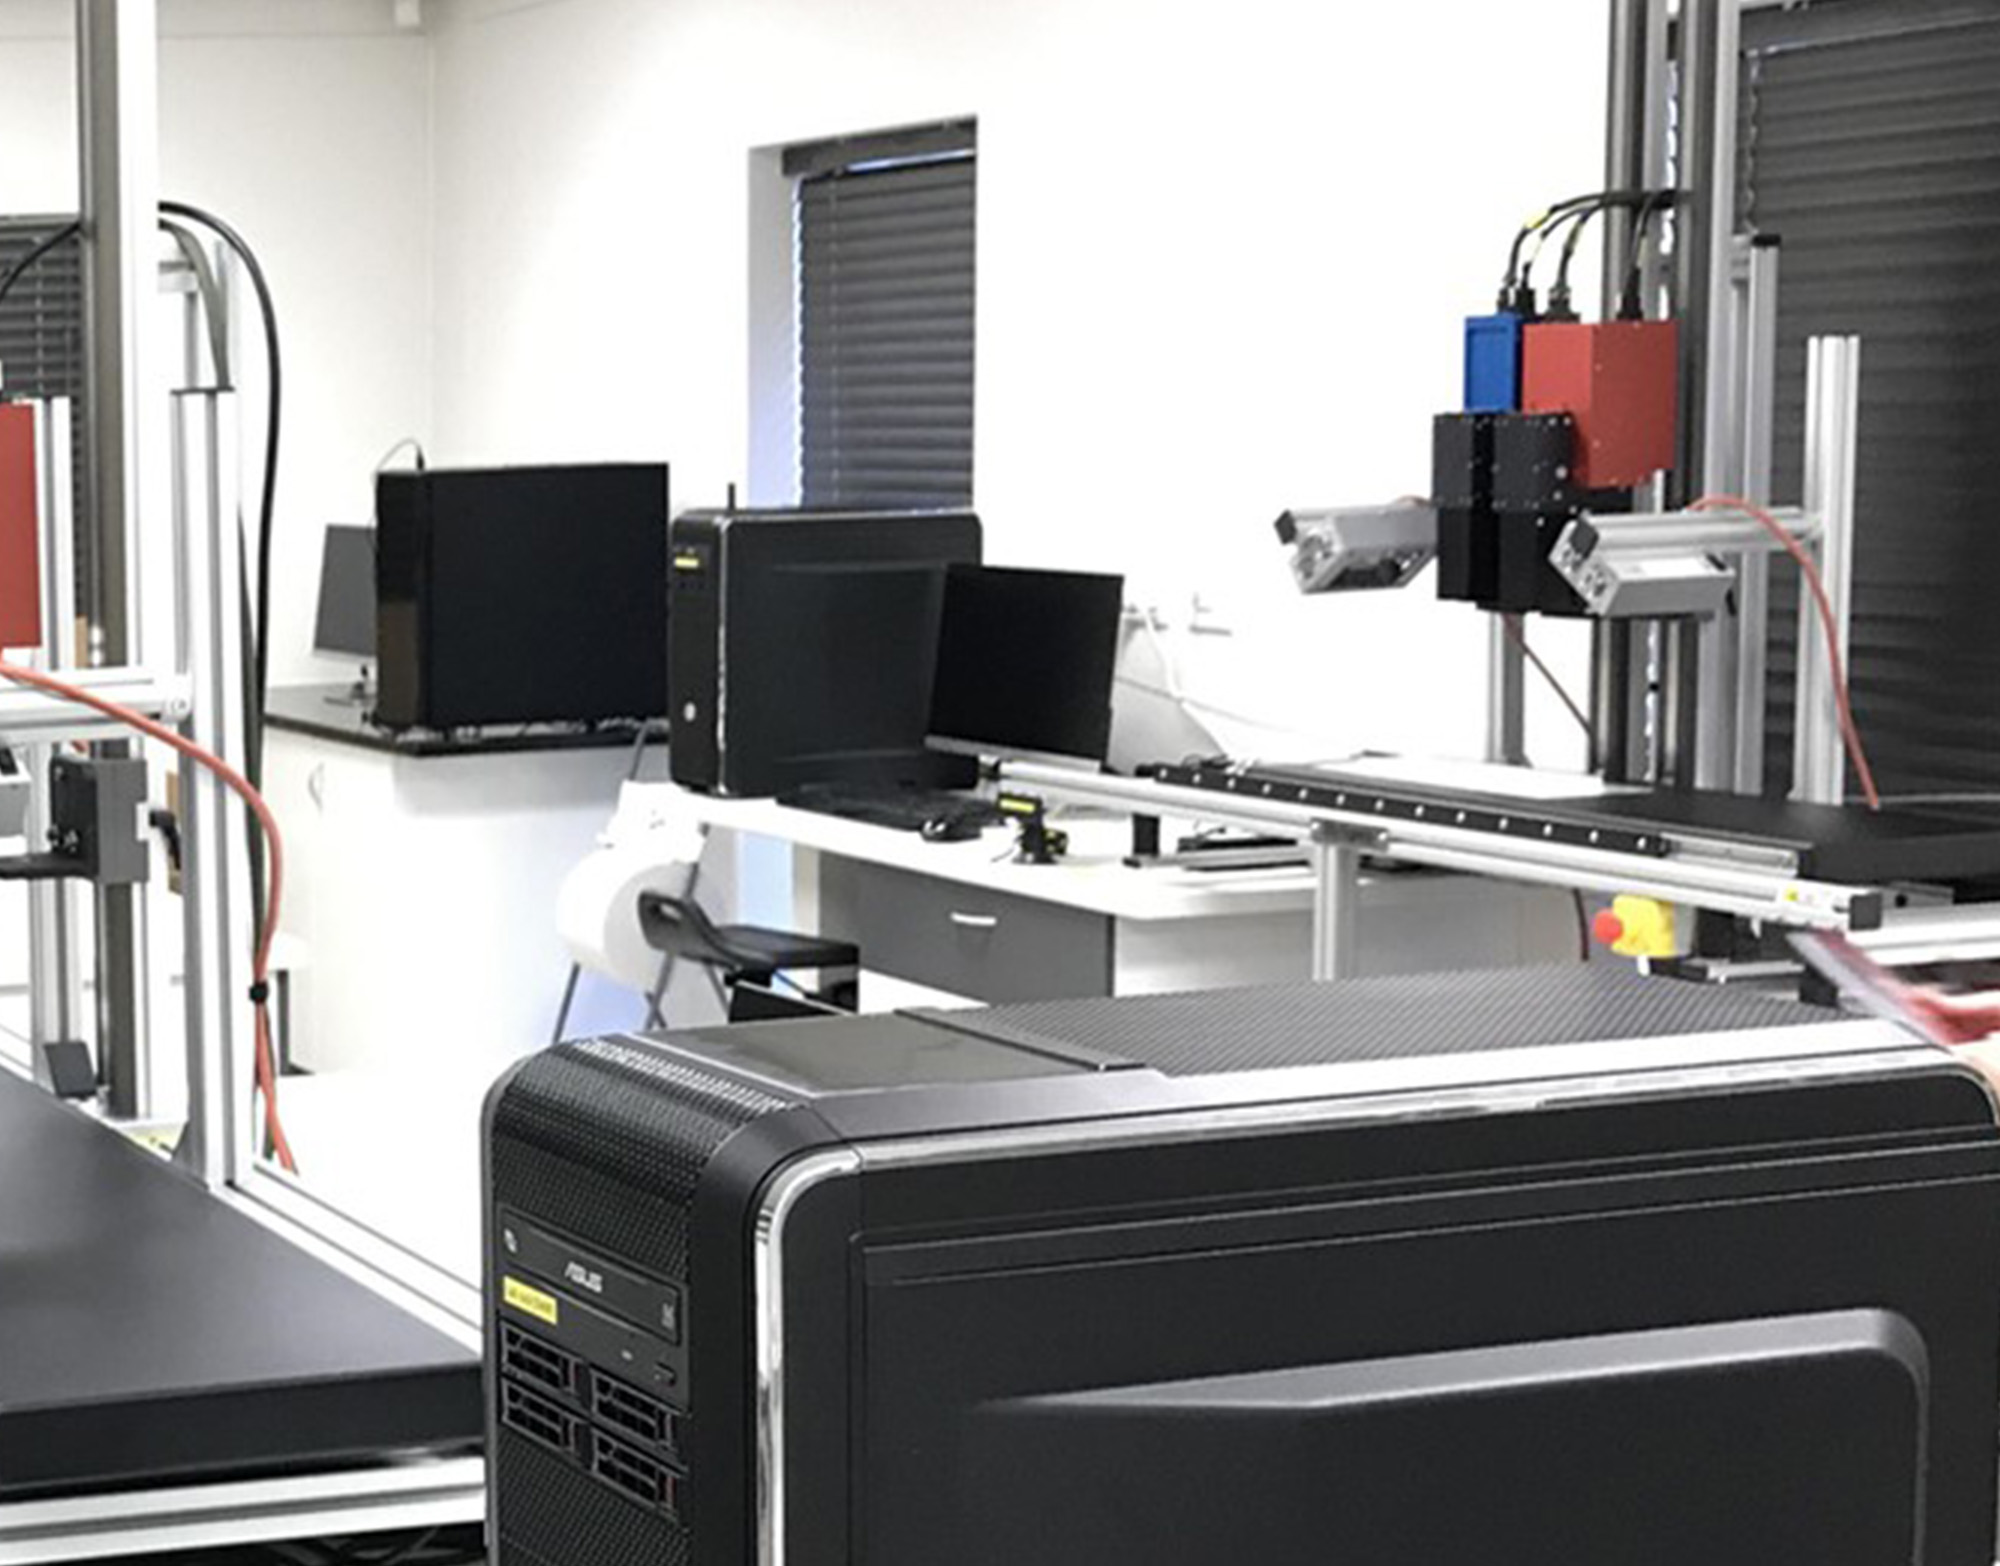
The facility possesses three (3) fully automated imaging systems
- The RGB imaging system acquires color images of a plant, automatically segments the images, and extracts predefined parameters to quantify plant growth over time, leaf color, and other morphological traits.
- The Hyperspectral imaging system has a scanning range in both the visible to near infrared (VNIR) region (400 – 1000 nm) and the short-wave infrared (SWIR) region (1000 – 2500 nm) and employs a sensor-to-plant principle in which linear scanning mechanisms carry the top- and side-view cameras to scan a plant, while the plant stops in the imaging booth. Both cameras are housed in imaging-booths to create optimal, repeatable lighting conditions for image acquisition by shielding out external light.
- The X-ray computed tomography (CT) root scanner provides the opportunity to non-destructively observe root architecture in 3-D at high temporal and high spatial resolution. Researchers can record root growth and architecture over an extended period of time to determine how a plant’s root respond to a changing environment.
In combination, these three fully automated imaging systems provide a scientist the capability to measure the shoot and root of the same plant sample in the same experiment.
Data Types
The RGB imaging system creates images in .png format. Images files created include
- the raw images,
- segmented images, and
- measurement images with key traits annotated.
The current RGB image processing pipeline produces an Excel sheet which contains the following traits: width, height, surface area, convex hull area, roundness, center of mass coordinates, Hue, Saturation, Intensity, Fluorescence value, the histograms of H, S, and I, and the histograms of Fluorescence.
The hyperspectral imaging systems acquire images in the VNIR and SWIR spectral regimes from both the top and the side of a plant, creating four hyperspectral data cubes:
- the top-view VNIR and SWIR image cubes
- the side-view VNIR and SWIR image cubes
Calibration image cubes of stand white boards are also acquired on a regular basis to provide the baselines for white referencing.
The data cubes are saved in the format that’s compatible with the ENVI format. Because of the nature of the hyperspectral imaging, the file size of these data cubes is normally quite significant—in some cases a data cube comes in with the file size around ~ 2 GB.
A data pipeline has been developed to process the acquired hyperspectral images. The output files from the process include two Excel sheets, of which one includes an array of fifty (50) vegetation indices. If the costumer would like to have specific indices implemented, we can work with the customer to provide the vegetation index/indices a research needs. The other Excel sheet provides the average spectral of the segmented target. The two-dimensional monochrome images of each computed vegetation index are also created and provided as the outputs.
The CT-Xray raw images are temporarily stored in the data-processing server for the CT. The RootForce software on the server will conduct the process in regard to reconstructing three dimensional images of the root volume (root + pot media), segmentation (3D root alone), and calculating traits/features of the segmented root architecture. The output of the whole process include 2D segmented monochrome root images, 3D root volume image, and an Excel sheet, which provides root traits such as root volume, root length, and root volume distribution etc.
Data storage
For each experiment, a temporary folder will be created in Purdue’s high-performance computing data-depot, under the directories “smarterag/data/RGB”, “smarterag/data/HSI”, and “smarterag/data/xray”, respectively, for the RGB, HSI, and Xray CT images and output files.
On the days the RGB images are acquired, a data-transferring pipeline will transfer all the .png files (raw images, segmented images, and measurement images) and the Excel sheets over to the experiment folder. The HSI files will be pushed into experiment folder directly. When certain image cubes need to be processed, the data will be identified and processed, and output will be added to the HSI folder. The raw CT Xray files, and the outputs from the Xray processing RootForce, will be pushed to the xray folder once all the acquired raw files are successfully processed on the CT Xray processing server.
After an experiment is wrapped up, the researchers will be provided a four-week grace period to create a local (or data-depot-based) backup. The AAPF staff can provide assist to the researchers in backing up their data. After the four-week grace period, the folder that belongs to the experiment will be transferred to the long-term storage environment in Fortress, and will be deleted from the Data Depot space.
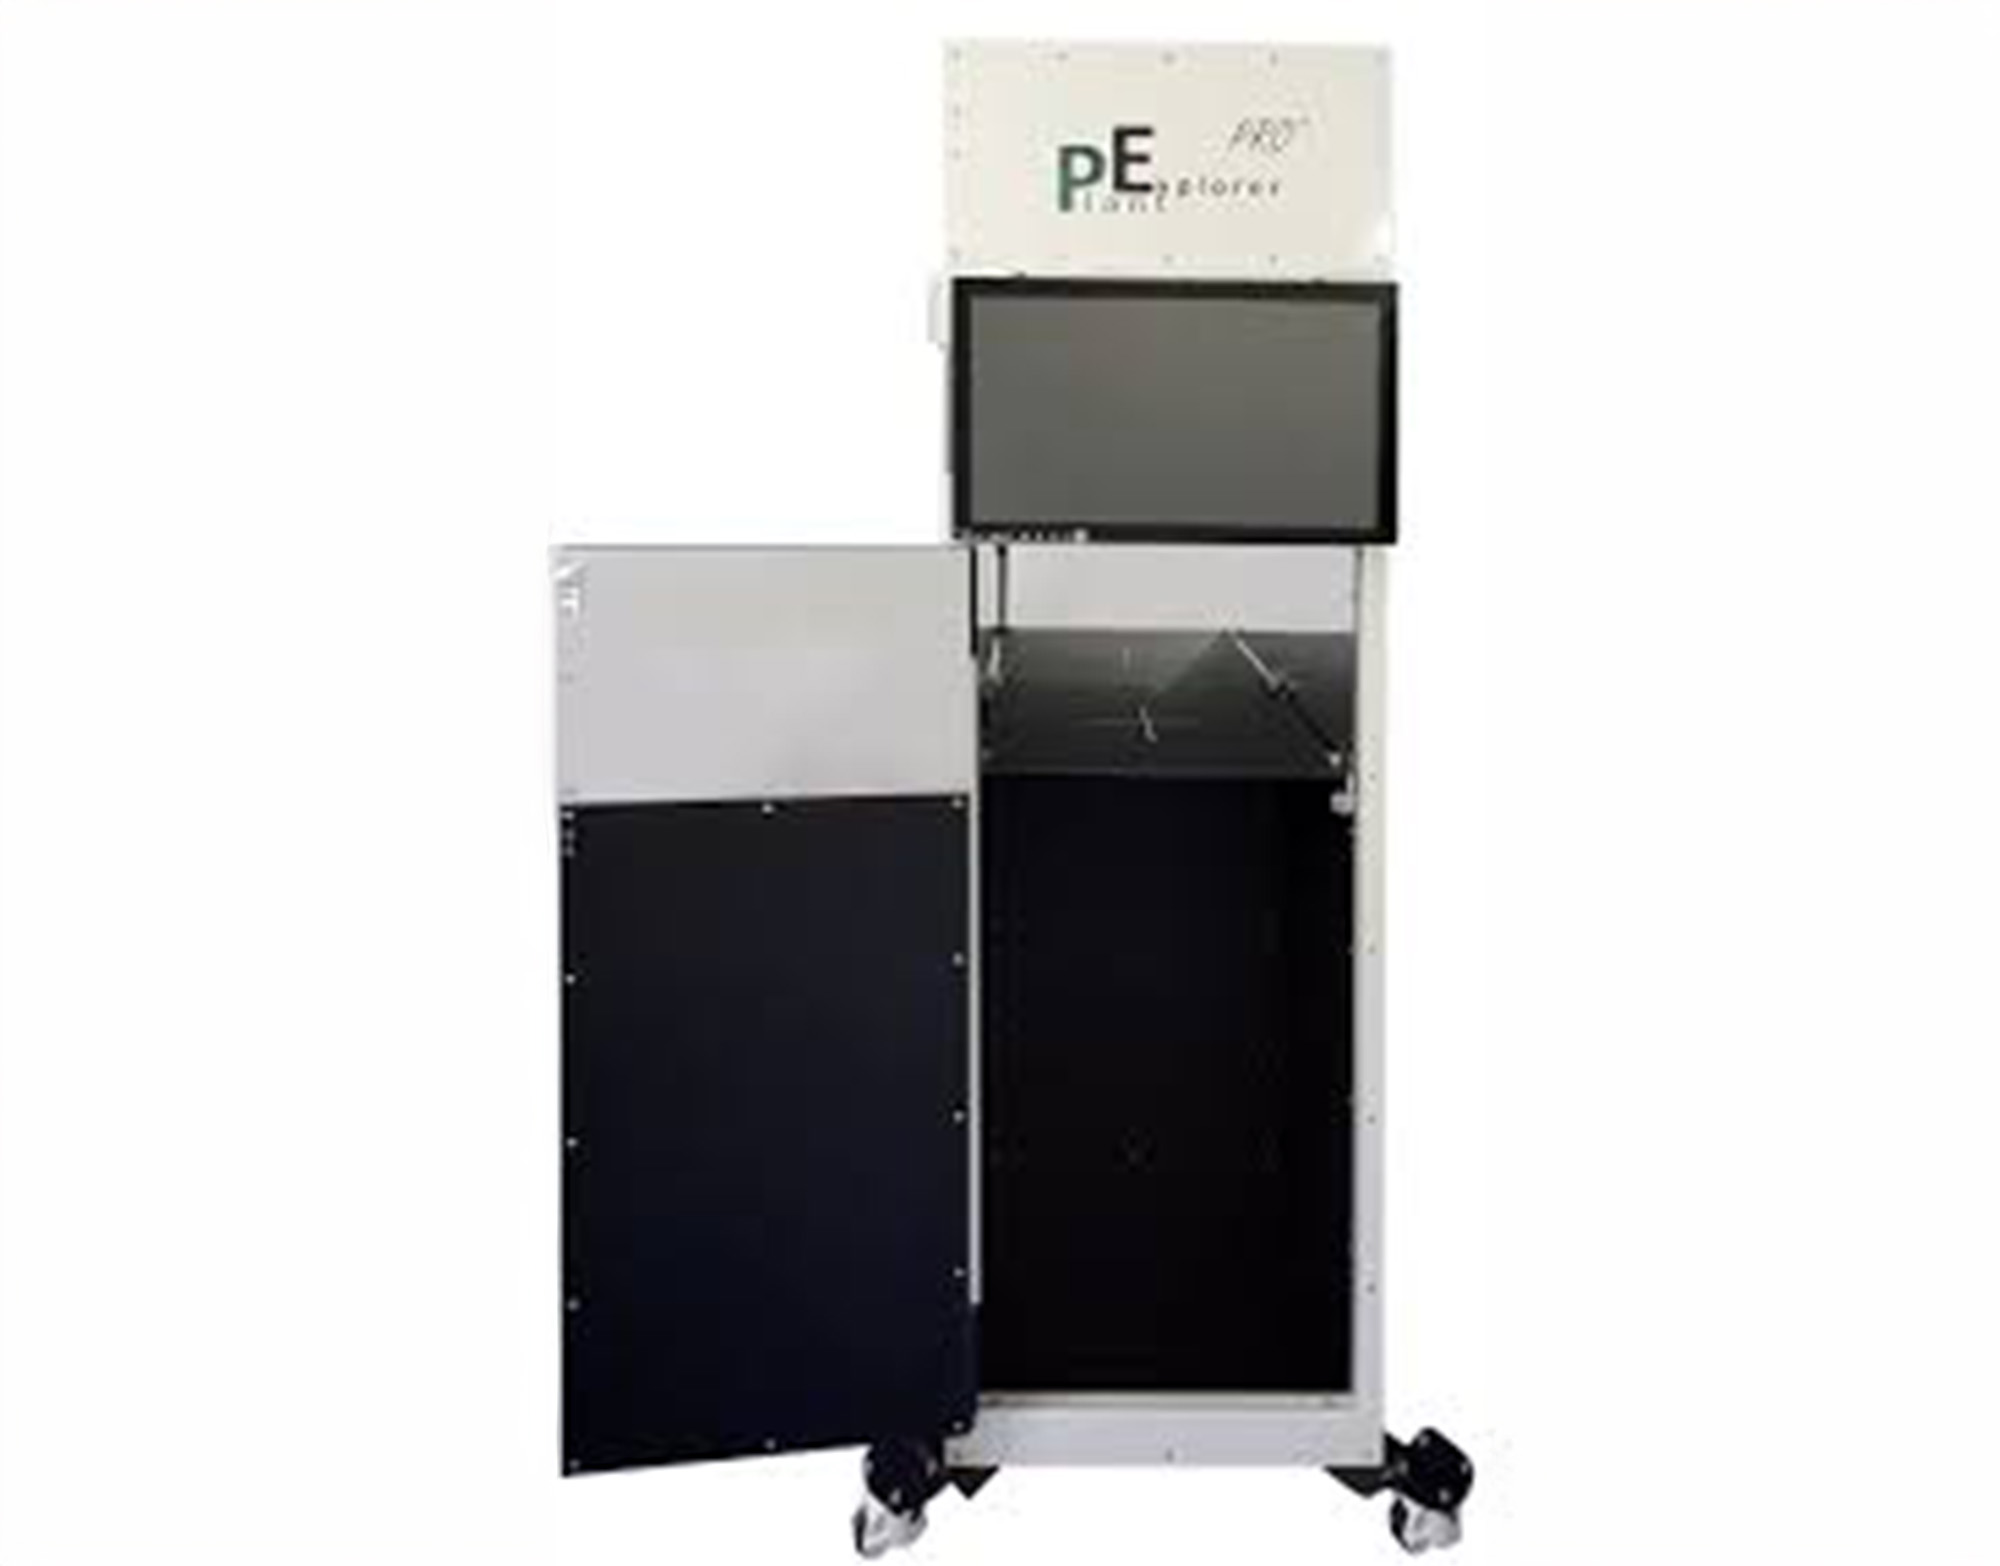
PlantExplorer PRO
High-resolution fluorescence and multispectral imaging system; for detecting and assessing disease and/or herbicide induced injuries.
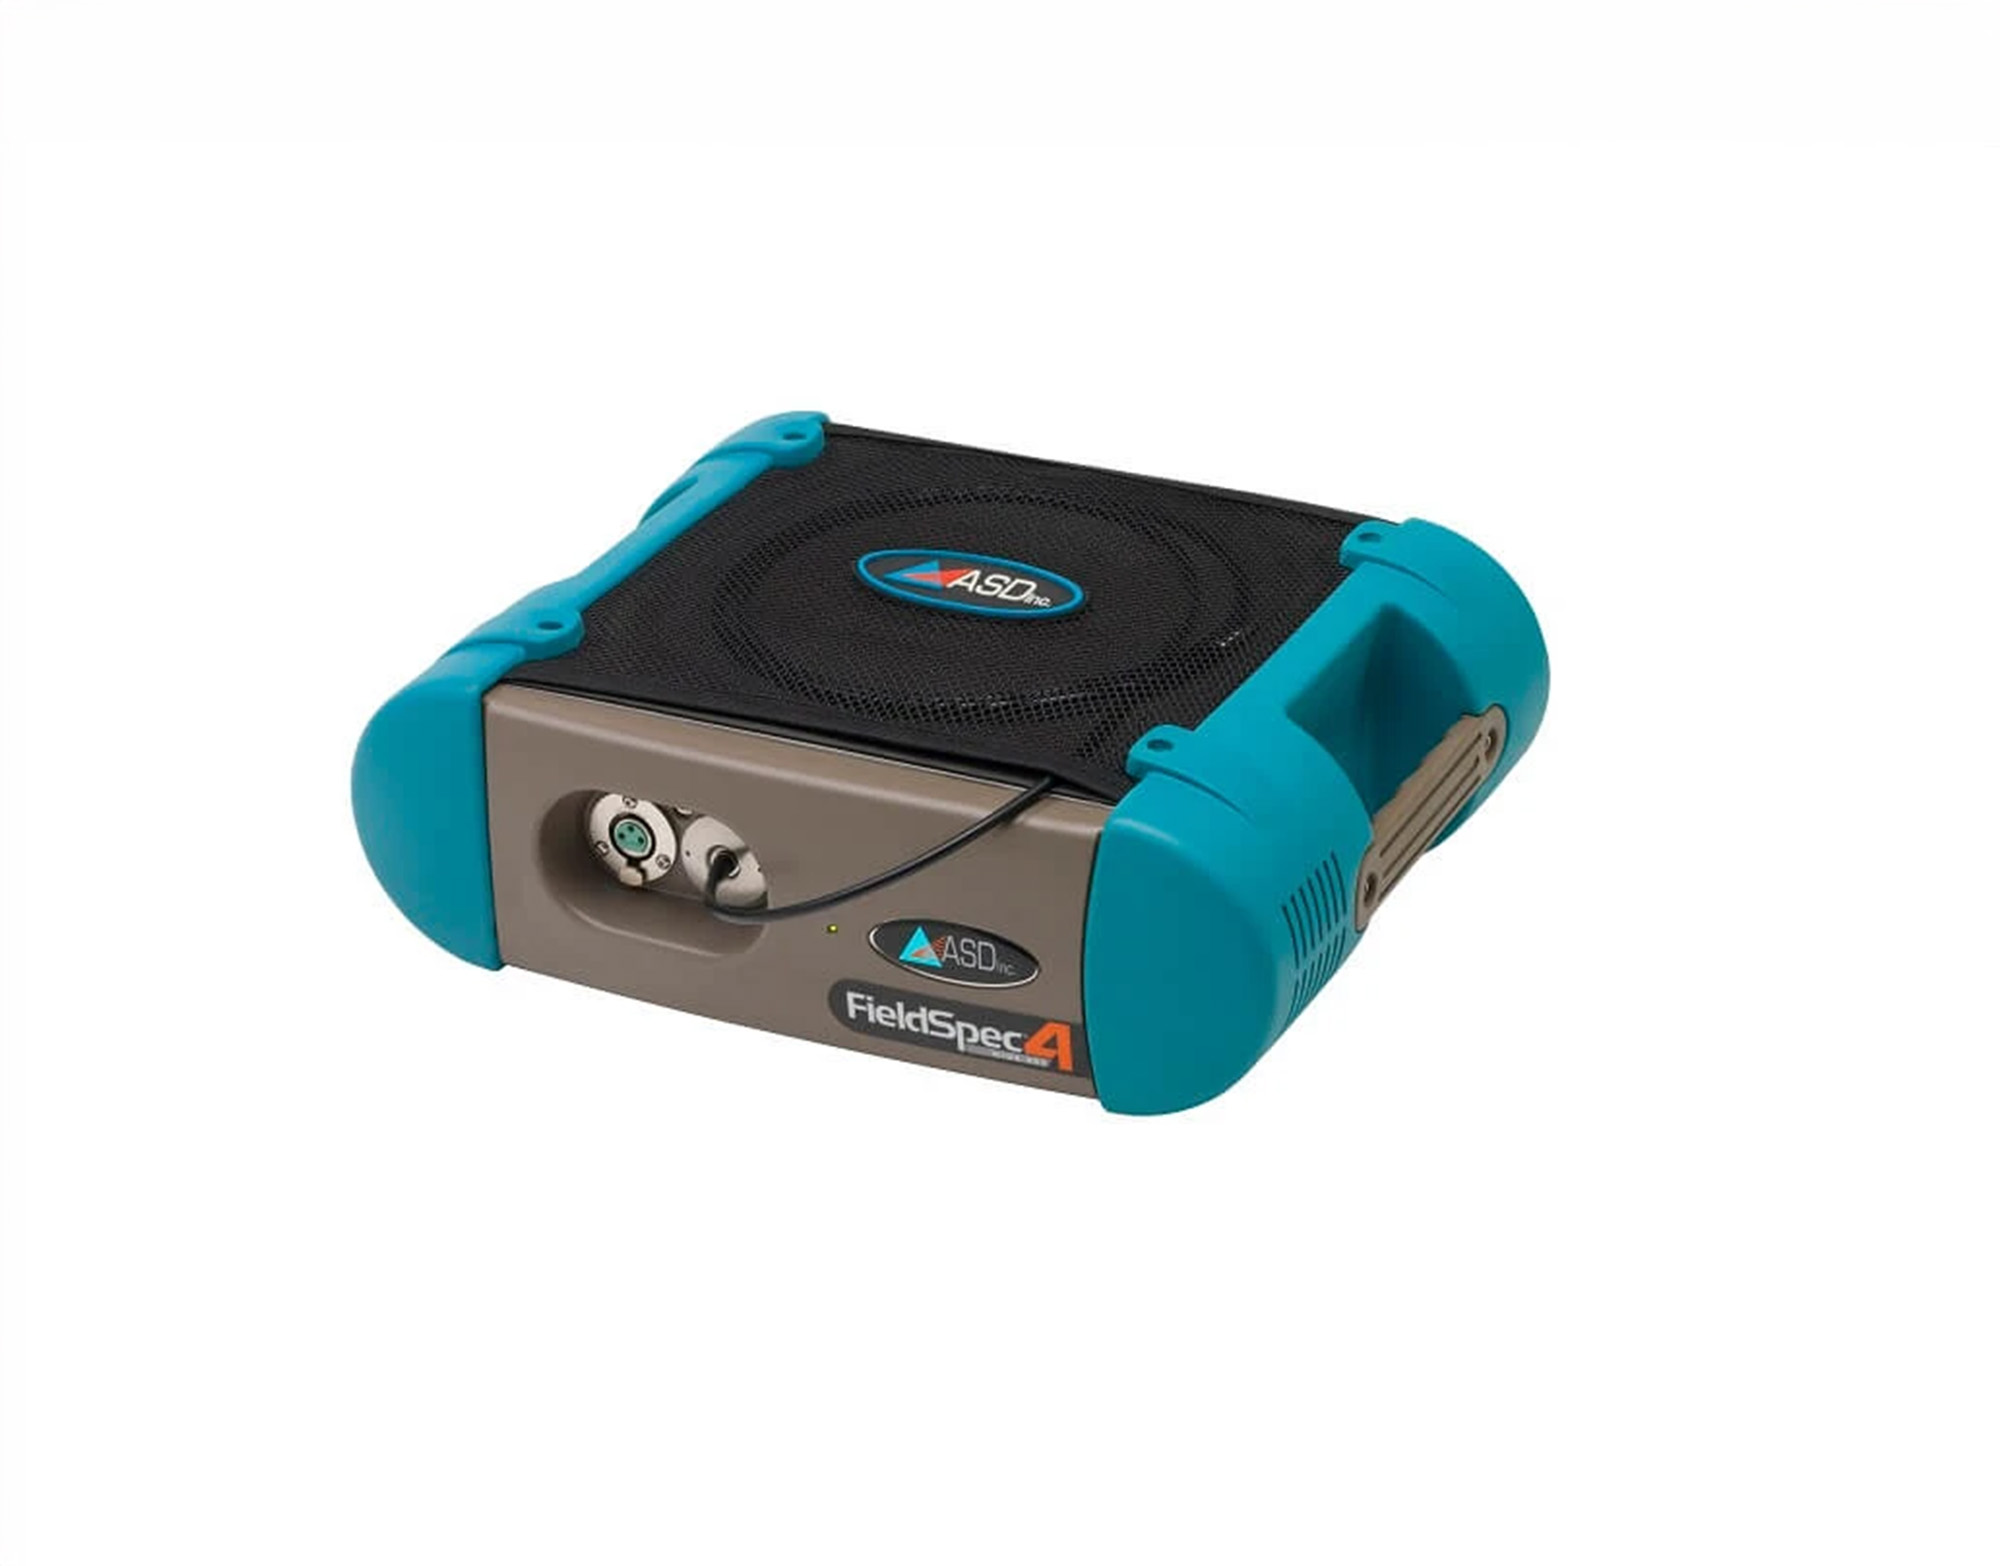
ieldSpec 4 High Resolution Spectroradiometer
Leaf level high-precision/high-resolution full spectrum (400 – 2500 nm) hyperspectral reflectance/transmittance measurements
HYSpex laboratory hyperspectral imaging system
Leaf and small plants full spectrum (400 – 2500 nm) hyperspectral imaging
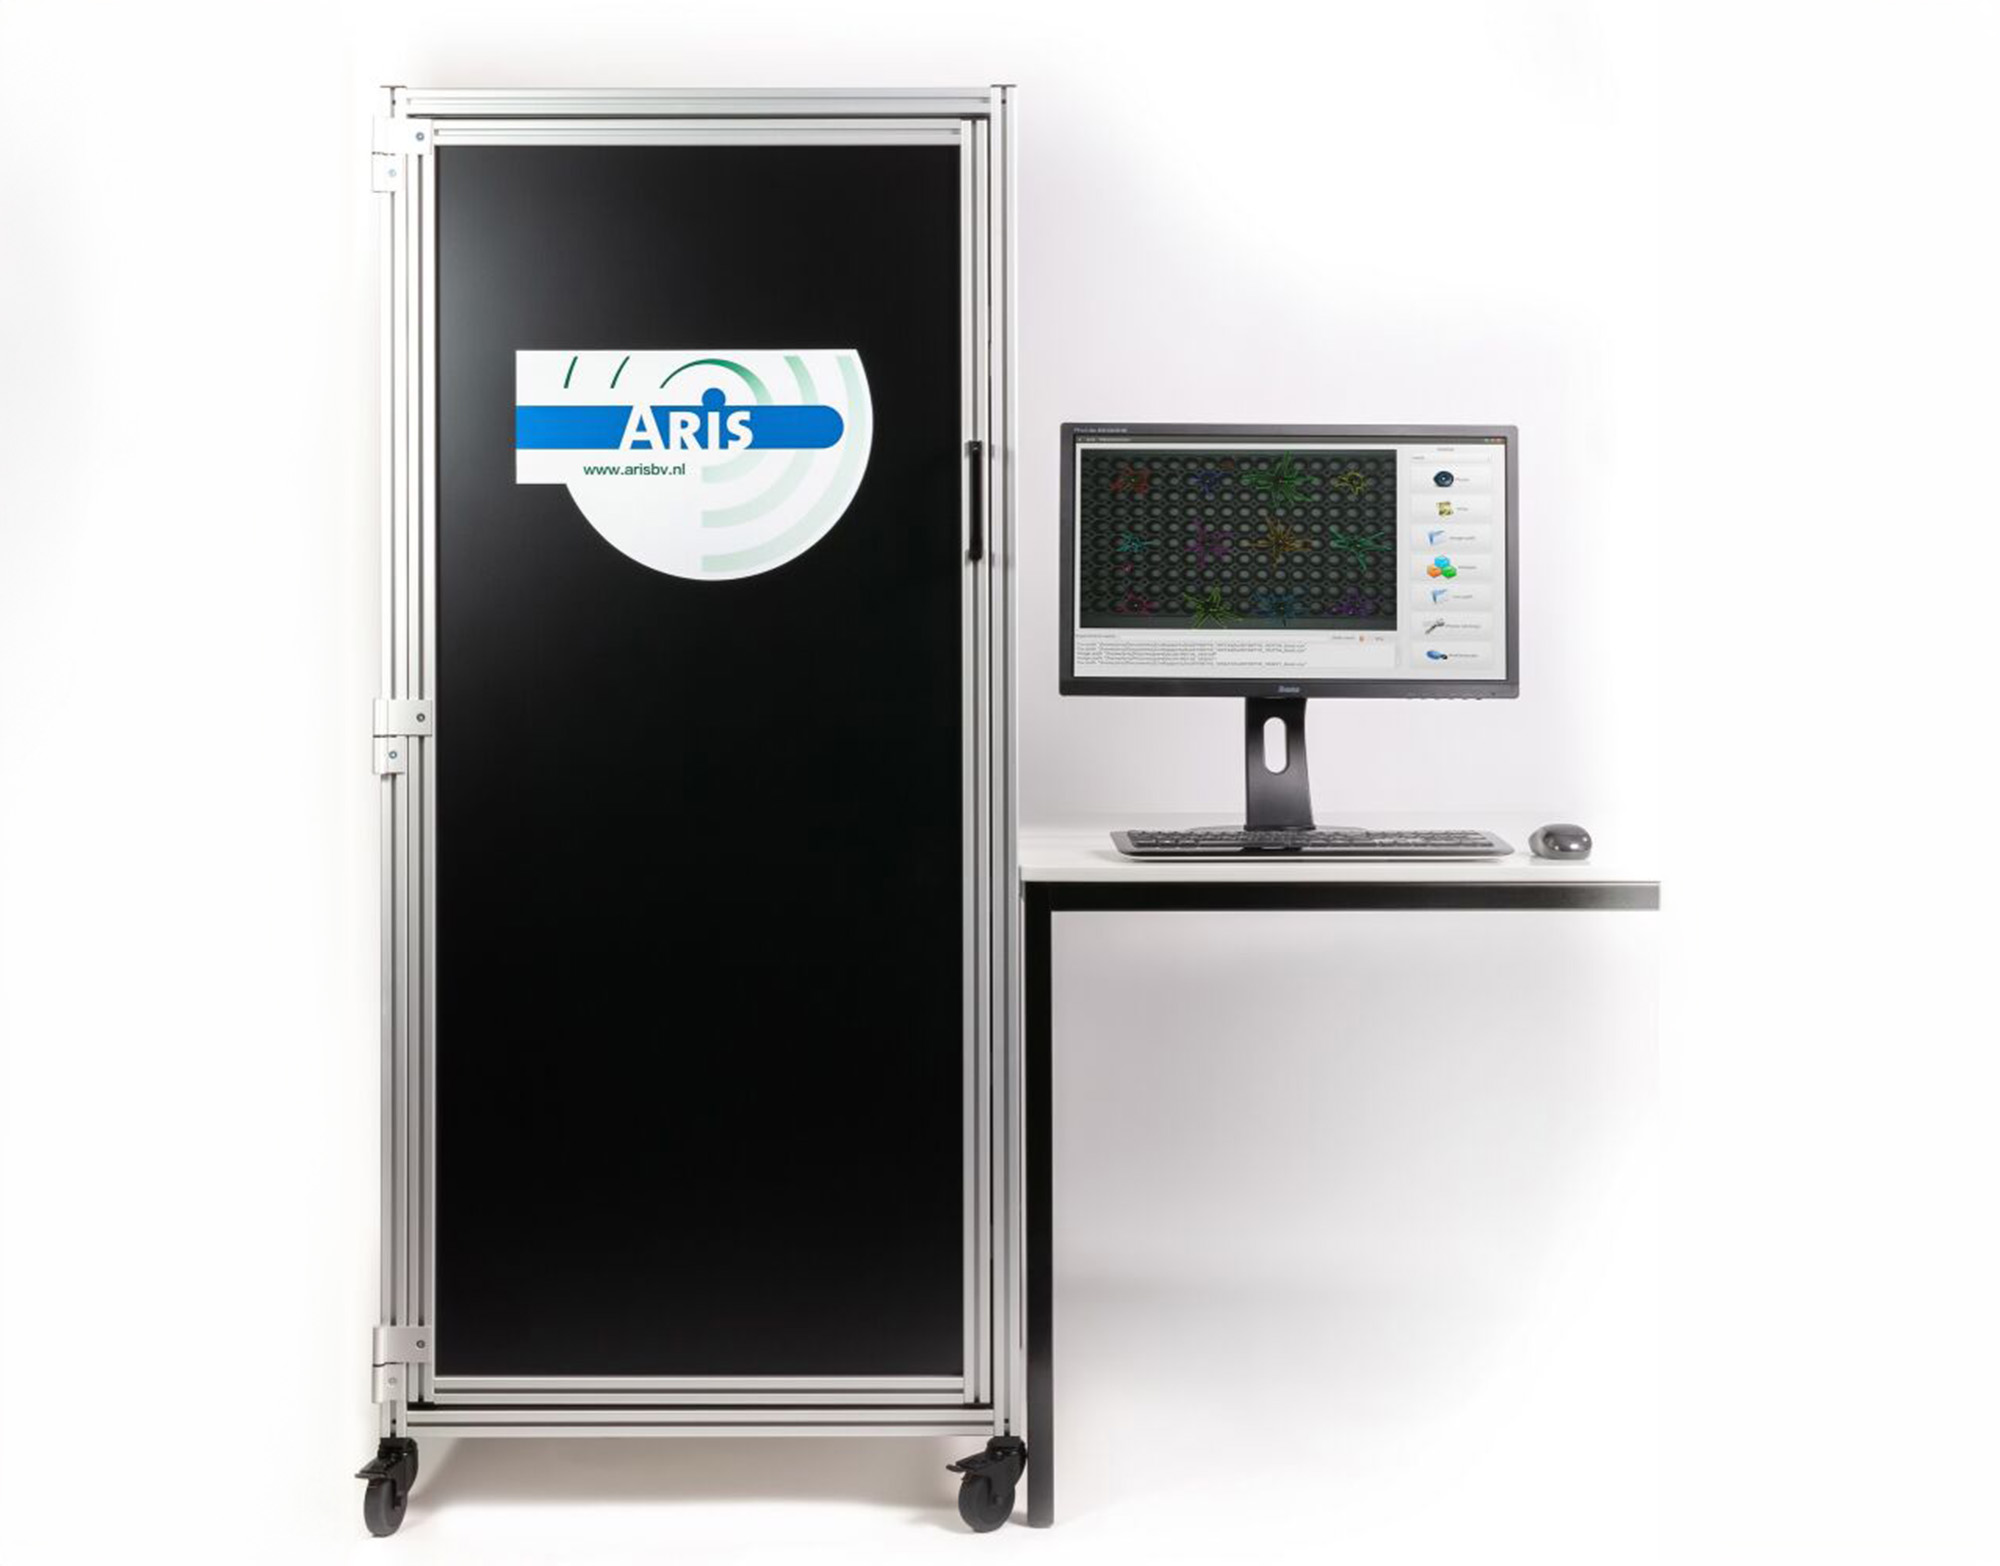
ARIS TOP-VIEW PHENOTYPING SYSTEM
This system enables one to make reproducible measurement of plant morphology, color and other traits of a varieties of targets, e.g., plants, vegetables, fruits, etc.
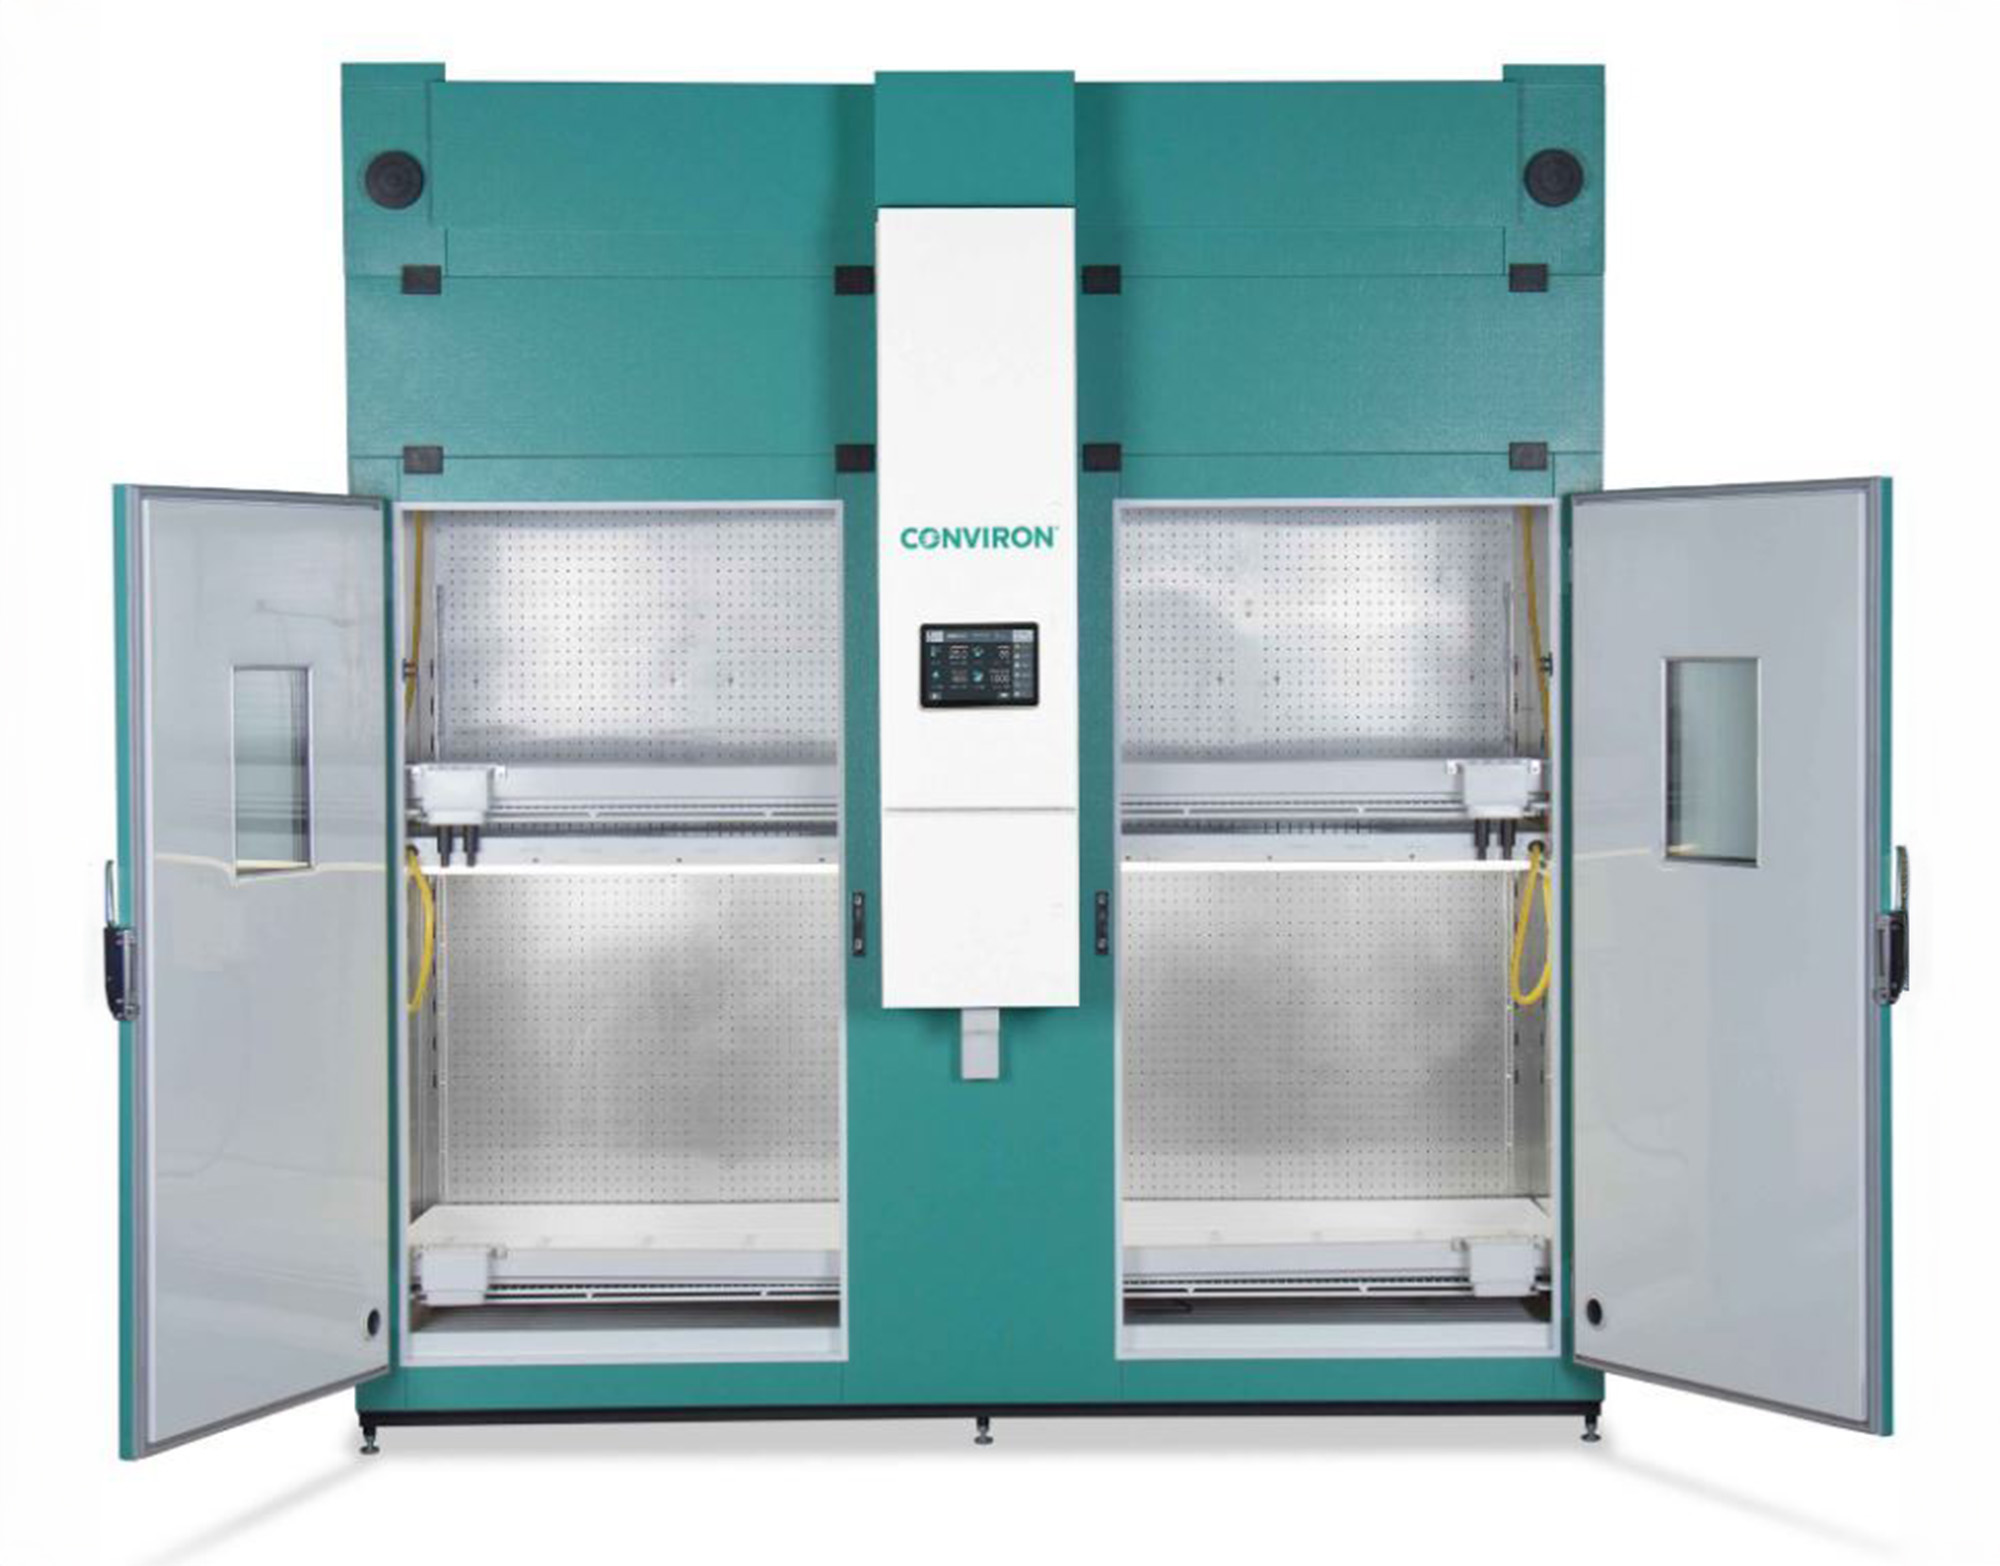
Conviron PGC-FLEX Plant Growth chambers (we have two in AAPF)
Can serve provide dedicated/isolated growth space for plant pathology-related samples if/when needed; also can serve the purpose of providing specific photoperiod, CO2 level etc. for research