How will the farm bill be shaped by the federal budget?
March 28, 2023
PAER-2023-15
Roman Keeney, Associate Professor of Agricultural Economics
![]()
![]()
![]()
![]()
![]()
On February 15 the Congressional Budget Office (CBO) released its annual Budget and Economic Outlook. This report presents a point in time snapshot of estimated federal spending and revenues for the coming ten years. As part of this process, updated estimates for farm bill programs were published. In this farm bill year, the February budget outlook gives us a preview of the eventual scoring baseline that will govern spending on that legislation. The ten-year cost arising from the February estimates was more than $1.4 trillion. This represents a historically large increase in the projected costs of a farm bill.
Farm Bill Spending Estimates
Farm policy reporting sources have noted the $1.4 trillion price-tag for a 2023 Farm Bill that with its projection of a nutrition program that is more than $1 trillion. When viewing these CBO budget numbers, it is important to remember that these estimates are published for ten-year spending windows even though an actual new farm bill would likely only have effect for five years. The five-year estimate on farm bill spending from the February budget outlook totals approximately $700 billion ($140 billion/year) for programs included in the legislation.
The massive increase in spending in the farm bill is primarily contained in the nutrition title. Programs like the Supplemental Nutrition Assistance Program (SNAP) are counter-cyclical to the economy, meaning that as economic conditions worsen the spending in these programs will increase. This increase results from both a rise in the number of households that are eligible and increased benefits to counter lowered incomes of those participating in assistance programs. Policy changes have also driven SNAP spending – particularly the expanded use of eligibility waivers and a reformulation of the Thrifty Food Plan (TFP) that sets the cost basis for benefits.
Rapid expansion in spending on SNAP and nutrition coupled with strong farm prices that limit commodity spending have combined to make SNAP an increasingly dominant spending component of the farm bill. In 2008, approximately two-thirds of farm bill spending was expected to come from the nutrition title. Following the great recession of 2009 and 2010 updated estimates had increased the spending claim from nutrition to three-quarters of farm bill spending. That number held through passage of the 2018 Farm Bill which had an estimated 76% of its spending contained in the nutrition title. The current situation mirrors that from 2009 and 2010 when economic conditions increased participation and recovery policies made use of nutrition programs to deliver economic relief, increasing the size of nutrition relative to total farm bill spending. In the February 2023 budget outlook, nearly 85% of farm bill spending is expected to be emanate from the various nutrition title programs.
Table 1. Spending estimates and shares for 2018 and 2023 Farm Bill programs
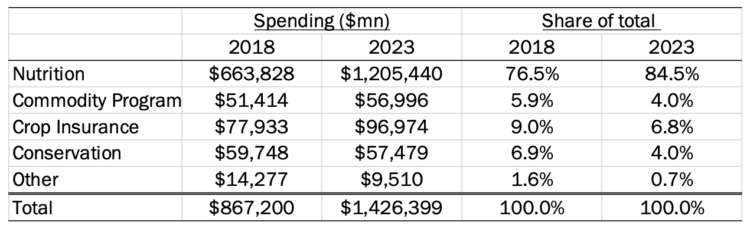
Source: Congressional Research Service
Table 1 compares projected farm bill spending in the four major titles (plus other collected items) and their share in total spending for 2018 and 2023. We see here that commodity program spending is projected lower than five years ago. This reduction is due to the current versions of shallow loss commodity support programs having relatively weak price support compared to expected prices going forward. Those higher future prices similarly increase the cost of crop insurance and expected spending on premium subsidies.
In the second set of columns comparing spending shares in 2018 and 2023, we see the dominant effect of increased nutrition spending. Forecast nutrition spending (+81.5% increase in 2023 over 2018) dwarfs the expanded crop insurance figure (+24.4% increase) causing the share of crop insurance in the farm bill total to drop by more than two percentage points to 6.8%. Just as the increased SNAP spending mirrors the lead-up to the 2012 farm bill process that took two years to complete with a 2014 farm bill, so too does the economic environment and deficit situation.
National Deficit Estimates for 2023
February’s budget outlook reported an estimated federal spending deficit of $1.4 trillion for fiscal year 2023. Deficits continue in the projection for the 2024 to 2033 years averaging about $2 trillion per year. Upward ratcheting of interest rates which increase the cost of holding debt and slow economic growth are the biggest cause of deficit increase in the near term. Even as projections return economic growth to more normal levels the cost of debt service plus the demographics of entitlement obligations present steady increases in deficits that outpace economic growth.
Historically, deficits are viewed relative to economic activity. Maintaining deficit levels that are between 3 to 4% of GDP has historically fostered normal levels of economic growth and provision of public services. Costs incurred in managing COVID and stimulus spending plus lagging growth in the economy have combined to generate deficit levels relative to GDP that are well above the historical range. For fiscal 2023, the deficit is expected to be 5.3% of GDP. Moving forward deficits are nearly 6% of GDP from 2024 to 2028 and steadily rise to nearly 7% at the end of the forecast period (2033).
The ten-year CBO deficit projection published in 2023 is more than $3 trillion higher than what was published last year. The combination of economic and policy changes in the interim have added an average $300 billion per year to spending above revenues. The CBO projections embody a number of assumptions about the economy going forward including a measure for economic growth indicated by the percentage change in GDP. The CBO estimates project growth of 2.4% annually for the 2024 to 2027 period that subsequently falls to 1.8% for the remainder of the ten-year period. Increments in growth that better those projections will change estimates of deficits in terms of increased revenue collections and reduced spending on assistance programs like nutrition, Medicaid or unemployment insurance.
The Politics of Farm Bill 2023 Spending
The size of the farm bill and the cost of the nutrition title have already drawn critical notice from political leadership on the farm bill. The 2018 Farm Bill was written to be budget neutral allowing the entire baseline to be spent. Prior to that, the protracted, two-year 2014 Farm Bill required reductions relative to the legislation’s spending baseline[1].
The 2012 legislative environment was quite like what we see today. Republicans were newly in control of the House while Democrats ran the Senate and White House. Deficits were ascending following economic shocks of the financial crisis and subsequent recession. The federal government was approaching the debt ceiling and votes to increase that were leveraged against spending reductions to try and rein in deficits.
The alignment of the economy, the federal budget, and politics all point to a difficult environment for farm bill passage in 2023. The baseline for the farm bill is historically large and will likely be required to set aside some of that baseline for deficit reduction. This adds a confounding layer to the political calculus of the farm bill process. Normally, we expect agricultural committee legislators to negotiate over the mechanics of moving money across farm bill programs to address priority reforms to programs. In 2023, the primary sticking point may be on what percentage of the estimated $140 bn/year they are allowed to use in constructing a replacement for the 2018 Farm Bill.
For more reading:
Coppess, J. “A View of the 2023 Farm Bill from the CBO Baseline.” farmdoc daily (13):33, Department of Agricultural and Consumer Economics, University of Illinois at Urbana-Champaign, February 23, 2023.
[1] The 2014 farm bill was written with a score that was $16 bn less than the baseline. This followed two years of difficult budget negotiations that imposed some mandatory sequestration cuts on federal agencies.
![]()
![]()
![]()
![]()
![]()
