Understanding the Downward Bias in USDA’s Farm Income Forecasts
October 7, 2020
PAER-2020-13
Author: Todd H. Kuethe, Associate Professor, Schrader Endowed Chair in Farmland Economics
![]()
![]()
![]()
![]()
![]()
The United States Department of Agriculture’s (USDA) farm income estimates are among the department’s most cited statistics. Farm income is the Federal government’s official measure of the farm sector’s contribution to the national economy. Estimating sector-wide farm income is a significant undertaking, and as a result, official estimates of farm income are released with a significant time lag, in August following the reference year. For example, the USDA’s Economic Research Service (ERS) released the official estimates of 2019 net cash income of $110.3 billion on September 2, 2020.
USDA’s farm income measures are widely used by decision-makers across the agricultural sector and play an important role in the development of farm policy. In order to provide more timely information, USDA-ERS releases four periodic forecasts of farm income. USDA’s initial farm income forecast is typically released in February to coincide with the USDA’s Outlook Forum. The forecasts are revised in August, to reflect updated information on planting and crop progress, and in November, to reflect updated information on crop harvest. The forecasts are revised a third time the following February, when the initial forecast of the new year are released.
Figure 1 plots USDA’s official estimate of net cash income, as well as the four forecasts in February, August, November, and February, between 1980 and 2020. On September 2, 2020, ERS forecast 2020 net cash income of $115.2 billion. The forecast represents a 4.4% increase from the 2019 official estimate of $110.3 billion. In addition, the September 2 forecast was 5.1% higher than the initial forecast released February 5, 2020. Figure 1 suggests that the improvement between the initial forecast and the first revision is not unique to 2020 as it is common in the forecast history.
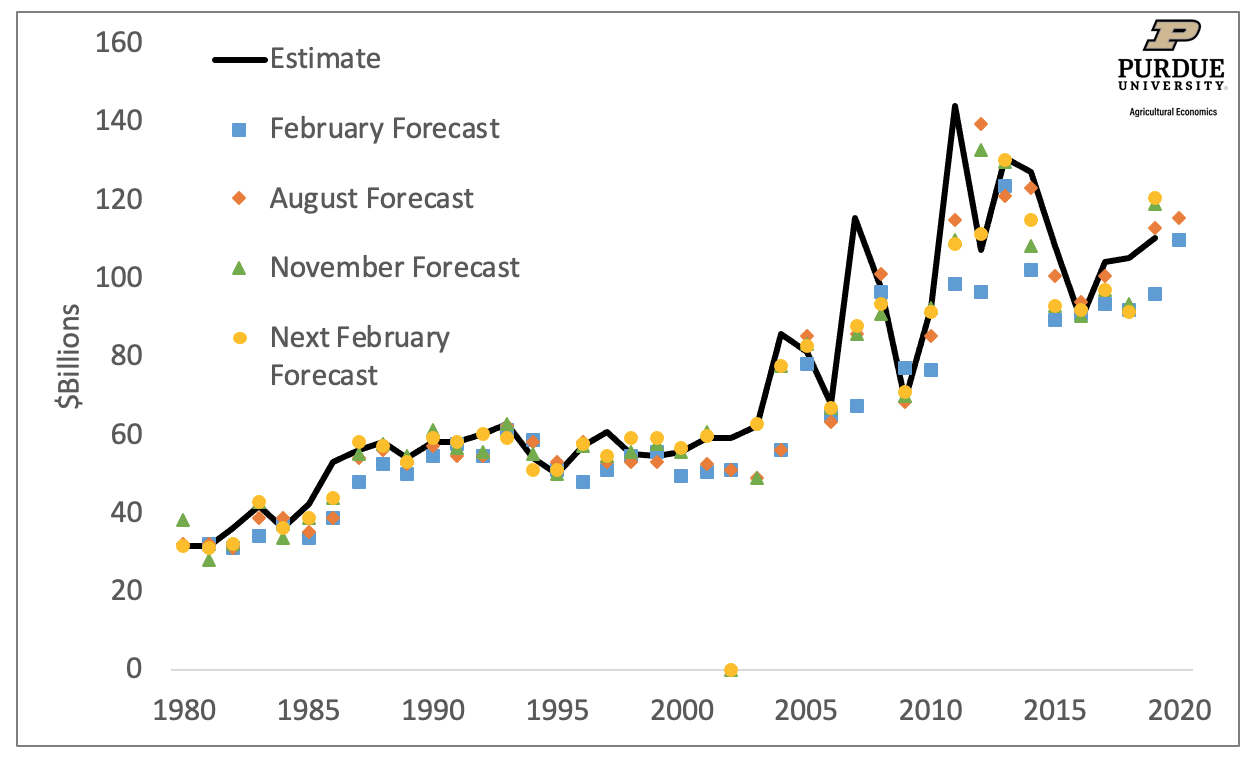
Figure 1: USDA Net Cash Income Forecast, 1980-2020
Figure 1 also shows that early forecast tend to under-predict realized net cash income. This pattern can be observed directly in Figure 2. The vertical gray bars represent the percentage difference between the initial net cash farm income forecast and the realized value. Negative values represent under-predictions. The dashed line represents the average forecast error between 1981 and 2019. Thus, on average, initial forecasts of net cash income are 10.4% below realized values. Between 1981 and 2019, ERS’ initial net income forecast under-predicted realized values 79.5% of the time.
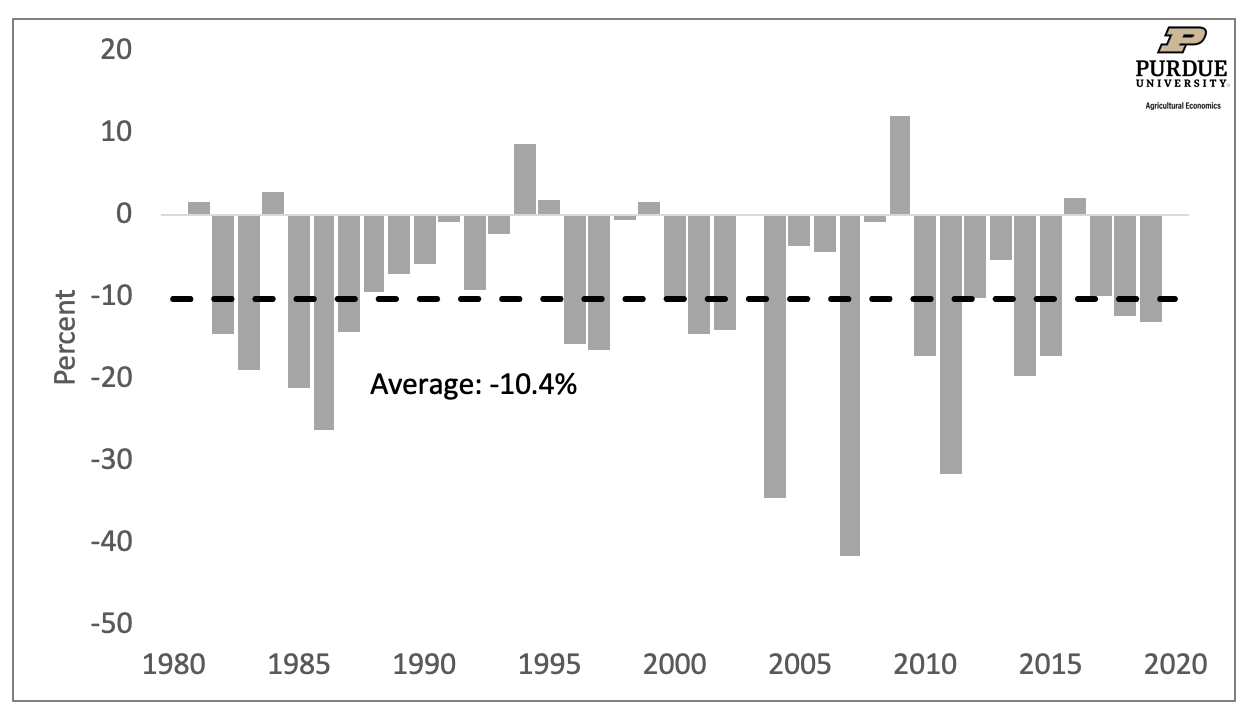
Figure 2: Initial Forecast Error, 1981-2019
Kuethe, Hubbs, and Sanders (2018) documented a similar pattern for ERS’ net farm income forecast between 1975 and 2016. Net cash income, shown in Figures 1 and 2, is limited to cash related income and expenses and does not reflect changes in the value of noncash sources, such as the value of inventory adjustment. Formally, net cash income is defined:
Net cash income = (Crop Receipts + Livestock receipts + Cash farm-related income + Total direct government payments) – Cash expenses = Gross cash income – Cash expenses
ERS uses a bottom-up forecasting approach in which the elements of net cash income are forecast individually and combined into a forecast of the net cash income state according the accounting equation above. Isengildina-Massa, et al. (2020) examined the various components of net cash income between 1986 and 2017. The authors confirmed the previous findings of Kuethe, Hubbs, and Sanders (2018) and found that under-prediction in early net cash incomoe forecasts stems from under-prediction of crop and livestock receipts and cash expenses.
All predictions of future economic conditions are subject to mistakes due to changes in the economy between the forecast release and the end of the period, problems with forecasters’ information set, or defincies in the forecasters’ skill set. Forecasters develop their best guess of future economic conditions in order to avoid the costs associated with forecast mistakes or forecast errors. Economists call this the forecaster’s “loss function.” And the forecaster is assumed to minimize a particular loss function. Recently, Bora, Katchova, and Kuethe (2020) estimated ERS’ loss function for net cash income and its components. The study found that the under-prediction identified by Kuethe, Hubbs, and Sanders (2018) and Isengildina-Mass, et al. (2020) was attributable to the high cost of over-prediction relative to under-prediction. In other words, ERS prefers to “aim low” as predicting higher cash income than realized is costly to the USDA. Thus, while early ERS forecasts tend to under-predict net cash income, they are rational cost minimizers.
ERS is scheduled to revise their 2020 farm income forecasts again on December 2. The studies cited previously suggest that the December 2nd revision is an unbiased predictor of realized net cash income. It will be interesting to see if ERS’ outlook for 2020 farm income continues to grow more optimistic.
Related Podcast: Understanding USDA Farm Income Forecast, Purdue Commercial AgCast
https://ag.purdue.edu/commercialag/home/resource/2020/09/understanding-usda-farm-income-forecasts/
References
Bora, Siddhartha S., Ani L. Katchova, and Todd H. Kuethe (2020) “The Rationality of USDA Forecasts under Multivariate Asymmetric Loss” American Journal of Agricultural Economics, forthcoming.
Isengildina-Massa, Olga, Berna Karali, Todd H. Kuethe, and Ani L. Katchova (2020) “Joint Evaluation of the System of USDA’s Farm Income Forecasts” Applied Economic Perspectives and Policy, forthcoming.
Kuethe, Todd H., Todd Hubbs, and Dwight Sanders (2018) “Evaluating the USDA’s Net Farm Income Forecast” Journal of Agricultural and Resource Economics 43: 457-468.
![]()
![]()
![]()
![]()
![]()
