The Big Data Harvest
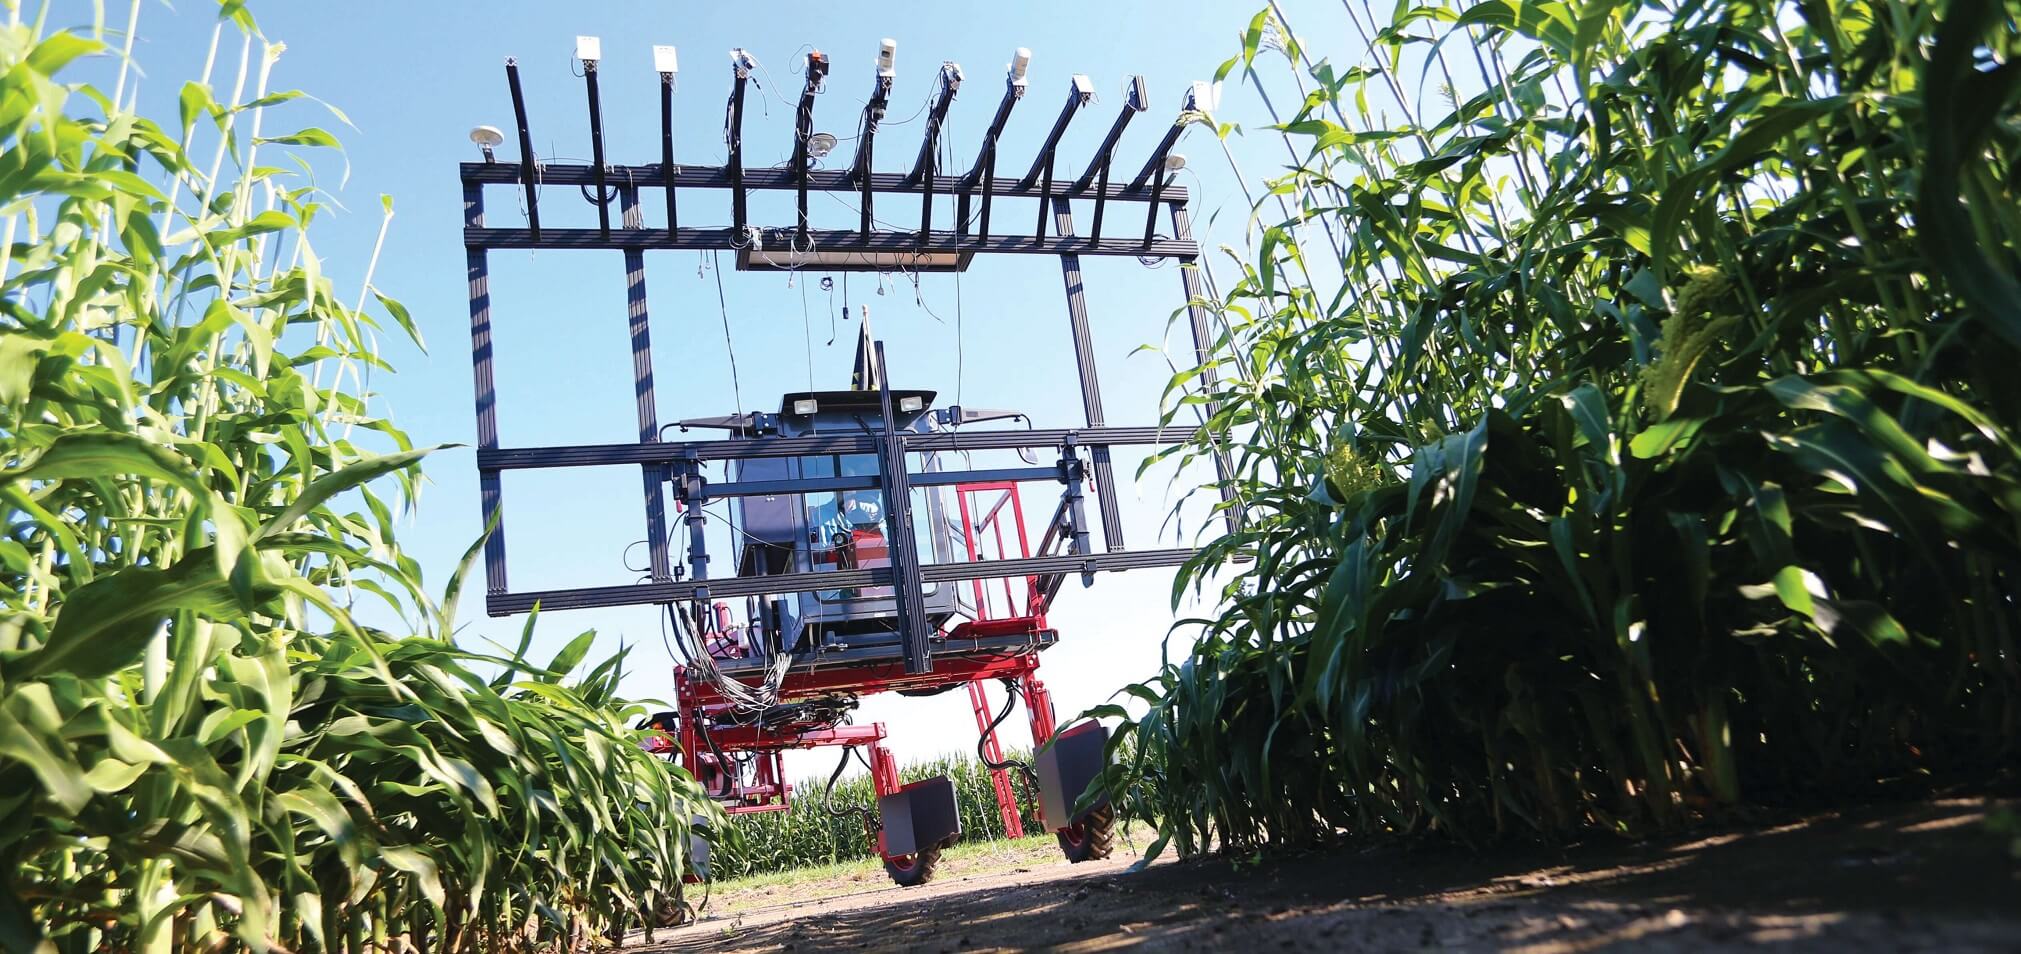
In a new building near the Agronomy Center for Research and Education, seven miles northwest of campus, sits a strange menagerie of machines. One resembles an octopus imitating a closed umbrella; at full extension, it looks like a small spaceship bristling with propellers and downwardfacing cameras. Nearby, a fire-engine red crop sprayer carries a custom boom, its nozzles replaced with assorted sensors connected by thick bundles of wires. Along one wall of the hangar-like structure hangs a collection of small unmanned aerial vehicles, each capable of carrying sophisticated instruments on flights over the 1,408-acre farm.
Today, scientists in the College of Agriculture are using tools such as drones, rovers, and other innovative technologies to reap a new kind of harvest—the rich, massive data that will help farmers make better decisions in the future. The field is called digital agriculture, and these tools unlock a new era of plant sciences and data-driven farming that will transform both research and industry. With unparalleled facilities, strong interdisciplinary collaborations, corporate partnerships, and a core of experienced faculty, Purdue stands poised as a leader of this new frontier.
“It really comes down to using data more effectively, making more quantitative and informed and better decisions using data,” says Mitch Tuinstra, professor of plant breeding and genetics; Wickersham Chair of Excellence in Agricultural Research; and scientific director of the Institute for Plant Sciences. “This represents the intersection of many disciplines: plant science, engineering, computer science, data analytics, statistics, even aviation technology. We’re working together to create or develop new platforms to collect more data and take advantage of big data in agriculture.”
Within projects studying plant breeding, climate resilience, crop genomics, the environmental impact of agriculture, global food security, and more, Purdue researchers are adapting the cutting-edge technologies used by social media networks, search engines, and self-driving vehicles to agricultural use. From the Internet of Things (IoT)—a catchall term for web-connected devices that collect real-time data—to machine learning and computer vision approaches (which enable Facebook to identify faces in photos), these data collection and analysis methods will change the way food is studied, grown, and consumed.
the takeaway
- At the new Indiana Corn and Soybean Innovation Center, scientists in multiple disciplines are using tools such as automated field sensors, drones, and the PhenoRover—a special high-clearance sprayer with customized sensors—to collect phenotype data previously gathered by walking through a field.
- The amount of data collected is unprecedented. Its transmission on site is wireless and automated, and can occur from any point across the farm, while data is transmitted to campus by fiber optic cable. Much of this technology is thanks to a partnership with Hewlett Packard Enterprise.
- In early 2018, the College of Agriculture will launch a Controlled Environment Phenotyping Facility that simulates different growing conditions and weather types and uses a conveyor belt to automate plant measurements.
- Analyzing the data provides new challenges, such as eliminating faulty images or bad measurements, digitally stitching images together, and matching data to the correct location in a plot.
- Interpreting the data can allow scientists to determine how well plants are growing and translate that to timely field recommendations for farmers, as well as identify the genes important to plant health.
- These advances in plant science will help us feed the estimated global population of 9 billion people in 2050.
- See how the Internet of Things works.
“What we’re really developing is an IoT testbed for agriculture,” says Karen Plaut, interim dean of the College of Agriculture. “We want to bring advanced sensors together with weather data, drone data, and data collected by any other type of equipment farmers use in the field, so that they can make smart decisions in real time. The purpose behind digital agriculture is that, using data, you can make decisions that go well beyond what we do today.”
To help lead this effort, Dennis Buckmaster, professor of agricultural and biological engineering and assistant dean of academic programs, has been appointed a dean’s fellow for digital agriculture. He’ll work to catalog research in the area and consult faculty across the university to develop a vision and strategy that encompasses Purdue Agriculture’s research, teaching, and engagement missions.
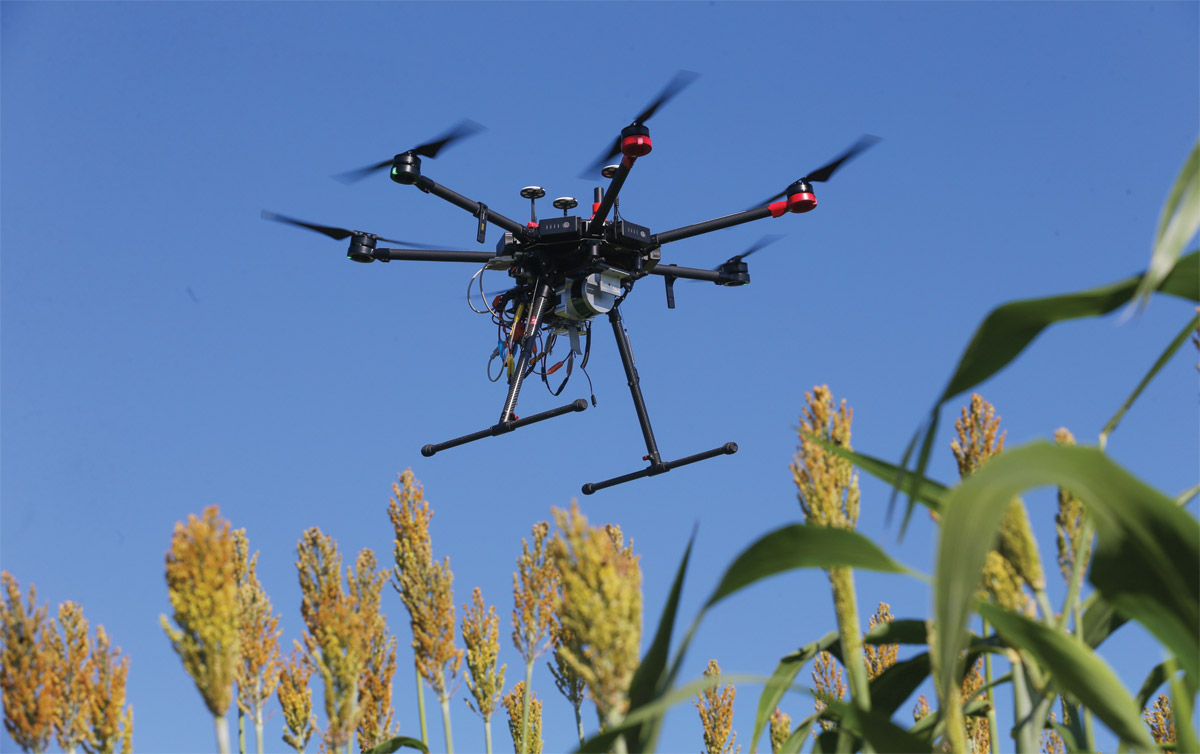
A drone captures images of a sorghum field at the Agronomy Center for Research and Education.
From walking a field to flying a drone
Farmers are not new to collecting data. From the dawn of agriculture, they have closely examined their crops for signs of sickness or infestation, selected the best performing plants for breeding, and tested how different species performed in various seasons and weather conditions. Even today, however, much of this data gathering is done manually—by walking through the field and directly observing plants—and is qualitative, driven by experience and intuition.
But like many biological fields, new methods for collecting massive amounts of data have accelerated the quantitative revolution in agriculture. After the initial push from genetics and its statistical methods of analysis, phenotyping—the measurement of a plant’s physical features—has also turned increasingly from words to numbers as researchers found more numeric approaches to describe the characteristics of a plant’s growth, health, and yield.
“When I think of digital agriculture, I really think of it as using quantitative skills to understand how a plant is growing, and then taking that one step further and identifying the genes that are important based on quantitative phenotyping,” says Anjali Iyer-Pascuzzi, assistant professor of botany and plant pathology. “Quantitative skills are becoming increasingly important for addressing questions in basic biology.”
Technology also opens up grand new possibilities of scale for plant science, transferring what once was slow, inefficient research by humans into rapid collection of vast quantities of data by unmanned vehicles, robotic systems, and sensors embedded in the field.
“In the past, we were largely constrained by how many minutes we had to spend in the field, how much time it took to evaluate every individual plant or research plot,” Tuinstra says. “The challenge in a modern agriculture research context is that we really need to look at a lot more plants than I can be personally responsible for.”
To do so, aerial drones and a variety of sensors create new streams of information from monitoring crops. Advanced statistical methods then automatically sift through raw data for meaningful insights that can drive real-time decision-making. And predictive models use that data to run simulations of crop behavior under different conditions, providing hypotheses that can be tested in the field or recommendations to influence farm management.
It takes a team to cultivate the data
Many of these approaches underlie the ambitious research taking place at the Indiana Corn and Soybean Innovation Center, the new building on the border of the Agronomy Center for Research and Education (ACRE). There, scientists in the TERRA project, funded by the Department of Energy’s Advanced Research Projects Agency, study how different genetic variants of the sorghum plant could be used to produce biofuels. Their team uses the $15 million high-tech facility as a staging ground for drones and the modified sprayer, known as a PhenoRover, for high-throughput data collection on their fields.
The building and the work it supports showcase how cutting-edge agricultural research spills out beyond traditional disciplinary boundaries. Faculty and students from the School of Aviation and Transportation Technology in the Purdue Polytechnic Institute design and fly the unmanned aerial vehicles (UAVs) that scan the fields with cameras. (These record both visible and invisible wavelengths that identify plant features and health, such as leaf shape and infrared color.) Faculty in geomatics engineering in the Lyles School of Civil Engineering help determine precisely where each individual plant lies in the field, to enable consistent, repeated study. A high-speed internet connection beams data at speeds as high as 20 gigabytes per second—the equivalent of four HD movies every tick of the clock—back to Purdue’s main campus, where computer scientists store and analyze the information.
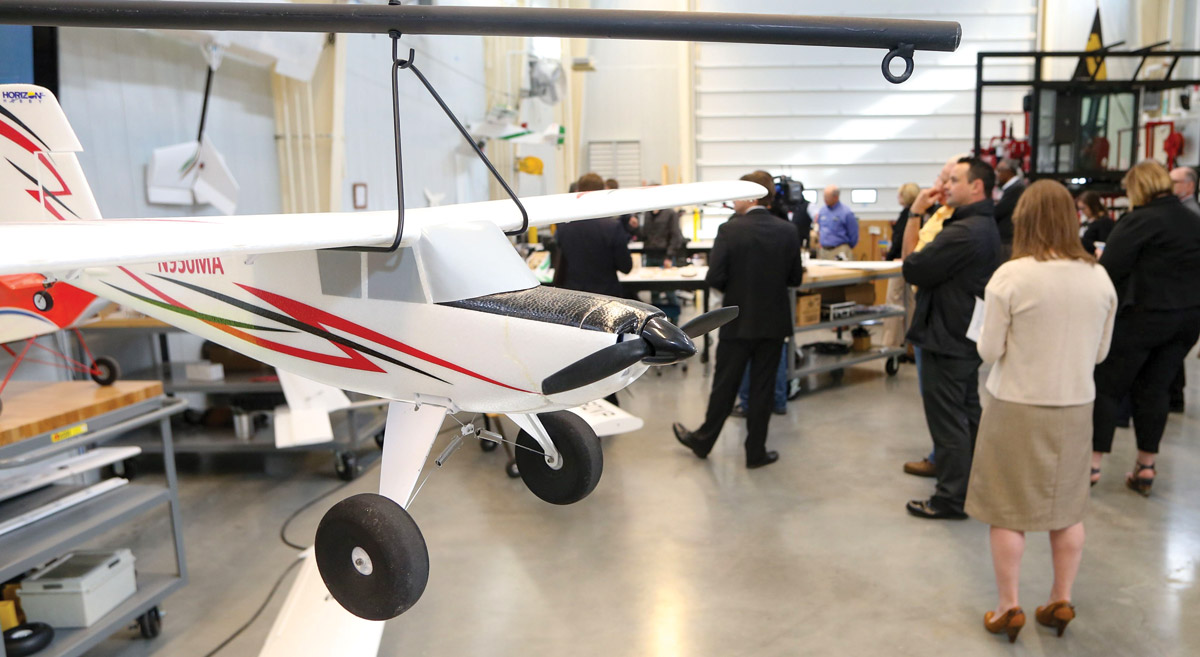
Unmanned aerial vehicles in the foreground of the storage bay are used, along with drones, to fly sensors over fields.
Even unassuming features of the building provide surprising value. A 200-foot hallway, running the length of the structure, turned out to be the perfect space for Rich Grant, professor of agronomy, to calibrate his laser-based sensors, which measure gases such as ammonia, carbon dioxide, and water vapor in the field.
Grant’s research on the nitrogen emissions from fertilizer treatment offers a vivid example of how data- driven agricultural research is rapidly advancing. An applied meteorologist, Grant has worked with sensors and large data sets for most of his career. But there have been many technical hurdles. Each day, Grant would visit his site to download half a gigabyte of data onto a thumb drive, and students were posted at the field for long shifts simply to monitor the sensors.
“When the Internet of Things came along, I always had the 'things,'” Grant says. “But connecting them was not always easy to do. That’s really the challenge that I have right now, working to put these pieces together, so that it [creates] a whole.” Purdue’s partnership with Hewlett Packard Enterprise (HPE) helped Grant add fast data transfer over a wireless network—an important upgrade, given the tendency of rodents to chew through wires at the field site—and edge computing that conducts real-time data processing before transmission to computing resources. His data is now consolidated into a dashboard that allows him or his students to monitor the fields from anywhere, providing alerts when things aren’t working right and delivering the most important data for remote analysis.
Katy Martin Rainey, assistant professor of agronomy, also utilizes data collected by drones in her research on soybean breeding. With different types of cameras, her drones collect canopy-level phenotype information about crop color, size, and shape that can be combined with ground-level measurements of temperature, soil moisture, and other conditions to make faster observations and predict yield and other valuable traits.
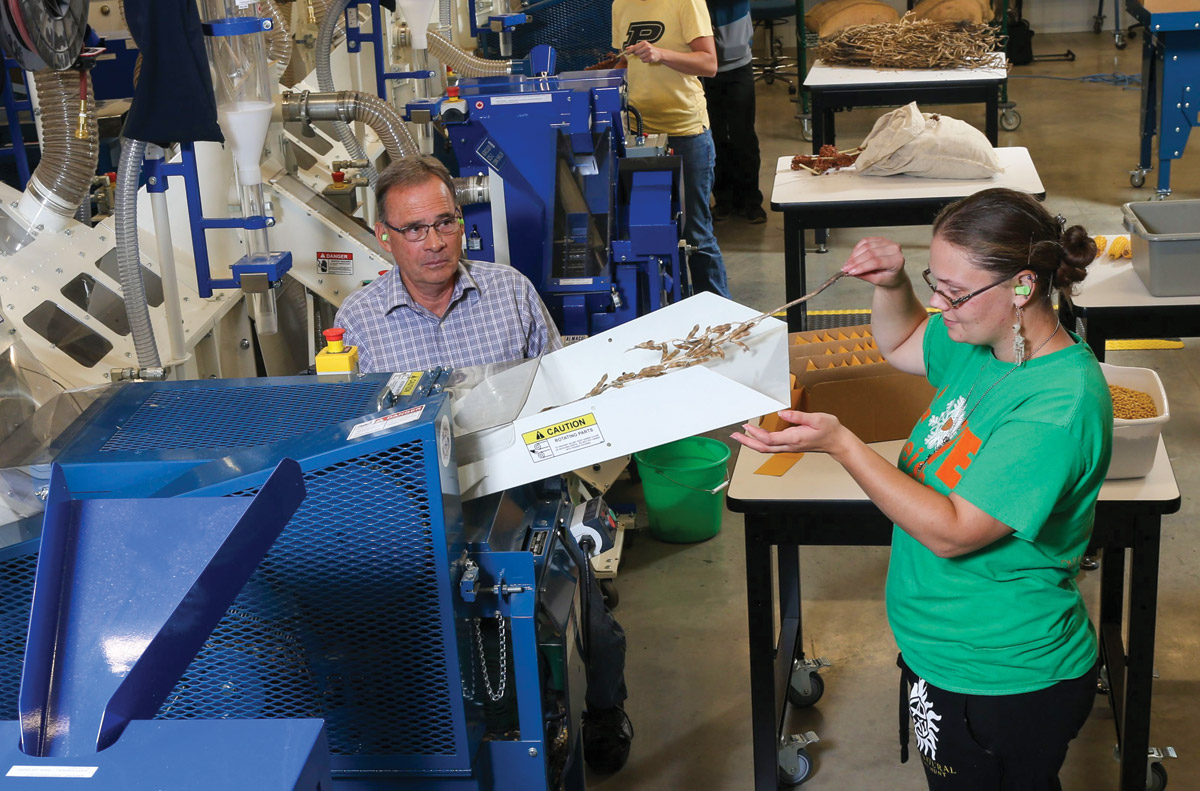
Different varieties of soybean are threshed to determine which were most productive in the field.
“What we do with that data is build models to characterize the growth and development of the crops,” Rainey says. “Usually what plant breeders do is put out plots and maintain them; they might take some notes, but they’re really just waiting until they harvest them for yield at the end of the season. I’m trying to transition toward more data-driven selection: let’s collect data and use it quickly to start making decisions months before harvesting.”
Experimenting with the environment
In the maze of greenhouses behind the Lilly Hall of Life Sciences, one compartment stands out as a little different. A zigzag track of conveyer belts, resembling an airport baggage claim or a sushi counter, hums quietly, carrying over 100 potted corn plants in a constant circuit around the room. One by one, the stalks enter a floor-to-ceiling black box, where bright halogen lamps blink to life and illuminate the plant for images taken by two hyperspectral cameras. Each hour, throughout the day and night, each plant gets a turn in this sophisticated photo booth, automatically charting its growth and physiology in high definition.
Over the hiss of machinery, Jian Jin, assistant professor of agricultural and biological engineering, explains how his unusual setup helped solve the problem of greenhouse microclimates, where plants in different parts of the structure encounter different temperatures, light, and other conditions.
“We had a crazy idea: why don’t we shuffle all the plants 24/7? Can we remove that microclimate issue and collect continuous phenotyping data as well?” Jin says. “We’re exploring the new modes of what a phenotyping facility should be in the future.”
In early 2018, a larger version of this concept will open on campus in the new Controlled Environment Phenotyping Facility, a 7,000-square-foot enclosed structure where plants can be autonomously grown and analyzed. Where the field facility allows researchers to study plants in their native environment, its indoor sister facility will grant them the power to precisely control growing conditions and mimic weather of all types around the world.
Inside a special growth chamber, 250 plants can be grown under precise conditions of light, water, and fertilizer. Each plant will live its life in a pot attached to a conveyer belt, so that it can be regularly sent on a car wash-like automated circuit of the facility, scanned with a standard red-green-blue camera, a hyperspectral camera that records invisible and more detailed information, and fluorescence imaging that can precisely measure chlorophyll activity. In all, hundreds of different measurements can be taken around the clock for each plant with little to no human intervention.
“You can create drought, adjust moisture, lower the humidity in the room, or increase the humidity—go tropical,” says Julie Hickman, senior facilities project manager. “We’re trying to feed the world, not just Indiana, and we need to figure out how we can help these plants survive wherever people happen to live, in the United States and abroad.”
Already, Purdue scientists are eager to use that potential in their research. The controlled environment phenotyping facility can grow full-size corn, which will enable Tuinstra to test how drought and monsoon conditions found in Africa and India affect several different characteristics of the crop. Iyer-Pascuzzi, who studies the effects of bacterial infection on tomato plants, will use a machine similar to a medical CT scanner to noninvasively study root structure and function.
Making the yield useful
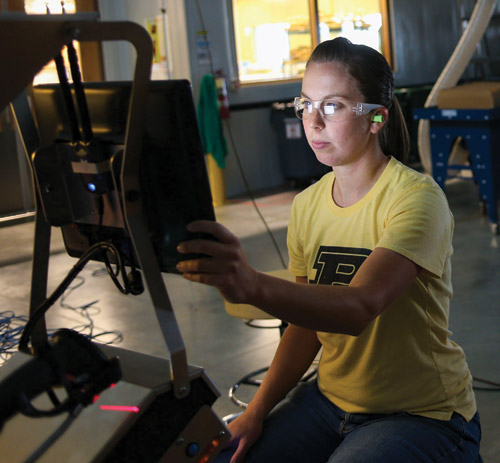
Field researcher and lab administrator Alicia West views and sorts seed data on site before transmission to campus.
But while these facilities and technologies have made data collection easier, they have also created a new challenge for agriculture: Once you have the data, what can you actually do with it?
One pass of the PhenoRover over 20 acres of farmland generates three terabytes of data—thousands of images and hundreds of thousands of measurements. That data is rich with useful information for research and industry, but extracting the value still requires tedious human labor. Researchers must weed out faulty images or bad measurements and digitally stitch multiple images together to reconstruct the field. Data must also be validated by checking thousands of manual measurements against those collected using newer automated methods. Even a seemingly simple task, such as counting the number of plants in a single row, can take hours as high-resolution photos meet low-throughput methods. As such, the next frontier for smarter agriculture is developing algorithms that automate these processes, automatically analyzing images and aggregating measurements to produce useful output. The TERRA project has made promising early steps in this area, writing software that can automatically stitch images, identify rows of plants, categorize them by plot, and visualize comparisons within and between plant types.
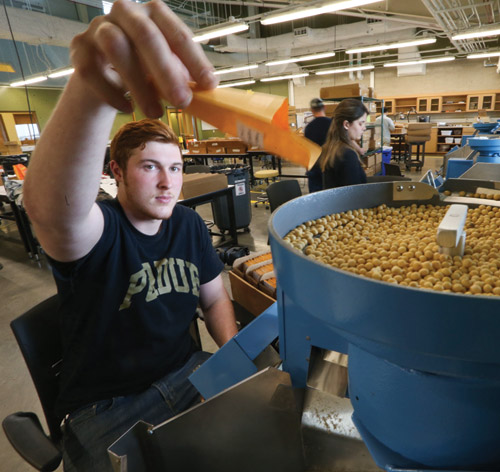
Adam Fisher, pre-veterinary student, sorts and counts seeds prior to planting.
The future holds even more sophisticated techniques, says Melba Crawford, associate dean of engineering for research; professor of agronomy, civil engineering, and electrical and computer engineering; and Purdue Chair of Excellence in Earth Observation. Many of these will adapt innovative methods from other fields, such as the deep learning and computer vision approaches used by the tech industry to comb visual data for facial recognition and in self-driving cars.
“We have made excellent progress,” Crawford says. “The most recent results in plant and leaf counting from our electrical engineering group using deep learning have been very promising.”
Once extracted, this phenotype data will merge with the flood of data from the world of plant “omics”—the genes and proteins controlling plant development and function. Marshall Porterfield, a professor of agricultural and biological engineering whose past work includes research on growing plants on the International Space Station, sees a future where these data streams combine to make the vision of digital agriculture a reality.
“Access to the molecular level of what’s happening in the crops and the plants themselves at a systems biology level can allow us to develop targets for selection so that crops perform better in general,” Porterfield says. “It’s like precision medicine, where they hope to someday take a look at your genome and determine which drugs work best for you. Why not look at a crop or field situation, the soil, the nutrients, the sunlight or water availability, and fine-tune a crop variety to match that application?”
And while a hyperspectral image might be far too complex for practical application, software can be written that translates that information into simple recommendations. Eventually, a dashboard can be designed as a kind of digital advisor for farmers, aggregating and repackaging the streams of data collected from their crops into real-time feedback.
“From the data point of view, analytics is key. How do you create particular algorithms that give actionable information to, for example, turn on a fertilizer sprayer?” asks Janice Zdankus, vice president of quality for HPE. “If you look at the value of taking localized data on a farm level and analyzing it to say when to turn on a nozzle at the right amount at the right time, that’s very valuable to a farmer.”
From the local farm to global food security, the big data harvest holds great promise for the future of agriculture, both supplementing thousands of years of acquired knowledge and revealing new perspectives on farming. In the College of Agriculture, ultramodern facilities and a strong interdisciplinary focus create an environment where these new technological capabilities can be aimed at the largest challenges.
“If we’re going to feed 10 billion people in the next 30 to 40 years, we want to be more efficient in the production of food and make predictions about what’s economically the most sustainable way of producing food, all while having the least impact on the environment,” Tuinstra says. “That’s what digital agriculture is: using big data so we can make better decisions that impact agricultural sustainability and productivity.”
Photos provided by Tom Campbell.