Additional Data for the Tourism and Recreation Report
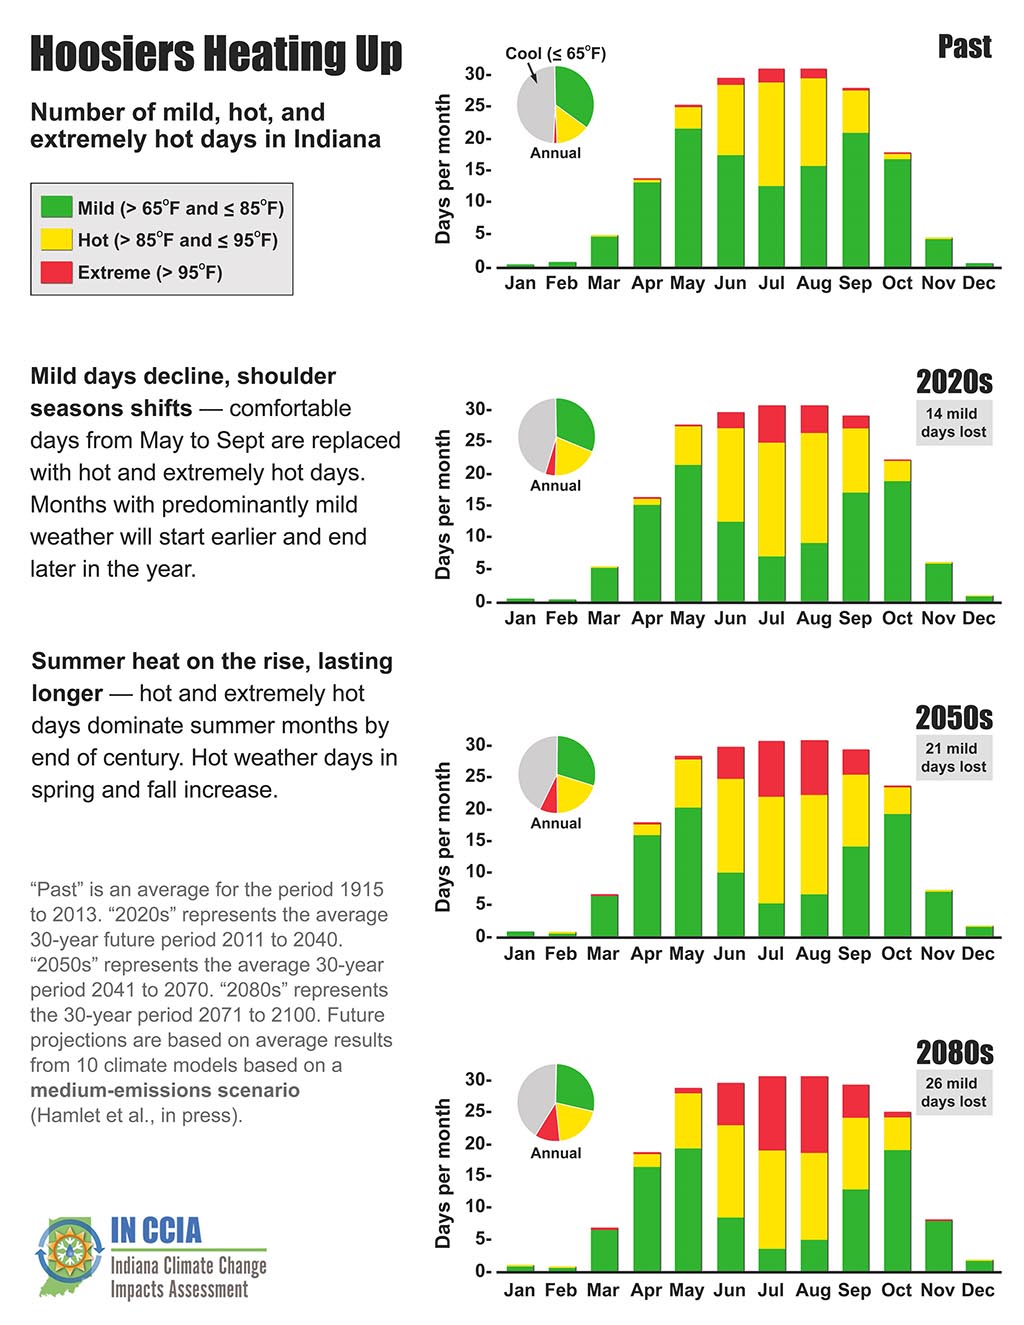
Above: Projected number of mild, hot, and extremely hot days in Indiana by month (stacked bars) and annually (pie chart) for the historical period (1915 to 2013) and three time periods in the future based on a medium-emissions scenario. For the future projections, “2020s” represents the average from 2011 to 2041, “2050s” represents the average from 2041 to 2070, and “2080s” represents the period from 2071 to 2100.