Indiana’s Past & Future Climate: A Report from the Indiana Climate Change Impacts Assessment
Indiana’s climate is changing. Temperatures are rising, more precipitation is falling and the last spring frost of the year has been getting steadily earlier.
The data, going in some cases back to 1895, show clear trends, and there are no signs of them stopping or reversing. In some cases, these have been slow progressions. But the speed with which these changes occur has increased significantly in recent decades.
Projections show the pace picking up even more speed as heat-trapping gases, produced by humans burning fossil fuels, continue accumulating in the atmosphere. Indiana will continue to warm, more precipitation will fall, and extremely hot days will be common in many parts of the state. These changing climate patterns affect us individually and affect many aspects of our society, including human health, public infrastructure, water resources, agriculture, energy use, urban environments, and ecosystems.
This report from the Indiana Climate Change Impacts Assessment (IN CCIA) describes historical climate trends from more than a century of data and future projections that detail the ways in which our climate will continue to change.
the takeaway
- Key finding: Indiana has already warmed 1.2°F since 1895. Temperatures are projected to rise about 5°F to 6°F by mid-century1, with significantly more warming by century’s end.
- Why it matters: A rising average temperature increases the chance of extreme heat and reduces the chance of extreme cold, and it also changes the timing and length of the frost-free season when plants grow. These shifts will impact air quality, extend the growing season and the allergy season, and create more favorable conditions for some pests and invasive species.
- Key finding: The number of extremely hot days2 will rise significantly in all areas of the state. In the past³, southern Indiana averaged about seven of these days per year, but by mid-century this region is projected to experience 38 to 51 extremely hot days per year.
- Why it matters: Extreme heat raises the likelihood of heat-related illnesses, such as heat exhaustion and heat stroke, which can lead to increased hospitalizations and medical costs. Children and the elderly are especially vulnerable. Extreme heat also reduces crop yields, counteracting the benefits of a longer growing season.
- Key finding: Extreme cold events are declining. By mid-century, the northern third of Indiana will experience on average only six days per year below 5°F, down from 13 days in the past3.
- Why it matters: Cold temperatures control populations of disease-carrying insects such as mosquitoes and ticks, as well as forest pests. Warmer winters would allow some of these species to remain active for longer periods or to expand their ranges into Indiana.
- Key finding: Average annual precipitation has increased 5.6 inches since 1895, and more rain is falling in heavy downpours. Winters and springs are likely to be much wetter by mid-century, while expected changes in summer and fall precipitation are less certain.
- Why it matters: Increased precipitation, especially in the form of heavy rain events, will increase flooding risks and pollute water as combined sewer systems overflow and fertilizers run off of farm fields. Warmer summers with the same or less rain would increase stress on agricultural crops and drinking water supplies.
- Key finding: The frost-free season has lengthened by nine days per year statewide since 1895. This trend is projected to continue and intensify. By mid-century, central Indiana’s frost-free season is projected to increase by 3.5 to 4.5 weeks compared to the past3.
- Why it matters: Longer growing seasons can increase the productivity of food crops and forests, and could expand crop-production opportunities in northern latitudes or the possibility of double-cropping further south. But they also increase growth of less desirable plants like ragweed and create favorable conditions for some invasive species.
The Data
This report is based primarily on two documents developed by the IN CCIA Climate Working Group. Historical trends span the period 1895 to 2016, depending on the specific variable. See Widhalm et al. (2018) for further details on the historical analysis.
Future climate projections presented here are based on averages from 10 global climate models, which we consider to be the most likely outcomes for a given emissions scenario. The projections from those models estimate average climate patterns during three 30-year periods centered around the 2020s (2011 to 2040), 2050s (2041 to 2070) and 2080s (2071 to 2100). Throughout this report, “mid-century” refers to the 30-year period centered around 2050 and “late century” refers to the 30-year period centered around 2080.
Two future greenhouse gas emission scenarios are considered — “medium” and “high.” These scenarios follow Representative Concentration Pathways (RCPs) 4.5 and 8.54, respectively, which have been used to develop many previous projections summarized by the Intergovernmental Panel on Climate Change. See Hamlet et al. (2019) and Byun and Hamlet (2018) for further details on the future climate analysis.
In interpreting the data in this report, it is important to keep in mind that a range of future climates is possible for our state, depending not only on the future rate of greenhouse gas emissions, but also on how the climate system responds to those emissions – not just in the compilations of mathematical equations known as climate models, but in reality. We describe some of the techniques and assumptions that go into this report’s projections in this linked sidebar.
When using this report or any set of projections from climate models to plan for the future, the reader can place greater weight on outcomes that are projected by most or all models (like the increasing temperatures projected in this report). When different climate models give fairly different projections for a variable (such as for fall precipitation in this report), then more caution should be used. Planning now for a range of possible future climates will be much less risky than counting on one particular outcome.
Back to Top
Temperatures
Since 1895, Indiana’s statewide annual average temperature has risen by 1.2°F, or about 0.1°F per decade. When talking about weather — a snapshot of conditions in a particular moment or day — a degree or two of change can happen quickly. However, with climate — the long-term average weather patterns over many decades — a few degrees of change in these averages translates into serious local impacts.
While Indiana’s temperature has been rising over the last century, much of that increase has occurred since the 1960s and has already led to much earlier springs than the state experienced a century ago.
The largest temperature increase has been in spring, when the average temperature has risen 0.2°F per decade (1895 to 2016). Winter and fall have warmed about half as much. And there has been no change in the average summer temperature from 1895 to 20165.
The warming trend has sped up in recent decades. Since 1960, the average annual temperature has risen 0.4°F per decade, with warming trends identified in all four seasons. This recent temperature increase has been greatest in winter, at 0.7°F per decade.
Trends in maximum and minimum daily temperatures, averaged over the year, are similar to those of the daily average temperatures.

Above: Statewide annual average temperature for Indiana from 1895 to 2016 is shown in red. The black solid line shows the increasing trend in annual temperature (0.1°F/decade) for the period from 1895 to 2016. The black dotted line shows the temperature trend since 1960 (0.4°F”/decade). Source: NOAA Climate at a Glance Database.

Left: Annual and seasonal temperature trends for Indiana from 1895 to 2016 (top) and from 1960 to 2016 (bottom). Both tables show maximum temperature (Tmax), average temperature (Tavg), and minimum temperature (Tmin). Source: NOAA Climate at a Glance Database.
Why Use Average Temperature?
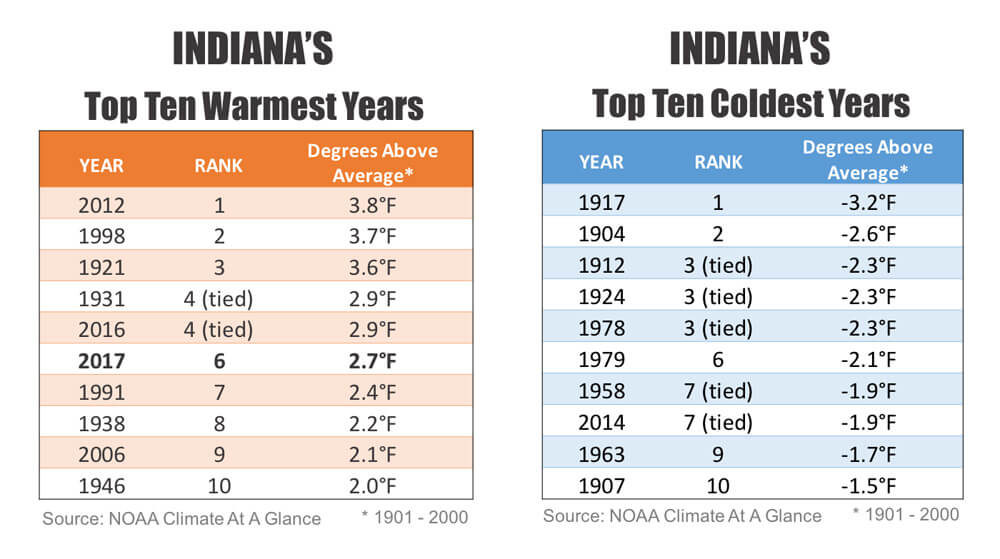
Scientists look at annual average temperature as an overall indicator of the state of the climate. Why? Because when you combine temperature measurements for many locations over the course of a year, the values do not fluctuate much from year to year. This makes it easy to identify extreme years and detect short- and long-term trends
For Indiana, a year’s annual temperature might be a degree warmer or colder than the long-term average. When we start getting 2 or 3 degrees from this average, we reach record-setting territory. Future projections have our state’s average temperature warming well beyond what we’ve seen in the past, which explains why a few degrees of change is cause for concern.
The average global temperature is undergoing similar increases. From 1945 to 1979, there were no records set for hottest global average temperature. Record setting temperatures have happened 12 times since, with 2014, 2015, and 2016 each breaking the record. The 2017 global average temperature ranked third-warmest6, and that year marked the 41st in a row with above-average temperatures. If the climate were not warming, the chance of randomly having 41 above-average years in a row would be less than one in a trillion.
The warming trends measured in recent decades across Indiana will continue and intensify in the coming decades.
Under the medium- and high-emission scenarios, relative to the recent past , Indiana’s annual average temperature is projected to increase by about 3°F by the 2020s. By the mid-century, temperatures rise about 5°F under the medium scenario and about 6°F under the high scenario. By late century, the state’s average annual temperature reaches about 6°F and 10°F above the historical average7, respectively, under those scenarios. This increase is projected to be similar in all seasons, although some models suggest the warming will be greatest in summer and fall by late century.

Above: Difference in the global average temperature (including both land and ocean surfaces) from the long-term average for each year from 1880 to 2016. The long-term average is based on the historical reference period of 1901 to 1960. Red bars show warmer-than-average temperatures, and blue bars show cooler-than-average temperatures. Source: USGCRP 2017.
Right: Trajectory of annual mean temperature change for Indiana. The historical reference period is 1971 to 2000. Heavy black line shows Indiana’s annual temperature from historical observations (1915 to 2013). Each shaded area represents 95 percent of climate model projections. The most extreme projections are omitted, and colored-lines show the average projection of the 31 remaining models. Source: Byun and Hamlet 2018.


Above: Projected changes in monthly average temperature for Indiana for the 2020s (2011-2040), 2050s (2041-2070), and 2080s (2071-2100), relative to a 1971 to 2000 historical baseline. The solid red and blue lines show the 10-model average for the high and medium emissions scenarios, respectively. The shaded areas show the range of results across the 10 climate models. Source: Hamlet et al. (2019).
Those temperature increases would add to stress on crops such as corn, soybeans, and wheat, and could reduce crop yields. Production of ground-level ozone, a major component of smog, increases with temperature. This diminished air quality would pose a threat to those suffering from asthma or other lung-related illnesses, increasing hospital visits, medical costs and premature deaths8, as well as harming crops.
Rising temperatures have already led to a longer growing season. Indiana’s frost free season — in which the temperature continuously stays above 32°F — has been extended by an average of nine days beyond what it was in 1915. Eight of those have come in the spring and one in the fall.
This trend is expected to accelerate, as warming temperatures significantly lengthen the growing season throughout the state. Central Indiana historically3 averaged 175 consecutive frost-free days per year. The region is projected to have 202 under the medium scenario and 208 under the high scenario by mid-century. It’s possible that some places could double-crop or northern latitudes could grow a wider variety of crops. Additionally, more consecutive frost-free days would extend the allergy season, which closely follows the length of the growing season. Many birds that migrate according to temperature or daylight cues rely on dropped grain in agricultural fields during migrations. Those species that continue to migrate at the same time could be at a disadvantage as harvest dates move later because that food source would no longer be available to them.
Warming temperatures in the winter months also affect the types of plants that can thrive in Indiana. According to the USDA Plant Hardiness Zones, which are derived from average winter extreme minimum temperatures, the southern tip of Indiana by late century under the high emissions scenario would mimic that of today’s northern Alabama plant hardiness (zone 7b).

Above: Growing season length and average first/last freeze dates for northern, central, and southern Indiana."Historical" is the average for the period 1915 to 2013. For future projections, "2050s" represents the average of the 30-year period from 2041 to 2070 for the high emissions scenario. Data for other locations and time periods available. Source: Hamlet et al. (2019).

Left: USDA Plant Hardiness Zones for three Indiana counties. “Historical” is an average for the period 1915 to 2013. For the future projections, “2020s” represents the average of the 30-year period from 2011 to 2040, “2050s” represents the average from 2041 to 2070, and “2080s” represents the average from 2070 to 2100. Data for other locations available. Source: Hamlet et al. (2019).
Changes in Indiana’s climate are projected to alter the amount of energy that Hoosiers will need to heat and cool their homes and businesses. Annual heating needs are typically measured in “heating degree days,” while cooling demand is measured in “cooling degree days9.” Historical3 data show no detectable trend in statewide average heating degree days or cooling degree days per year from the period 1950 to 2016, but as temperatures warm in all seasons by mid and late century, heating and cooling demands will change.
Under the high-emission scenario, rising temperatures will lead to about a fourfold increase in cooling degree days by the 2080s compared to the last century3. Heating degree days are projected to decline by about 30 percent. By late this century, people in northern Indiana will run their furnaces only as much as people in southern Indiana did historically. At the same time, though, these northern Hoosiers are expected to run their air conditioners far more often than those in the south did historically.


Above: Cooling degree days per year for three representative Indiana counties. “Historical” is an average for the period 1915 to 2013. For the future projections, “2020s” represents the average of the 30-year period from 2011 to 2040, “2050s” represents the average from 2041 to 2070, and “2080s” represents the average from 2070 to 2100. Data for other locations available. Source: Hamlet et al. (2019).
Above: Heating degree days per year for three representative Indiana counties. “Historical” is an average for the period 1915 to 2013. For the future projections, “2020s” represents the average of the 30-year period from 2011 to 2040, “2050s” represents the average from 2041 to 2070, and “2080s” represents the average from 2070 to 2100. Data for other locations available. Source: Hamlet et al. (2019).
Precipitation
Since 1895, average annual precipitation in Indiana has increased by about 15%, or about 5.6 inches, based on a linear trend. This trend is projected to continue, though the type of precipitation and when it falls are changing and will continue to do so.
From 1895 to 1959, the state gained 0.32 inches of precipitation per decade. Since then, the rate of precipitation change has increased to 1.33 additional inches per decade, a fourfold increase. This increase is happening in every season, though spring (0.13 inches per decade) and summer (0.19 inches per decade) have increased at a more rapid pace than fall (0.11 inches per decade) and winter (0.03 inches per decade) over the period 1895 to 2016.
While precipitation increased throughout the state from 1895 to 2016, some places have seen bigger increases than others. The southern and west-central regions of the state observed the largest increases, while the east-central and northeast observed the smallest. Spring and fall increases were smallest in the north and largest in the south. The opposite was true in summer, when increases were larger in the north and west.

Above: Statewide annual total precipitation for Indiana from 1895 to 2016. Black solid line shows the increasing trend in annual precipitation (0.46”/decade) for the period from 1895 to 2016. The red dotted line shows the precipitation trend since 1960 (1.33”/decade). Source: NOAA Climate at a Glance Database
Under both future emission scenarios, annual precipitation is projected to increase. By mid-century, Indiana will see about 6 percent to 8 percent more rainfall than it averaged in the recent past7, depending on the scenario. However, the increasing precipitation will not fall evenly across the entire year.
The ten climate models give similar projections for precipitation during some seasons, but not during others. During winter and spring months, nearly all of the climate models suggest increasing precipitation in all three future periods, with greater increases over time for both emission scenarios. There is less certainty, however, in the direction and magnitude of change in the summer and fall months. Relative to the recent past7, the average of all climate models shows little or no precipitation change in summer and fall during the 2020s, although individual models show increases or decreases. By mid-century, more of the climate models point to drier conditions, but the average change relative to the recent past7 is still minimal (2 to 3 percent decline). By late century, under the high emissions scenario, summer precipitation is projected to decline by nearly 8 percent, and fall precipitation declines by about 2 percent.
Above: Projected changes in monthly average precipitation for Indiana for the 2020s (2011-2040), 2050s (2041-2070), and 2080s (2071-2100), relative to a 1971 to 2000 historical baseline. The solid red and blue lines show the 10-model average for the high and medium emissions scenarios, respectively. Shaded areas show the corresponding range of results across the 10 climate models. Source: Hamlet et al. (2019).
As the climate warms, rain will take the place of much of the snow in the cold season from November through March. In southern Indiana, there will be little snowfall at all by late century under both emission scenarios. In the north, snowfall will be greatly reduced compared to the past3. Instances of more than 2 inches of snow will be quite rare in southern Indiana by the 2080s under the high emission scenario. Throughout the state, and under both scenarios, snow events of greater than 2 inches happen about half as often by the end of the century.
Fewer snow days would save municipalities and the state money used to plow and salt roadways. Residents are expected to save time and resources used for personal snow removal.

Above: Increase in annual precipitation for Indiana’s nine climate divisions, based on a linear trend, from 1895 to 2016. Source: NOAA Climate at a Glance Database.

Left: Percent of cold-season precipitation falling as snow for three Indiana counties. A value of 100 would mean that all precipitation from November to March fell as snow, while a value of 0 would mean none of the precipitation was snow. “Historical” is the average for the period 1915 to 2013. For the future projections, “2020s” represents the average of the 30-year period from 2011 to 2040, “2050s” represents the average from 2041 to 2070, and “2080s” represents the average from 2070 to 2100. Data for other locations available. Source: Hamlet et al. (2019).
Right: Number of days per year with more than 2 inches of snow for three Indiana counties. “Historical” is the average for the period from 1915 to 2013. For the future projections, “2020s” represents the average of the 30-year period from 2011 to 2040, “2050s” represents the average from 2041 to 2070, and “2080s” represents the average from 2070 to 2100. Data for other locations available. Source: Hamlet et al. (2019).

But wetter winters and springs would increase the risk of flooding. Increased precipitation as rain in the winter, when fields are fallow, could wash fertilizer and sediment from farm fields, degrading water quality downstream and reducing crop yields the following growing season. Combined sewer system overflows, an existing problem for many Hoosier communities during high rainfall events, could occur more frequently, dumping sewage into local waterways. Added precipitation in spring may also make it difficult for early agricultural planting as fields could be too muddy for heavy farm machinery to enter. Projections for summer precipitation vary among models, but the average projection of reduced precipitation would increase the risk of water stress in crops, especially when paired with higher temperatures.
Warm-season humidity (May to September) has been on the rise across the state. From 1973 to 2016, average dew-point temperature increased slowly in some places — 0.18°F per decade in South Bend and 0.22°F per decade in Indianapolis— and more quickly in others — 0.73°F per decade in Fort Wayne, 0.62°F per decade in Lafayette, and 0.59°F per decade in Evansville.
High levels of atmospheric moisture can make temperatures feel hotter, as measured by heat index, which is calculated using air temperature and dew point temperature. Despite rising dew point temperatures, the number of especially high heat index days — those in the top 5 percent of heat index temperatures — does not show a meaningful trend from 1973 to 2016. That suggests that days with high dew point temperatures did not always occur on days with high air temperatures. During the 1990s the frequency of high heat index days declined compared to the 1973 to 1989 period before returning to historical levels from 2000 to 2016.
“American Climate Prospectus: Economic Risks in the United States,”10 a 2014 report by Rhodium Group, projects an expansion of hot, humid weather throughout the country in the coming decades. The group developed an index of heat stroke risk using wet-bulb temperature, which combines air temperature and humidity. The report predicts that by mid-century (2040 to 2059) much of the Midwest, including Indiana, will experience wet bulb temperatures of 80°F to 86°F for 10 to 30 days each year, up from 1 to 10 days per year in the historical period (1981 to 2010). These conditions are considered dangerous, and much like the hottest summer months in the most humid parts of Texas and Louisiana or the most humid summer days in Washington, D.C., and Chicago today.
Climate Change Has Already Significantly Affected the American Economy
Extreme weather and fire events have cost the U.S. federal government over $350 billion during the last decade (excluding costs related to Hurricanes Harvey, Irma, and Maria in 2017). The U.S. Government Accountability Office said in a 2017 report that costs are likely to rise as our climate changes. By mid-century, federal disaster cleanup costs could nearly double, increasing by $12 billion to $35 billion per year.
A White House report on the threat of carbon pollution in Indiana points to the year 2011, when 11 of the 14 weather-related disasters that cost more than $1 billion in the United States were in the Midwest. In 2008, floods killed 24 people and cost $8 billion in agricultural losses. Those numbers are expected to climb as the region experiences more frequent and extreme heat waves, floods and lake-effect snow due to climate change.
Heavy rains cause 60 combined sewer discharges each year in Indianapolis, sending 8 billion gallons of untreated sewage into the White River and its tributaries, according to a report from the Union of Concerned Scientists. The city is spending more than $2 billion over 20 years to reduce those overflows to four per year. But as heavier rains become more frequent, the city may have to spend more to meet that goal.
On farms, cold winters help keep pests and pathogens in check. But warmer winters will allow pests to spread north and exacerbate disease pressures. U.S. corn producers spend more than $1 billion per year controlling pests, according to the Union of Concerned Scientists report. A study from Purdue University suggests that climate change and its effect on corn pests will substantially increase seed and insecticide costs for those growers and reduce crop yields.
Extreme Events
Climate change is already a suspected factor in a number of extreme events, from hurricanes in the Atlantic to droughts and resulting wildfires in the west. In Indiana, climate change will mostly affect extreme temperatures, precipitation extremes that affect stormwater, and annual peak flows that determine river flooding.
As would be expected with rising temperatures, Indiana has recently experienced a downward trend in extreme cold events. Looking across the full period of record from 1915 to 2013, there was no detectable trend in cold days — defined as days per year in which the daily minimum temperature is below 5°F — or frost days, when the daily minimum temperature is below 32°F. These trends reflect the extremely warm conditions in the 1930s and 1940s. But in the more recent period from 1960 to 2016, the average number of cold days and frost days both decreased, by nine and eight days per year, respectively.
In both medium- and high-emission scenarios, cold days and frost days decline steadily throughout the 21st century. In the medium scenario, northern Indiana moves from about 15 cold days per year in the past3 to about six by the 2080s. In the high scenario, there are on average just three cold days per year in the northern part of the state by late century.

Above: Frost days per year in three representative Indiana counties. A frost day occurs when the daily low temperature is less than 32°F. “Historical” is the average for the period from 1915 to 2013. For the future projections, “2020s” represents the average 30-year period from 2011 to 2040, “2050s” represents the average from 2041 to 2070, and “2080s” represents the period from 2070 to 2100. Data for other locations available. Source: Hamlet et al. (2019).
The average lowest temperature of the year is expected to rise throughout the state, and by similar amounts from north to south. These temperatures – typically the coldest night of the winter for a given location – are projected to rise by about 6°F by mid-century compared to the average over the last century3 in both the medium- and the high-emissions scenarios. This puts Indiana at risk for some invasive species and insect pests that historically would not survive Indiana’s coldest winter temperatures.
Even though Indiana’s average temperatures have increased over time, the average number of extremely hot days per year decreased from 1915 to 2013. This decline was largely driven by the extremely hot temperatures that occurred with high frequency during the 1930s drought years, which skew the record. During the worst of the heat, both 1933 and 1934 had more than 20 days per year with statewide average temperatures exceeding 95°F. For comparison, the average number of extremely hot days statewide in the recent past7 was just two per year, though this number varies throughout the state, with more extremely hot days in the south than other areas. There has been no change in the number of extremely hot days per year between 1960 and 2013. This corresponds to the trends seen seasonally, in which summer temperatures have been fairly steady while the other seasons have seen temperatures climb.


Above: Coldest temperature of the year for three representative Indiana counties. “Historical” is an average for the period from 1915 to 2013. For future projections, “2020s” represents the average of the 30-year period from 2011 to 2040, “2050s” represents the average from 2041 to 2070, and “2080s” represents the average from 2070 to 2100. Data for other locations available. Source: Hamlet et al. (2019).
Above: Extreme heat days per year for three representative Indiana counties. An extreme heat day occurs when the daily high temperature is above 95°F. “Historical” is the average for the period from 1915 to 2013. For future projections, “2020s” represents the average 30-year period from 2011 to 2040, “2050s” represents the average from 2041 to 2070, and “2080s” represents the average from 2070 to 2100. Data for other locations available. Source: Hamlet et al. (2019).
But as average temperatures continue to warm, the occurrence of extreme heat events is projected to rise substantially. Extremely hot days2 increase in both emission scenarios throughout the century with parts of southern Indiana, such as Evansville (located in Vanderburgh County), projected to experience the most.
Our analysis shows that the state’s average hottest temperature of the year is also projected to rise. Over the last century, the average hottest day of the year was 97°F. By mid-century, the hottest temperature of the year is projected to be about 8°F higher than in the past3 under both emissions scenarios. Elevated high temperatures can create challenges for roadways and pavement as the risk of warping and buckling during the hottest times of the year increases (Chinowsky et al. 2013). The roadway materials used historically may be inappropriate for these new temperatures.
Extreme rainfall events, defined as having a daily rainfall total in the top 1 percent of all events, have increased over the last century and are expected to continue to do so. Heavy downpours contribute to soil erosion and nutrient runoff, which affects both water quality and crop productivity. These events can also overwhelm wastewater systems and create challenges for flood-control infrastructure.
Averaged across the entire state, historically, an extreme rain event occurs when more than 0.86 inches of rain falls in a day. Since 1900, the number of days per year with extreme rain has been increasing by 0.2 days per decade on average. However, most of that increase has occurred since 1990. The northwestern part of the state has seen the largest increase — a rate of about 0.4 days per decade.
Regional observations of heavy precipitation in the midwestern U.S. also show that not only are extreme events happening more frequently, but that higher rainfall totals are being measured within these events. Averaged across the Midwest, there has been a 42 percent increase in the amount of precipitation falling in the top 1 percent of events from 1958 to 2016 (USGCRP, 2017). This observed regional trend gives additional support for the validity of the results in Indiana.
Heavy precipitation events are expected to intensify as temperatures rise throughout this century. Preliminary analysis from IN CCIA scientists suggest a one-to-two day increase in the average number of days per year with extreme precipitation. This finding is consistent with other analyses conducted for the midwestern U.S. (Pryor et al., 2014). Additionally, across the Midwest, a twofold to threefold increase in the number of storm events exceeding a two-day five-year return period11 is projected by late century under the high emissions scenario, with one-day 20-year return period storms increasing by about 20 percent (USGCRP, 2017).

Above: Hottest temperature of the year for Indiana. “Historical” is the average for the period 1915 to 2013. For future projections, “2020s” represents the average 30-year period from 2011 to 2040, “2050s” represents the average from 2041 to 2070, and “2080s” represents the average from 2070 to 2100. Data for other locations available. Source: Hamlet et al. (2019).

Left: The number of days with precipitation events that exceed the 1900 to 2016 period’s 99th percentile for Indiana (statewide average). The black line represents the trend line (0.2 days/decade) for the 1900 to 2016 period. Source: Midwestern Regional Climate Center
Indiana has about 15 tornadoes per year that rate at least EF1 on the Enhanced Fujita scale, in which EF5 tornadoes are the most damaging. Since 1960, tornadoes have been seen in every month, but mostly in April to June. There is significant variation year to year and no trend in tornado activity.
Warming temperatures could lengthen the storm season, but predictions for future severe storms are difficult to make. Scientists look at the “ingredients,” such as instability and vertical wind shear, that can lead to thunderstorms and tornadoes. Those ingredients are expected to increase under a changing climate (Diffenbaugh et a., 2013), but that doesn’t necessarily mean that they will lead to increased storm activity or more severe storms.
Recently, scientists have begun using models to estimate the likelihood of increased storm activity. Early projections suggest an increase in the frequency and intensity of storms, but considerable uncertainty remains (Gensini and Mote, 2014; Hoogewind et al., 2017).
Key Knowledge Gaps
While some trends in Indiana’s climate can be estimated from climate models, other aspects remain difficult to predict. For instance, our state receives much of its summer precipitation in storms that are too small in diameter to be represented individually in global climate models. Forecasting how the character of these storms will change is important, but also complicated and time-consuming, and not yet possible for this report. Similarly, there isn’t much information on how changes in Lake Michigan’s temperature are likely to affect northern Indiana’s climate because lake temperatures are not well represented in most models. Research on these and other challenging topics is already underway.
Conclusions
This assessment documents that significant changes in Indiana’s climate have been underway for over a century, with the largest changes occurring in the past few decades. The findings in this assessment highlight the projected future changes using two scenarios representing the rise of heat-trapping gases over the next century. These projections generally suggest that the trends that are already occurring will continue and the rates of these changes will accelerate. They indicate that Indiana’s climate will warm dramatically in the coming decades, particularly in summer. Both the number of hot days and the hottest temperatures of the year are projected to increase markedly. Indiana’s winters and springs are projected to become considerably wetter, and the frequency and intensity of extreme precipitation events are expected to increase, although more research is needed in this area to better determine the details.
There is no single place in the United States today that has a climate representative of the projected climate for Indiana. Summers in Indiana will increasingly feel like those we associate with Mississippi, Arkansas, and other states to Indiana’s southwest. Winters will feel more like those recently seen in Pennsylvania, New Jersey, and Maryland. These dramatic changes will affect many sectors of our state.
This report serves as a resource for Hoosiers and a starting point for further analyses of how Indiana’s economy and resources will be affected by the changing climate. Related data are available online at IndianaClimate.org.

Above: An illustration of what Indiana’s summer and winter climates will feel like under future scenarios, as compared to today’s climate in the United States. The colored Indiana outlines are centered over the regions with the most similar summer (left) and winter (right) climates to the projected future climate of Indiana for medium (blue outlines) and high (red outlines) emissions scenarios. Projections are based on statewide seasonal averages for temperature and precipitation. Underlying maps show current-day seasonal average temperatures based on data from PRISM.
References
Alter, R. E., Douglas, H. C., Winter, J. M., and E. A. B. Eltahir. (2018). Twentieth century regional climate change during the summer in the central United States attributed to agricultural intensification. Geophysical Research Letters, 45. DOI: 10.1002/2017GL075604
Byun, K. and A.F. Hamlet. (2018). Projected Changes in Future Climate over the Midwest and Great Lakes Region Using Downscaled CMIP5 Ensembles. International Journal of Climatology, DOI 10.1002/joc.5388 (in press).
Chinowsky, P.S., Price, J.C. and J.E. Neumann. (2013). Assessment of climate change adaptation costs for the US road network. Global Environmental Change, 23(4), pp.764-773.
Diffenbaugh, N. S., M. Scherer, and R. J. Trapp. (2013). Robust increases in severe thunderstorm environments in response to greenhouse forcing. Proc. Natl. Acad. Sci. USA, 110, 16 361–16 366, doi.org/10.1073/pnas.1307758110.
Gensini, V. A., and T. L. Mote. (2014). Estimations of hazardous convective weather in the United States using dynamical downscaling. J. Climate, 27, 6581–6589, https://doi.org/10.1175/JCLI-D-13-00777.1
Hamlet, A., Byun, K., Robeson, S., Widhalm, M., and M. Baldwin. (2019). Impacts of Climate Change on the State of Indiana: Ensemble future projections based on statistical downscaling. Climatic Change, https://doi.org/10.1007/s10584-018-2309-9. (Read free at https://rdcu.be/cdhzT )
Hoogewind, K.A., M.E. Baldwin, and R.J. Trapp. (2017). The Impact of Climate Change on Hazardous Convective Weather in the United States: Insight from High-Resolution Dynamical Downscaling. J. Climate, 30, 10081–10100, https://doi.org/10.1175/JCLI-D-16-0885.1
Mueller, N. D., Butler, E. E., McKinnon, K. A., Rhines, A., Tingley, M., Holbrook, N. M., & Huybers, P. (2016). Cooling of US Midwest summer temperature extremes from cropland intensification. Nature Climate Change, 6(3), 317-322.
Pryor, S. C., D. Scavia, C. Downer, M. Gaden, L. Iverson, R. Nordstrom, J. Patz, and G. P. Robertson. (2014). Ch. 18: Mid-west. Climate Change Impacts in the United States: The Third National Climate Assessment, J. M. Melillo, Terese (T.C.) Rich- mond, and G. W. Yohe, Eds., U.S. Global Change Research Program, 418-440. doi:10.7930/J0J1012N.
USGCRP. (2017) Climate Science Special Report: Fourth National Climate Assessment, Volume I [Wuebbles, D.J., D.W. Fahey, K.A. Hibbard, D.J. Dokken, B.C. Stewart, and T.K. Maycock (eds.)]. U.S. Global Change Research Program, Washington, DC, USA, 470 pp.
Widhalm, M., Robeson, S., Hall, B., Baldwin, M., and J. Coleman. (2018). Indiana’s Climate Trends: A Resource for the Indiana Climate Change Impacts Assessment. Prepared for the Indiana Climate Change Impacts Assessment, Purdue Climate Change Research Center.
How to Cite
Widhalm, M., Hamlet, A. Byun, K., Robeson, S., Baldwin, M., Staten, P., Chiu, C., Coleman, J., Hall, B., Hoogewind, K., Huber, M., Kieu, C., Yoo, J., Dukes, J.S. 2018. Indiana’s Past & Future Climate: A Report from the Indiana Climate Change Impacts Assessment. Purdue Climate Change Research Center, Purdue University. West Lafayette, Indiana. https://bit.ly/2KDsaga
IN CCIA Climate Working Group:
- Alan Hamlet, University of Notre Dame (co-lead)
- Mike Baldwin, Purdue University (co-lead)
- Kyuhyun Byun, University of Notre Dame
- Chun-mei Chiu, University of Notre Dame
- Jill Coleman, Ball State University
- Jeffrey Dukes, Purdue University
- Beth Hall, Midwestern Regional Climate Center
- Kim Hoogewind, Purdue University
- Matt Huber, Purdue University
- Chanh Kieu, Indiana University
- Scott Robeson, Indiana University
- Paul Staten, Indiana University
- Melissa Widhalm, Purdue University
- Jinwoong Yoo, Purdue University
Acknowledgements: We thank Brian Wallheimer for drafting this report, Stan Coffman for assistance with graphics, and staff from Purdue University’s Department of Agricultural Communication including Maureen Manier, Darrin Pack, Erin Robinson, Kenny Wilson, Andrew Banta, Joan Crow and Russell Merzdorf. We also thank Daniel Vimont, Professor of Atmospheric and Oceanic Sciences at University of Wisconsin-Madison and John Kutzbach, Professor Emeritus of Atmospheric and Oceanic Sciences at University of Wisconsin-Madison for their scientific review of this report. We also thank Purdue University Libraries Scholarly Publishing Division, specifically Nina Collins and Marcia Wilhelm-South, for providing online publication support for all documents associated with the IN CCIA.
Footnotes
1 Compared to the state’s average temperature from 1971-2000.
2 Extremely hot days are defined as ones in which the temperature reaches 95°F or greater.
4 To achieve the medium scenario, global greenhouse gas emissions must be significantly reduced almost immediately and peak in the 2040s before declining. Under the high scenario, greenhouse gas emissions continue to increase until late this century. We are currently on the high emissions path.
5 A possible contributing factor to the lack of summer temperature increase is that farmers have boosted plant growth on croplands over the last century. The increased water loss from these crops cools the air (Mueller et al, 2016; Alter et al., 2018).
6 2017 was third-warmest year on record for U.S.
9 For this report, heating degree days are accumulated when the day’s average temperature is less than 68°F, suggesting people may be heating buildings. Cooling days are the opposite, with the day’s average temperature above 75°F and people more likely to cool a home or business. A day with an average temperature of 79°F would count as 4 cooling degree days, whereas a day with an average temperature of 55°F would count as 13 heating degree days.
10 American Climate Prospectus: Economic Risks in the United States
11 A return period describes the probability of a storm with a specified intensity happening in any given year. Storm intensity thresholds are unique to each location. A 5-year storm has a 20% chance of happening in any year. A 20-year storm has a 5% chance of happening in any year.