Hoosiers’ Health in a Changing Climate: A Report from the Indiana Climate Change Impacts Assessment
Our health is linked to our climate
In the coming decades, Indiana’s changing climate will bring with it higher temperatures, longer heat waves, more extremely hot days and more frequent extreme storm events. Those changes will affect the health of Hoosiers in every part of the state.
The pathways that lead to human health impacts are both direct and indirect. Direct effects include health impacts resulting directly from a hazard, such as heat stroke from extreme heat and respiratory illnesses from poor air quality. Indirect effects include increasing risks from “tropical” diseases like West Nile and Zika as populations of the insects that can spread these viruses grow, and increased rates of anxiety and depression as a result of coping with the loss of people or property after a severe weather event.
This report from the Indiana Climate Change Impacts Assessment (IN CCIA) describes historical and future climate-related health impacts that affect Hoosiers. The findings presented here are primarily based on the IN CCIA Health Working Group technical report (Filippelli et al., in review) and the IN CCIA report Indiana’s Past and Future Climate (Widhalm et al., 2018a).
Many analyses in this report focus on how climate change will affect death rates. Fortunately, only a small fraction of the people whose health is compromised by climate change will die from it, but the non-lethal health problems (morbidity) experienced by a much larger population of Hoosiers will also burden our society. These other illnesses still cause missed work or school, lost income, increased health expenses, and general disruption to people’s lives. However, because morbidity research has focused on national and international estimates that are not specific to Indiana, these results are not reported here.
the takeaway
- Injuries and deaths caused by extreme heat are projected to increase, while injuries and deaths caused by extreme cold are projected to decrease. Overall, the annual number of temperature-related deaths in Indiana is expected to increase, and potentially even double, by mid-century1. Children, the elderly, those in low-income households and those with pre-existing conditions will be at the greatest risk.
- Higher temperatures and stagnant air will increase ground-level ozone production, worsening air quality. Reduced air quality can trigger asthma attacks or heart attacks, and cause or worsen respiratory and cardiovascular illnesses such as asthma, emphysema, chronic obstructive pulmonary disease (COPD), high blood pressure, diabetes and heart failure. These then cause premature deaths.
- Indiana's allergy season is projected to lengthen by a month by mid-century2, due to a longer growing season. Ragweed and other plants will produce more pollen as the rising carbon dioxide in the air increases their growth.
- Ticks have expanded their range and increased reproduction rates across Indiana as temperatures have warmed in recent decades. As a result, the number of tick-borne illnesses such as Lyme disease has increased. This trend will continue and intensify as the warming continues.
- In the past 30 years, increased precipitation and flooding may have contributed to the increase in Indiana's mosquito population. Greater spring rainfall and warmer temperatures are projected to continue this trend and will provide living conditions for the more "tropical" types of mosquitoes that carry diseases such as malaria, dengue fever, and Zika.
- Increased precipitation, especially in winter and spring, will heighten flooding risks. Floods directly impact human health through physical injuries, displacement, property loss, and post-flood mold and fungus growth.
- Cities like Indianapolis will be particularly vulnerable to health risks since urban areas create "heat islands" that can intensify temperature and precipitation impacts, and also contain more sources of harmful ozone.
Heat-related Illnesses and Impacts
Heat-related illnesses cover a broad range of conditions from mild dehydration to life-threatening heatstroke. Extreme heat events increase mortality and morbidity from heatstroke, dehydration and heart disease, and can exacerbate the impact of pre-existing conditions such as diabetes and kidney disease. While everyone is vulnerable to heat-related illness, some populations are more at risk, including children, the elderly, low-income households, those with pre-existing medical conditions and people working in temperature-exposed occupations.
Indiana’s rising temperatures, especially in the form of extremely hot days and uncomfortably warm nights, affect Hoosiers’ health. Since 1960, Indiana’s average annual temperature has risen 0.4°F per decade, resulting in a cumulative 2°F increase to the annual average since 1960. This warming trend is projected to continue, with average temperatures in Indiana expected to warm 5 to 6°F by mid-century and 6 to 10°F by late century, depending on the amount of heat-trapping gases we put into the atmosphere3.
Extreme heat
Indiana's warming average temperatures are expected to decrease the frequency of cold snaps and increase the number of extremely hot days. Historically4, extreme heat events, where the daytime high temperature exceeds 95°F, were limited to fewer than five days per year on average in the central and northern portions of the state, with southern Indiana having about twice as many extremely hot days. By mid-century2, Indiana is projected to have dozens of extreme heat days per year under both the medium-5 and high-emissions6 scenarios. By late century7, the number of extreme heat days is projected to rise to dangerously high levels, with southern Indiana expecting nearly 100 days per year with extreme heat under the high-emissions scenario. (Historical and projected changes in extreme cold events are discussed in the section “Insect-Borne Illnesses” below.)
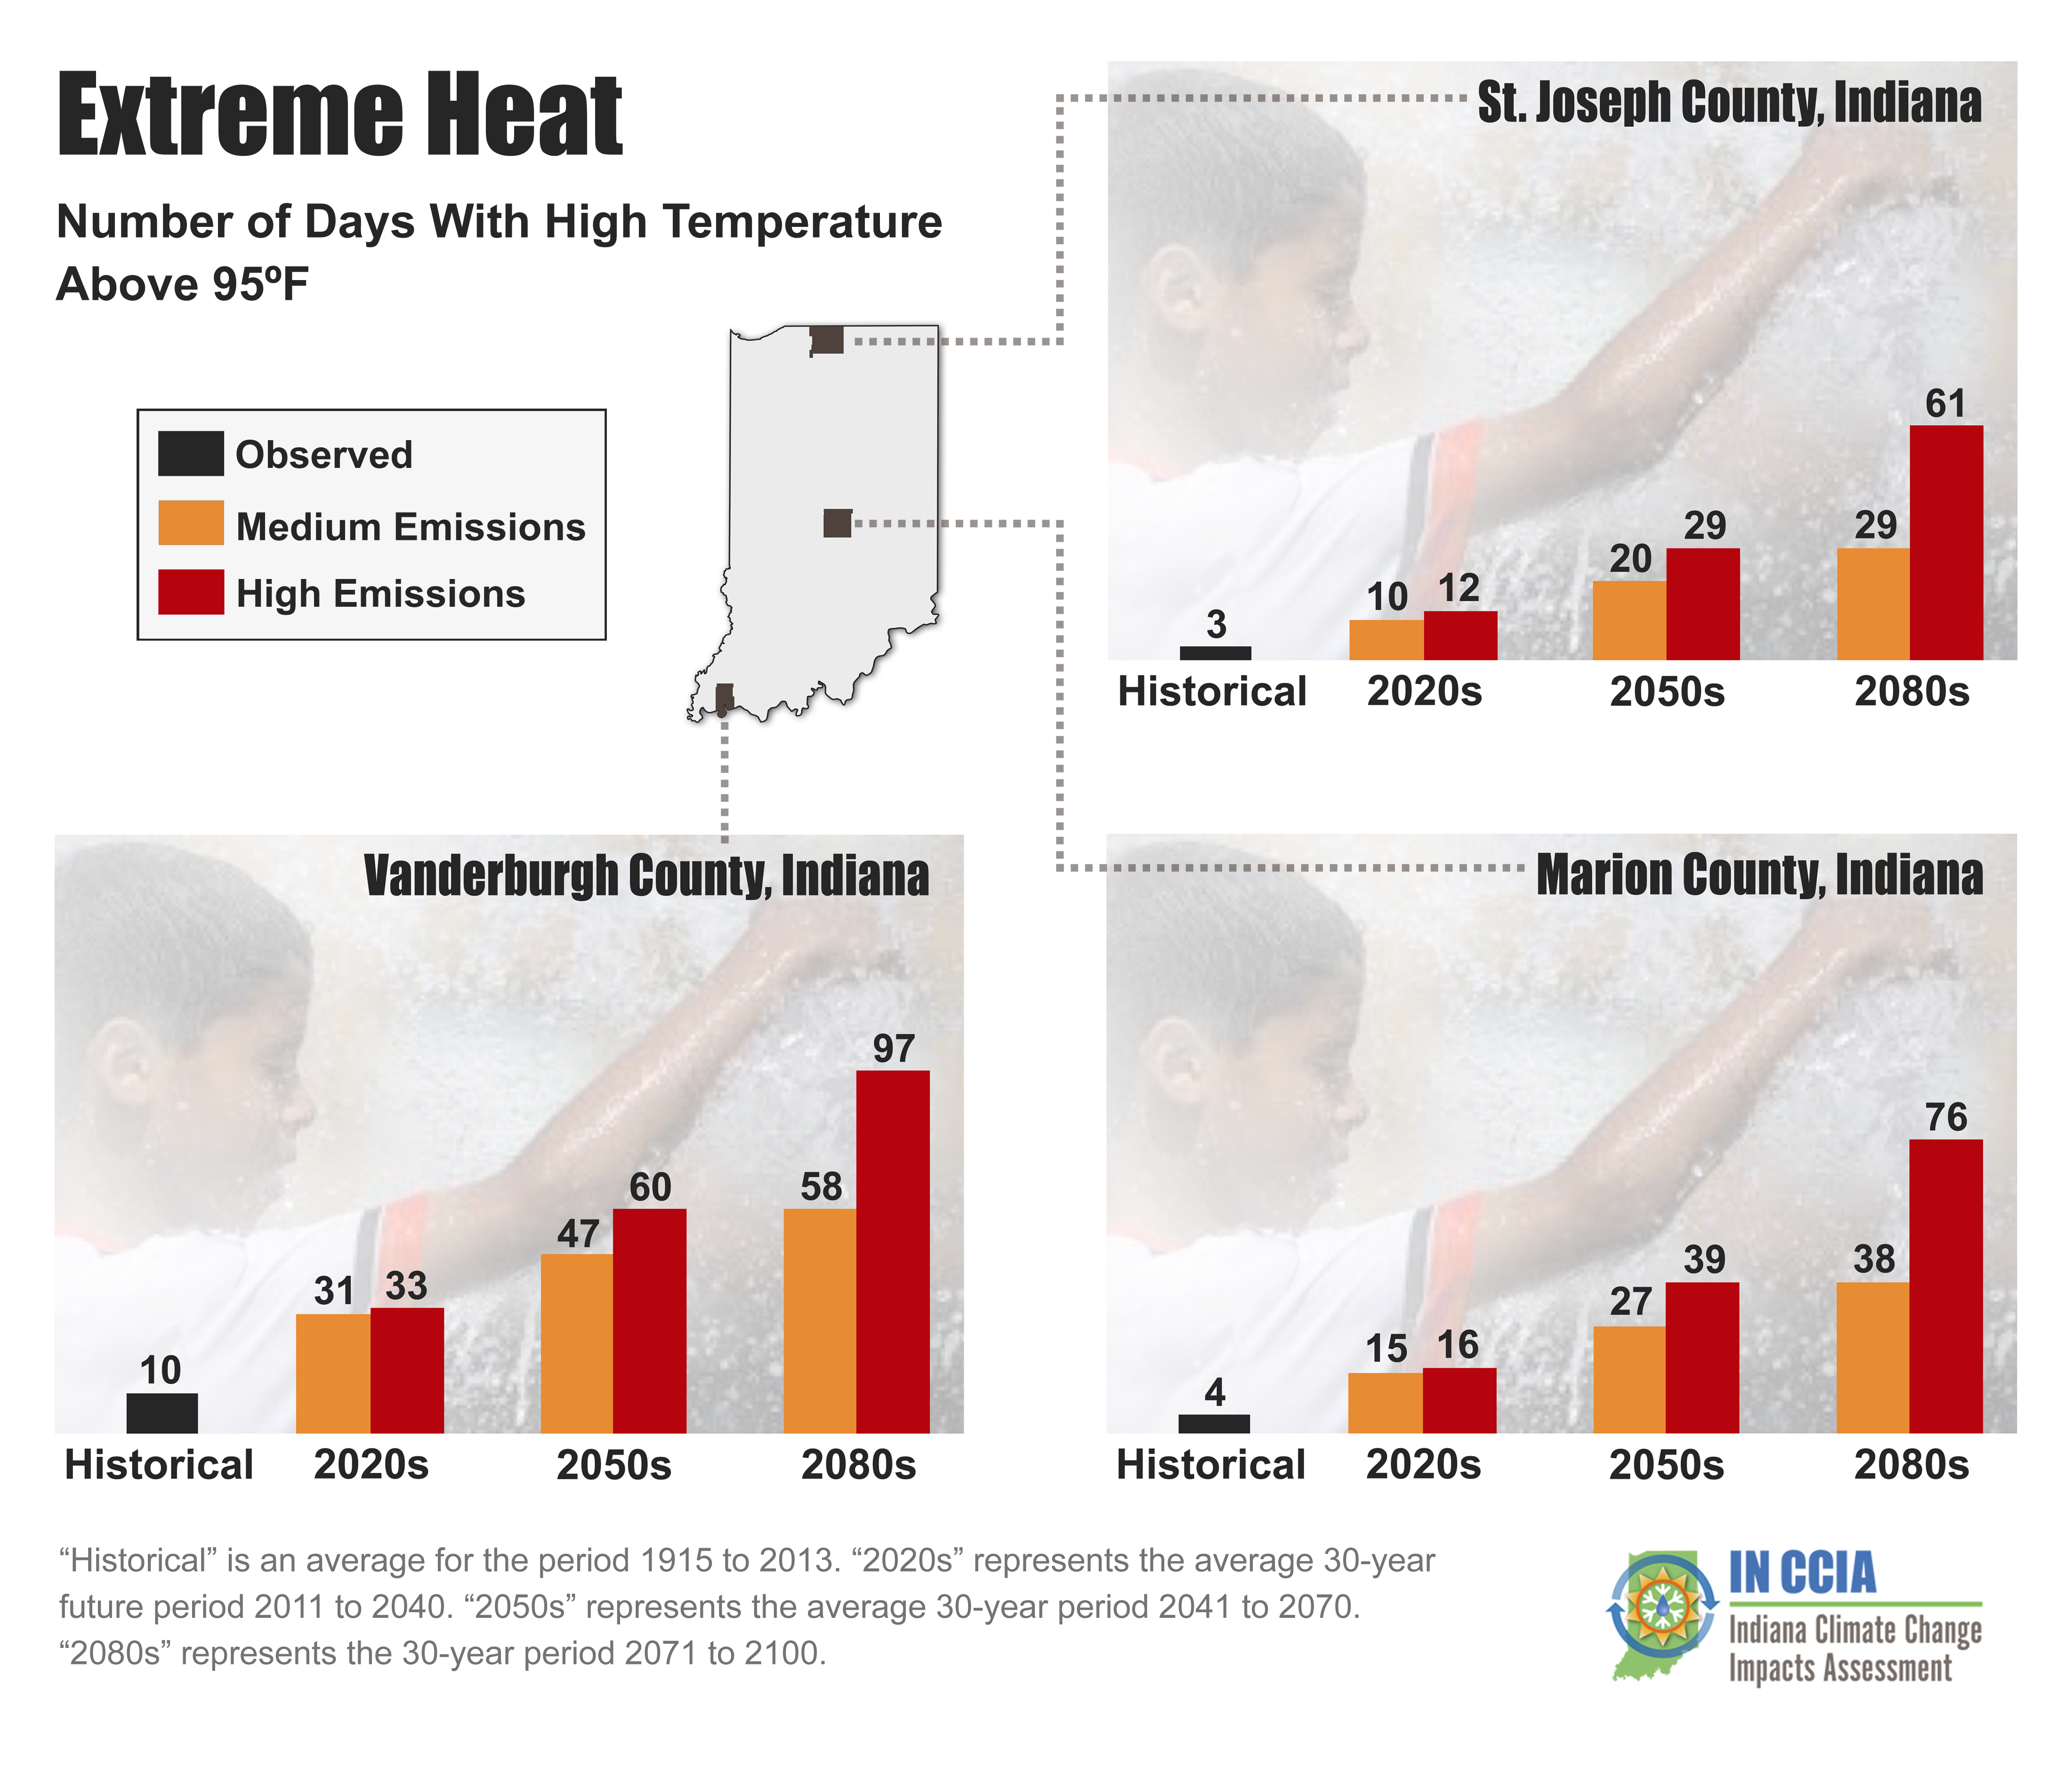
Above: Extreme heat days per year for three representative Indiana counties. An extreme heat day occurs when the daily high temperature is above 95°F. “Historical” is the average for the period from 1915 to 2013. For future projections, “2020s” represents the average 30-year period from 2011 to 2040, “2050s” represents the average from 2041 to 2070, and “2080s” represents the average from 2071 to 2100. Data for other locations available. Source: Hamlet et al. (in review) and Widhalm et al. (2018a).
Higher nighttime temperatures
Historically4, nighttime temperatures have remained above 68°F on about 10 to 40 days per year in Indiana, depending on the location. Paired with high humidity, these hot and sweaty conditions provide no respite from the daytime heat, which puts significant stress on the body and can accelerate the onset of heat-related illness for those without access to air conditioning. By mid-century2, Indiana is projected to experience these conditions much more often, with about 35 to 75 of these uncomfortable nights per year under a medium-emissions5 scenario and about 50 to 90 nights per year under a high-emissions6 scenario. Projected changes are even more dramatic by late century7.
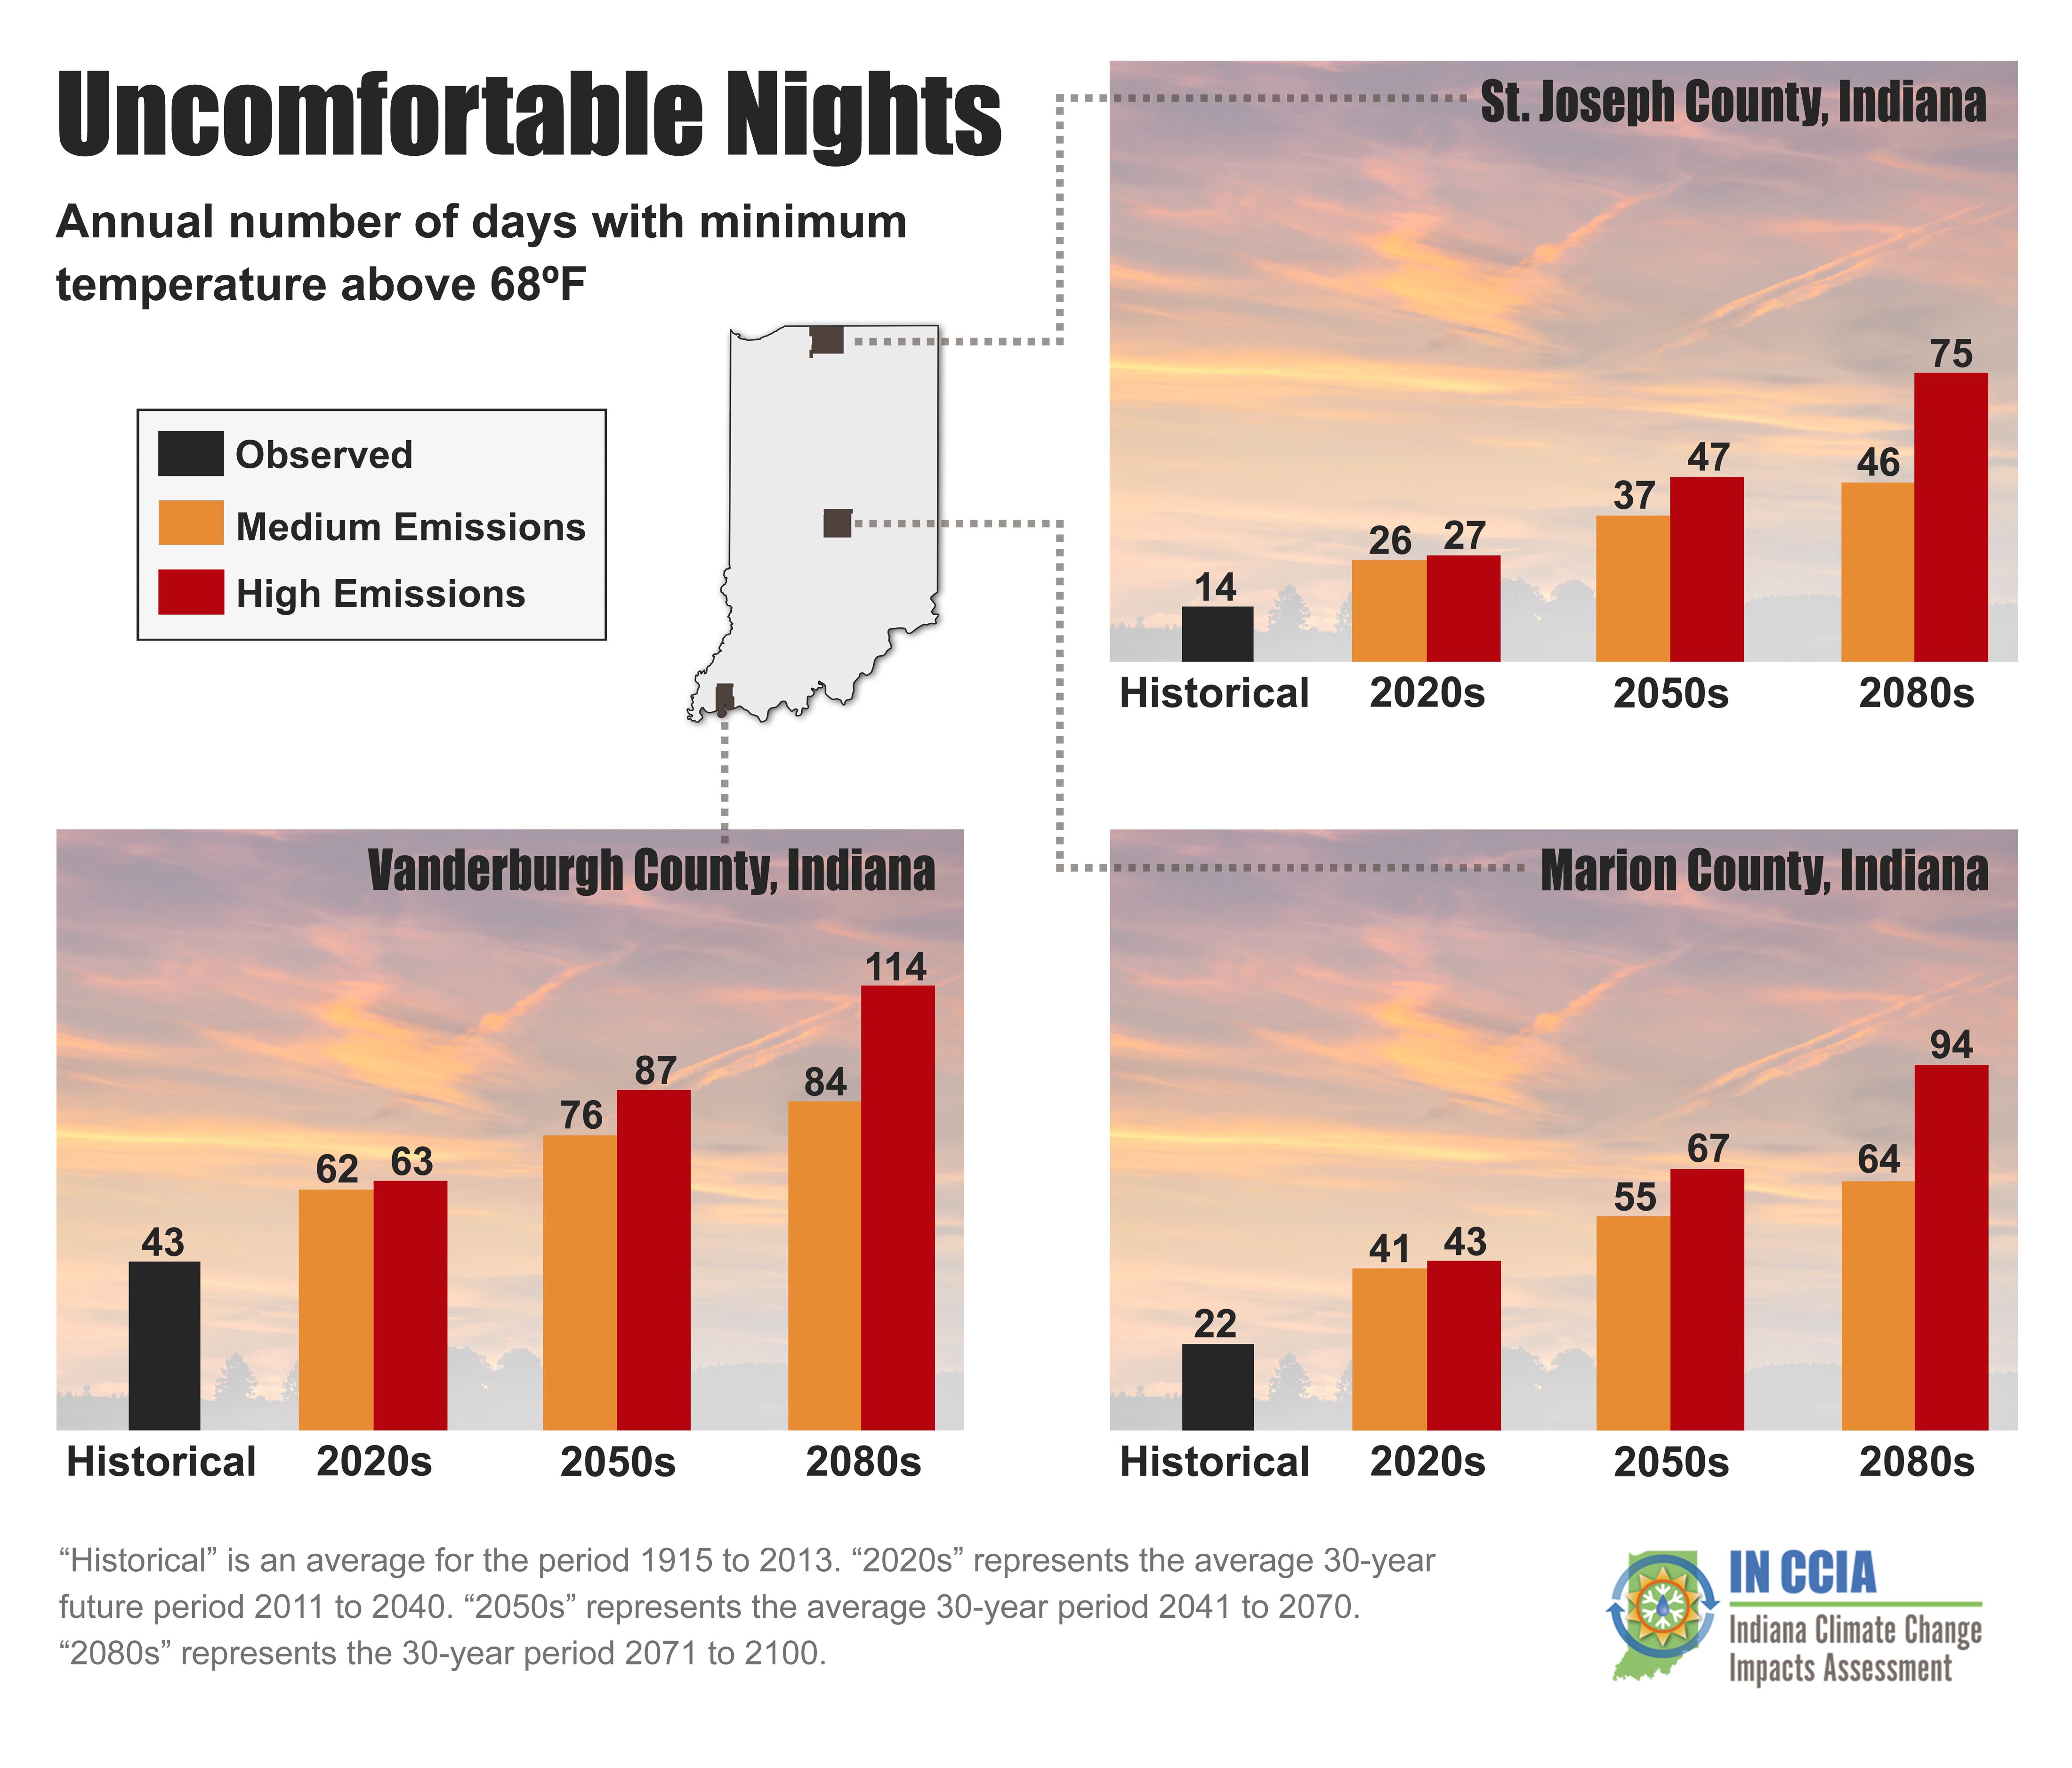
Above: Uncomfortable nights per year for three representative Indiana counties. An uncomfortable night occurs when the daily low temperature is above 68°F. “Historical” is the average for the period from 1915 to 2013. For future projections, “2020s” represents the average 30-year period from 2011 to 2040, “2050s” represents the average from 2041 to 2070, and “2080s” represents the average from 2071 to 2100. Data for other locations available. Source: Hamlet et al. (in review) and Widhalm et al. (2018a).
Extremely hot days and uncomfortably warm nights bring with them serious health risks, especially for vulnerable populations, those who do not have or cannot afford air conditioning, and people who work outside. Some estimates suggest there could be 10,000 to 15,000 more heat-related premature deaths per year in the U.S. by 2050, and a decrease of 8,000 to 9,000 cold-related deaths per year, for a net increase of 2,000 to 6,000 annual deaths (Schwartz et al., 2015). Indianapolis alone is projected to have 43 to 71 net temperature-related deaths per year by 2050, up from 33 per year in 1990, with rising temperatures reducing cold-season deaths and increasing warm-season deaths. For the eleven Indiana cities analyzed by Schwartz et al. (2015)—Elkhart, Evansville, Fort Wayne, Gary, Indianapolis, Lafayette, La Porte, Muncie, Portage, South Bend and Terre Haute—total net temperature-related deaths by 2050 are projected to range from 217 to 338 per year, up from 150 in 1990. And as noted above, while these data are not quantified here, for every premature death caused by hot days and nights there will be multiple morbidity events that require medical care in an emergency room or hospital.
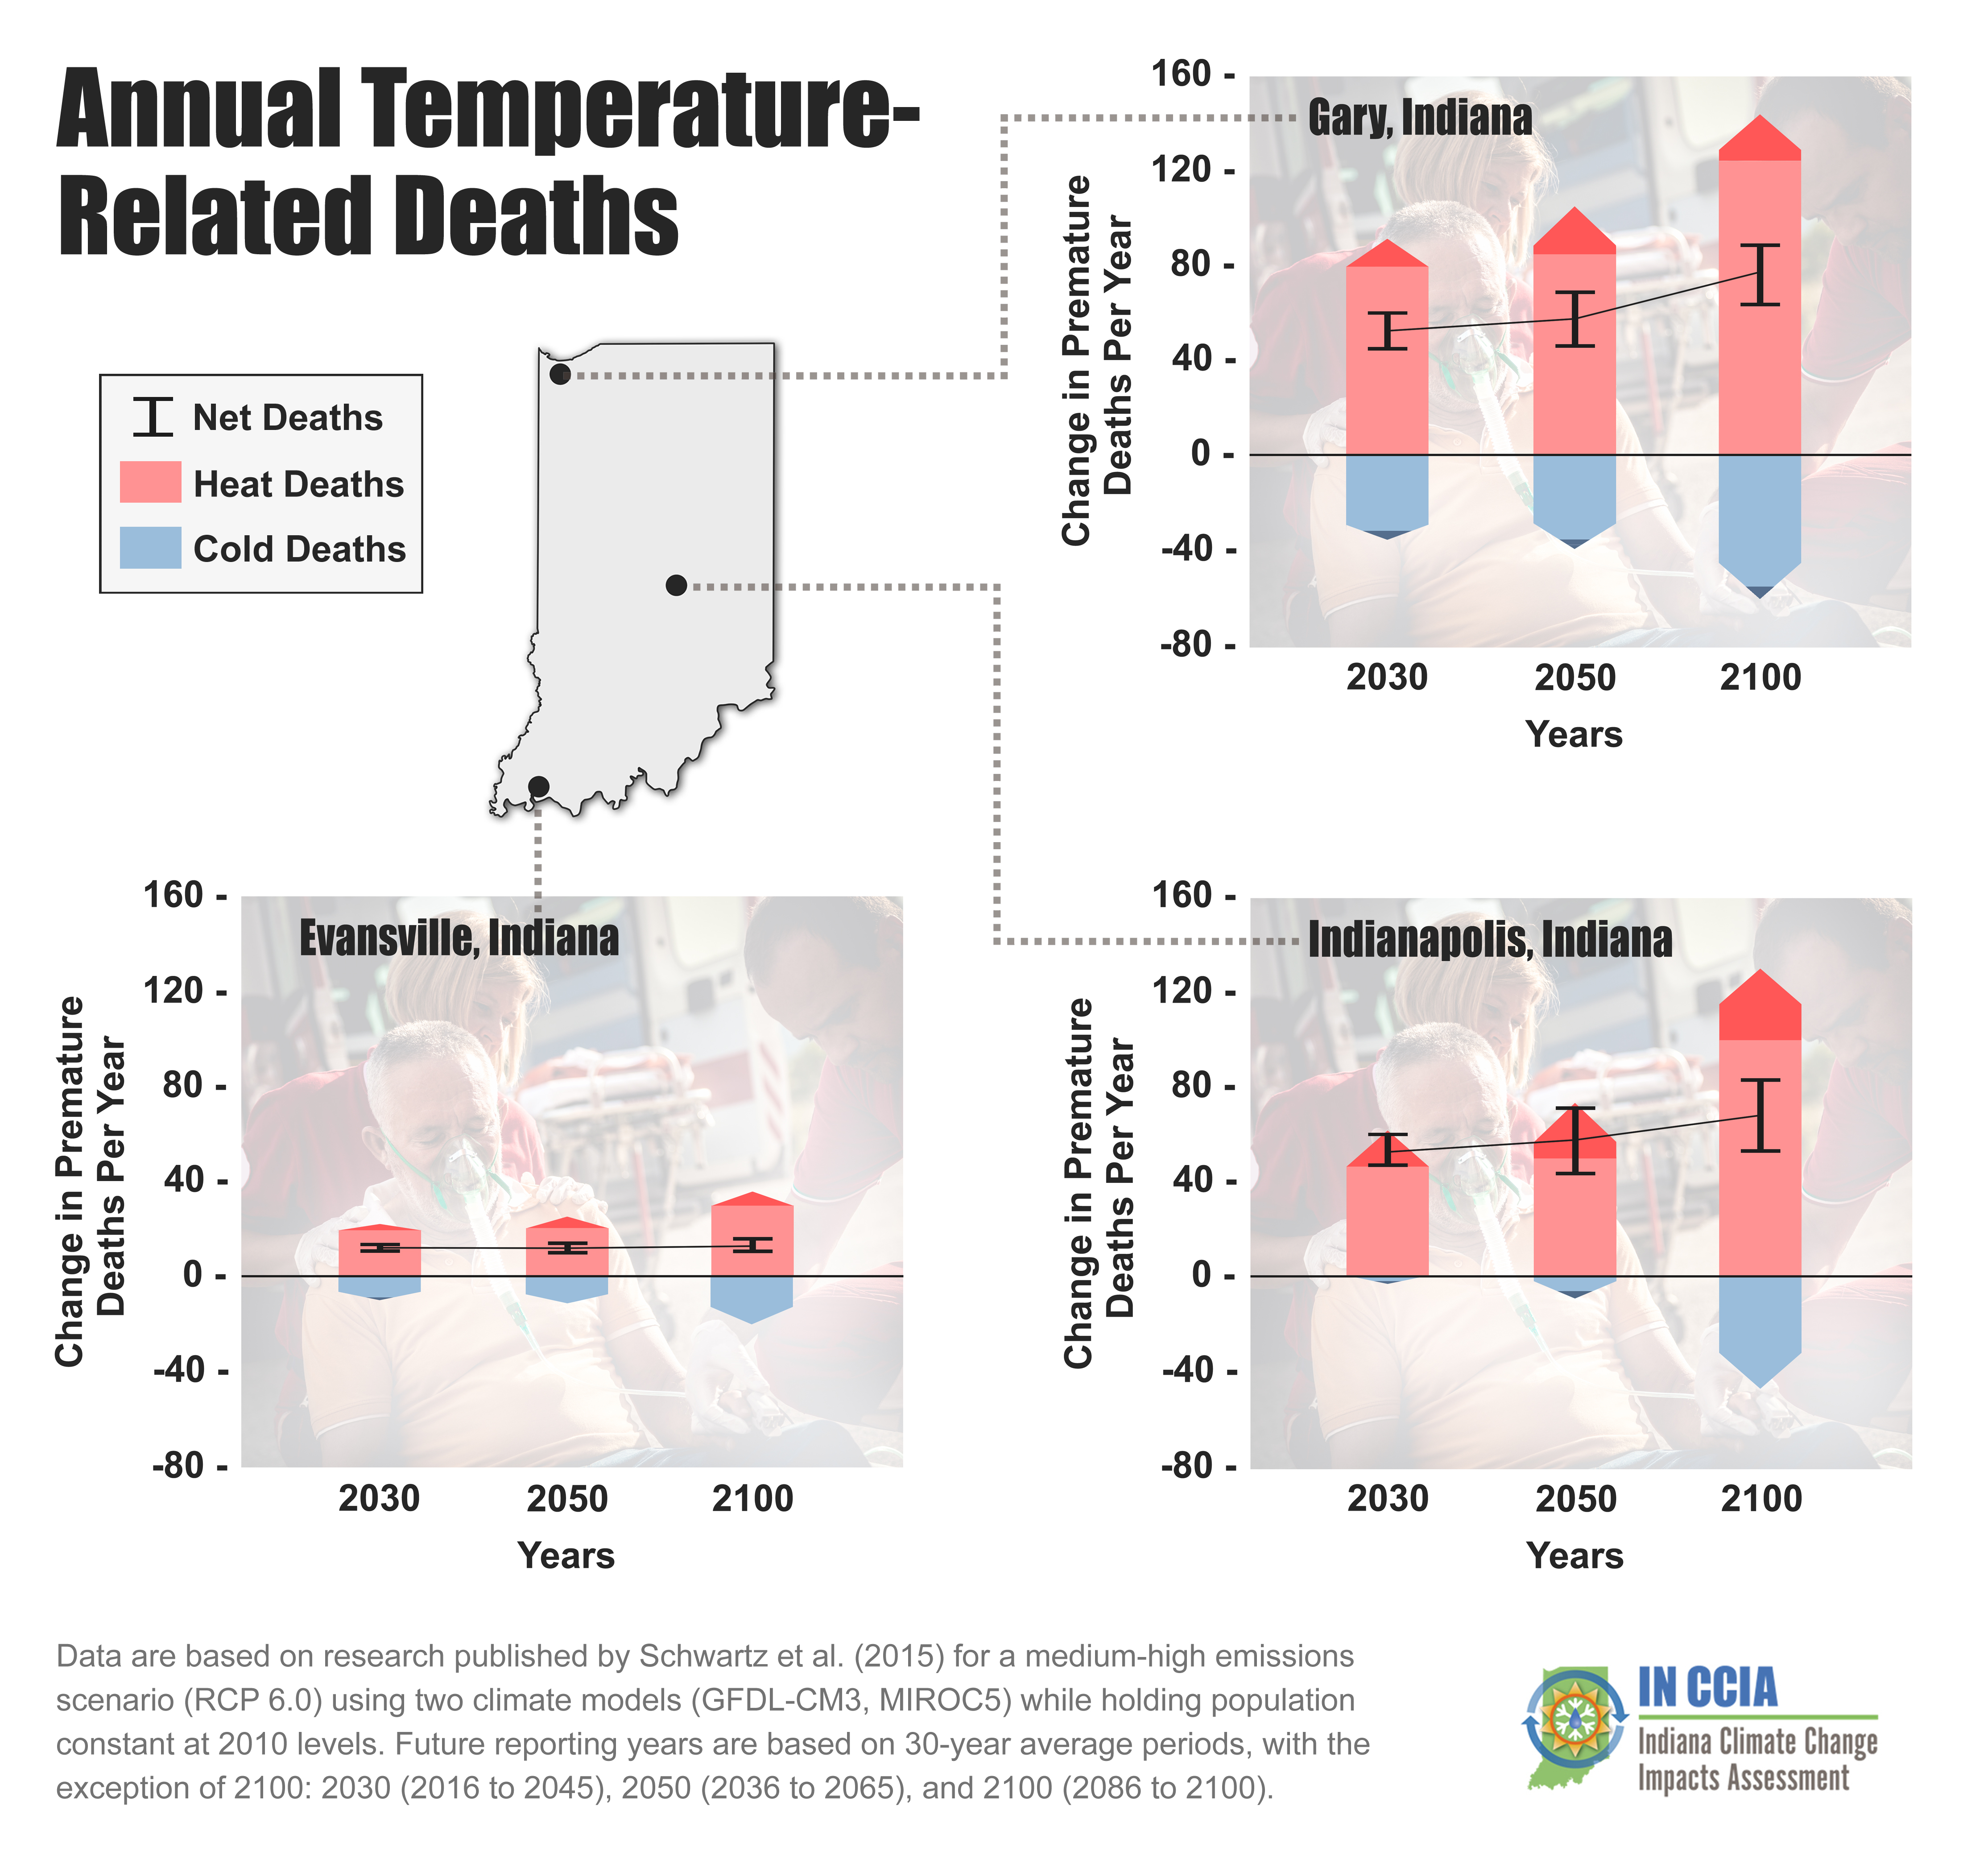
Above: Projected number of premature temperature-related deaths per year for three Indiana cities. Red arrows show warm-season deaths (April to September). Blue arrows show cold-season deaths (October to March). Darker shades on arrow tips depict range of model results. Black bars show range of net annual temperature-related deaths. Data are based on research published by Schwartz et al. (2015) for a medium-high emissions scenario (RCP 6.0) using two climate models while holding population constant at 2010 levels. Future reporting years are based on 30-year average periods, with the exception of 2100, as follows: 2030 (2016 to 2045), 2050 (2036 to 2065), 2100 (2086 to 2100). These results are based on historical relationships between temperature and mortality, which have changed over time. Efforts to help the most vulnerable Hoosiers avoid exposure to dangerous heat and treat heat-related symptoms could reduce or prevent the projected rise in warm-season deaths.
Vulnerable populations
Children and the elderly are at a high risk to suffer from rising temperatures. Children typically spend more time outdoors, exposing them to heat, and their bodies are physiologically more susceptible to the effects of heat than adults’. Indiana’s population of people 65 and older, a demographic with high vulnerability to heat-related illness and death, is growing. In 2015, that age group made up 14.5 percent of the state’s population. By 2050, it will be more than 20 percent. The elderly are likely to have more chronic health issues — such as respiratory conditions, diabetes and cardiovascular diseases — than younger Hoosiers. They also often live alone, have fixed incomes and may lack the support systems to help them cope with extreme heat.
Today, about 35 percent of Hoosiers are low-income, living near or below the poverty line8. Low-income families and individuals are particularly vulnerable to climate change-related health impacts. Low-income neighborhoods are disproportionally sited in locations with higher environmental pollution and with greater exposure to weather extremes (such as being located in or near floodplains or areas with poor drainage). Poor housing quality and overcrowding increase the risk that members of these communities will be temporarily or permanently displaced by an extreme weather event. Low-income communities often lack access to affordable health care, have lower health literacy and are subjected to greater environmental exposures, as well as having fewer resources to recover from the damage caused by an extreme weather event. Many Hoosier families are just one crisis or disaster away from hardship and have limited capacity to cope with climate change.
Rising temperatures also pose serious health risks for those doing physical labor with direct exposure to outdoor temperatures, such as farm workers, construction workers, utility workers and those working in manufacturing. Heat exposure puts employees at risk for heat-related illnesses and can reduce overall productivity as more frequent breaks are required or production may be halted altogether (EPA, 2015). On our current high-emissions path, by 2050 the U.S. is projected to have about $40 billion in lost wages due to extreme heat, increasing to $170 billion in lost wages by 2100. In Indiana, most locations are projected to see about a 1.4 percent to 1.8 percent decline in available outdoor labor hours by 20509.
Heat, Humidity and Health
As Midwesterners, we know that hot, humid weather can be dangerous, and even deadly. Together, heat and humidity make it difficult for the body to keep cool, increasing the risk of heat exhaustion and heat stroke. Dangerous humidity is especially problematic for the very young and elderly, and those people with underlying health conditions. However, even healthy individuals can succumb to heat extremes when the physical limits of the body are pushed too far.
Scientists use what is known as the “wet-bulb temperature”—a combined measure of heat and humidity—to determine risk of heat-related illness. The higher the wet-bulb temperature, which is measured in degrees Fahrenheit (°F), the more difficult it will be to maintain a safe body temperature. Wet-bulb temperatures above 80°F are considered dangerous, and exposure to wet-bulb temperatures above 95°F for more than a few hours is lethal.
In a warming world, dangerous humidity is expected to happen more frequently. Historically10, Indiana has had about 1 to 10 days per year with wet-bulb temperatures between 80°F and 86°F. These conditions are much like the hottest summer months in the most humid parts of the Southern U.S. By mid-century11, we are expected to have about 10 to 30 dangerous days per year, with far southern areas of the state reaching up to 50 days per year.
(Sources: Hsiang et al., 2014; Sherwood and Huber, 2010)
Air Quality
Ozone and fine particulates
Rising temperatures also contribute to worsening air quality by accelerating the creation of ground-level ozone, which may also be accompanied by an increase in particulate matter smaller than 2.5 microns (PM2.5). Those particles are a strong lung irritant, and at high concentrations can trigger asthma attacks, heart attacks and other acute health problems12. Chronic exposure to ozone and PM2.5 causes or aggravates cardiovascular and respiratory illnesses such as asthma, emphysema, chronic obstructive pulmonary disease (COPD), high blood pressure, diabetes and heart failure (Sun et al., 2010). Increases in PM2.5 may be limited by increased pollution controls, but rising temperatures will make the increase in ozone difficult to avoid.
Health Benefits of Cleaner Air
Reducing carbon emissions from power plants can slow the planet’s rate of warming. At the same time, reduced power plant emissions would provide measurable and meaningful benefits to our health, including fewer hospital admissions and premature deaths from air pollution.
One study found that reducing carbon pollution by the amount proposed in the 2014 EPA Clean Power Plan would also eliminate the emission of other pollutants that would otherwise cause 3,500 premature deaths per year in the U.S. and result in 1,000 hospitalizations (Schwartz et al., 2014). Indiana ranks in the top 12 states with the highest potential number of lives saved if emissions were reduced.

Above: With stringent reductions in carbon pollution from power plants, Indiana would see fewer deaths and injuries due to air pollution. Source: Harvard School of Public Health and Schwartz et al. (2014).
Today, about 200,000 premature deaths per year are attributed to fine-particulate air pollution and 10,000 to ozone air pollution across the United States (Caiazzo et al., 2013). And questions remain about the extent to which adverse health effects from air pollution are underestimated in the scientific literature and therefore underestimated in policy decisions.
Increased loss of life due to worsening air quality is highly likely, but estimates differ on how many deaths will occur. One study predicted 4,000 more annual U.S. deaths by 2050 due to increased PM2.5 and another 300 from increased ozone exposure (Tagaris et al., 2009), coming to about 82 and six for Indiana, respectively. Another study suggested PM2.5 and ozone together will lead to 2,000 to 4,000 more deaths per year throughout the country for every 1°C (1.8°F) of warming, or about 42-84 more per year in Indiana (Jacobson 2008).
Still another approach looked at the United States on a county-by-county basis and estimated all deaths tied to ozone exposure during summer months. In Indiana, this comes to between 32 and 130 deaths per year by 2050 (Alexeeff et al., 2016), with the range accounting for uncertainties between ozone and health effects and potential future ozone concentrations under a high-emissions scenario.
It is important to note, again, that climate change-related health outcomes will not impact all Hoosiers evenly. Negative health impacts from worsening air quality will especially affect children because their lungs are still developing. Children also have relatively faster breathing rates, which increase their exposure to air pollutants such as ozone and PM2.5. Adults with chronic, pre-existing health conditions will also face more risk, as will Hoosiers who live in heavy transit corridors or near industrial activity.
Allergens
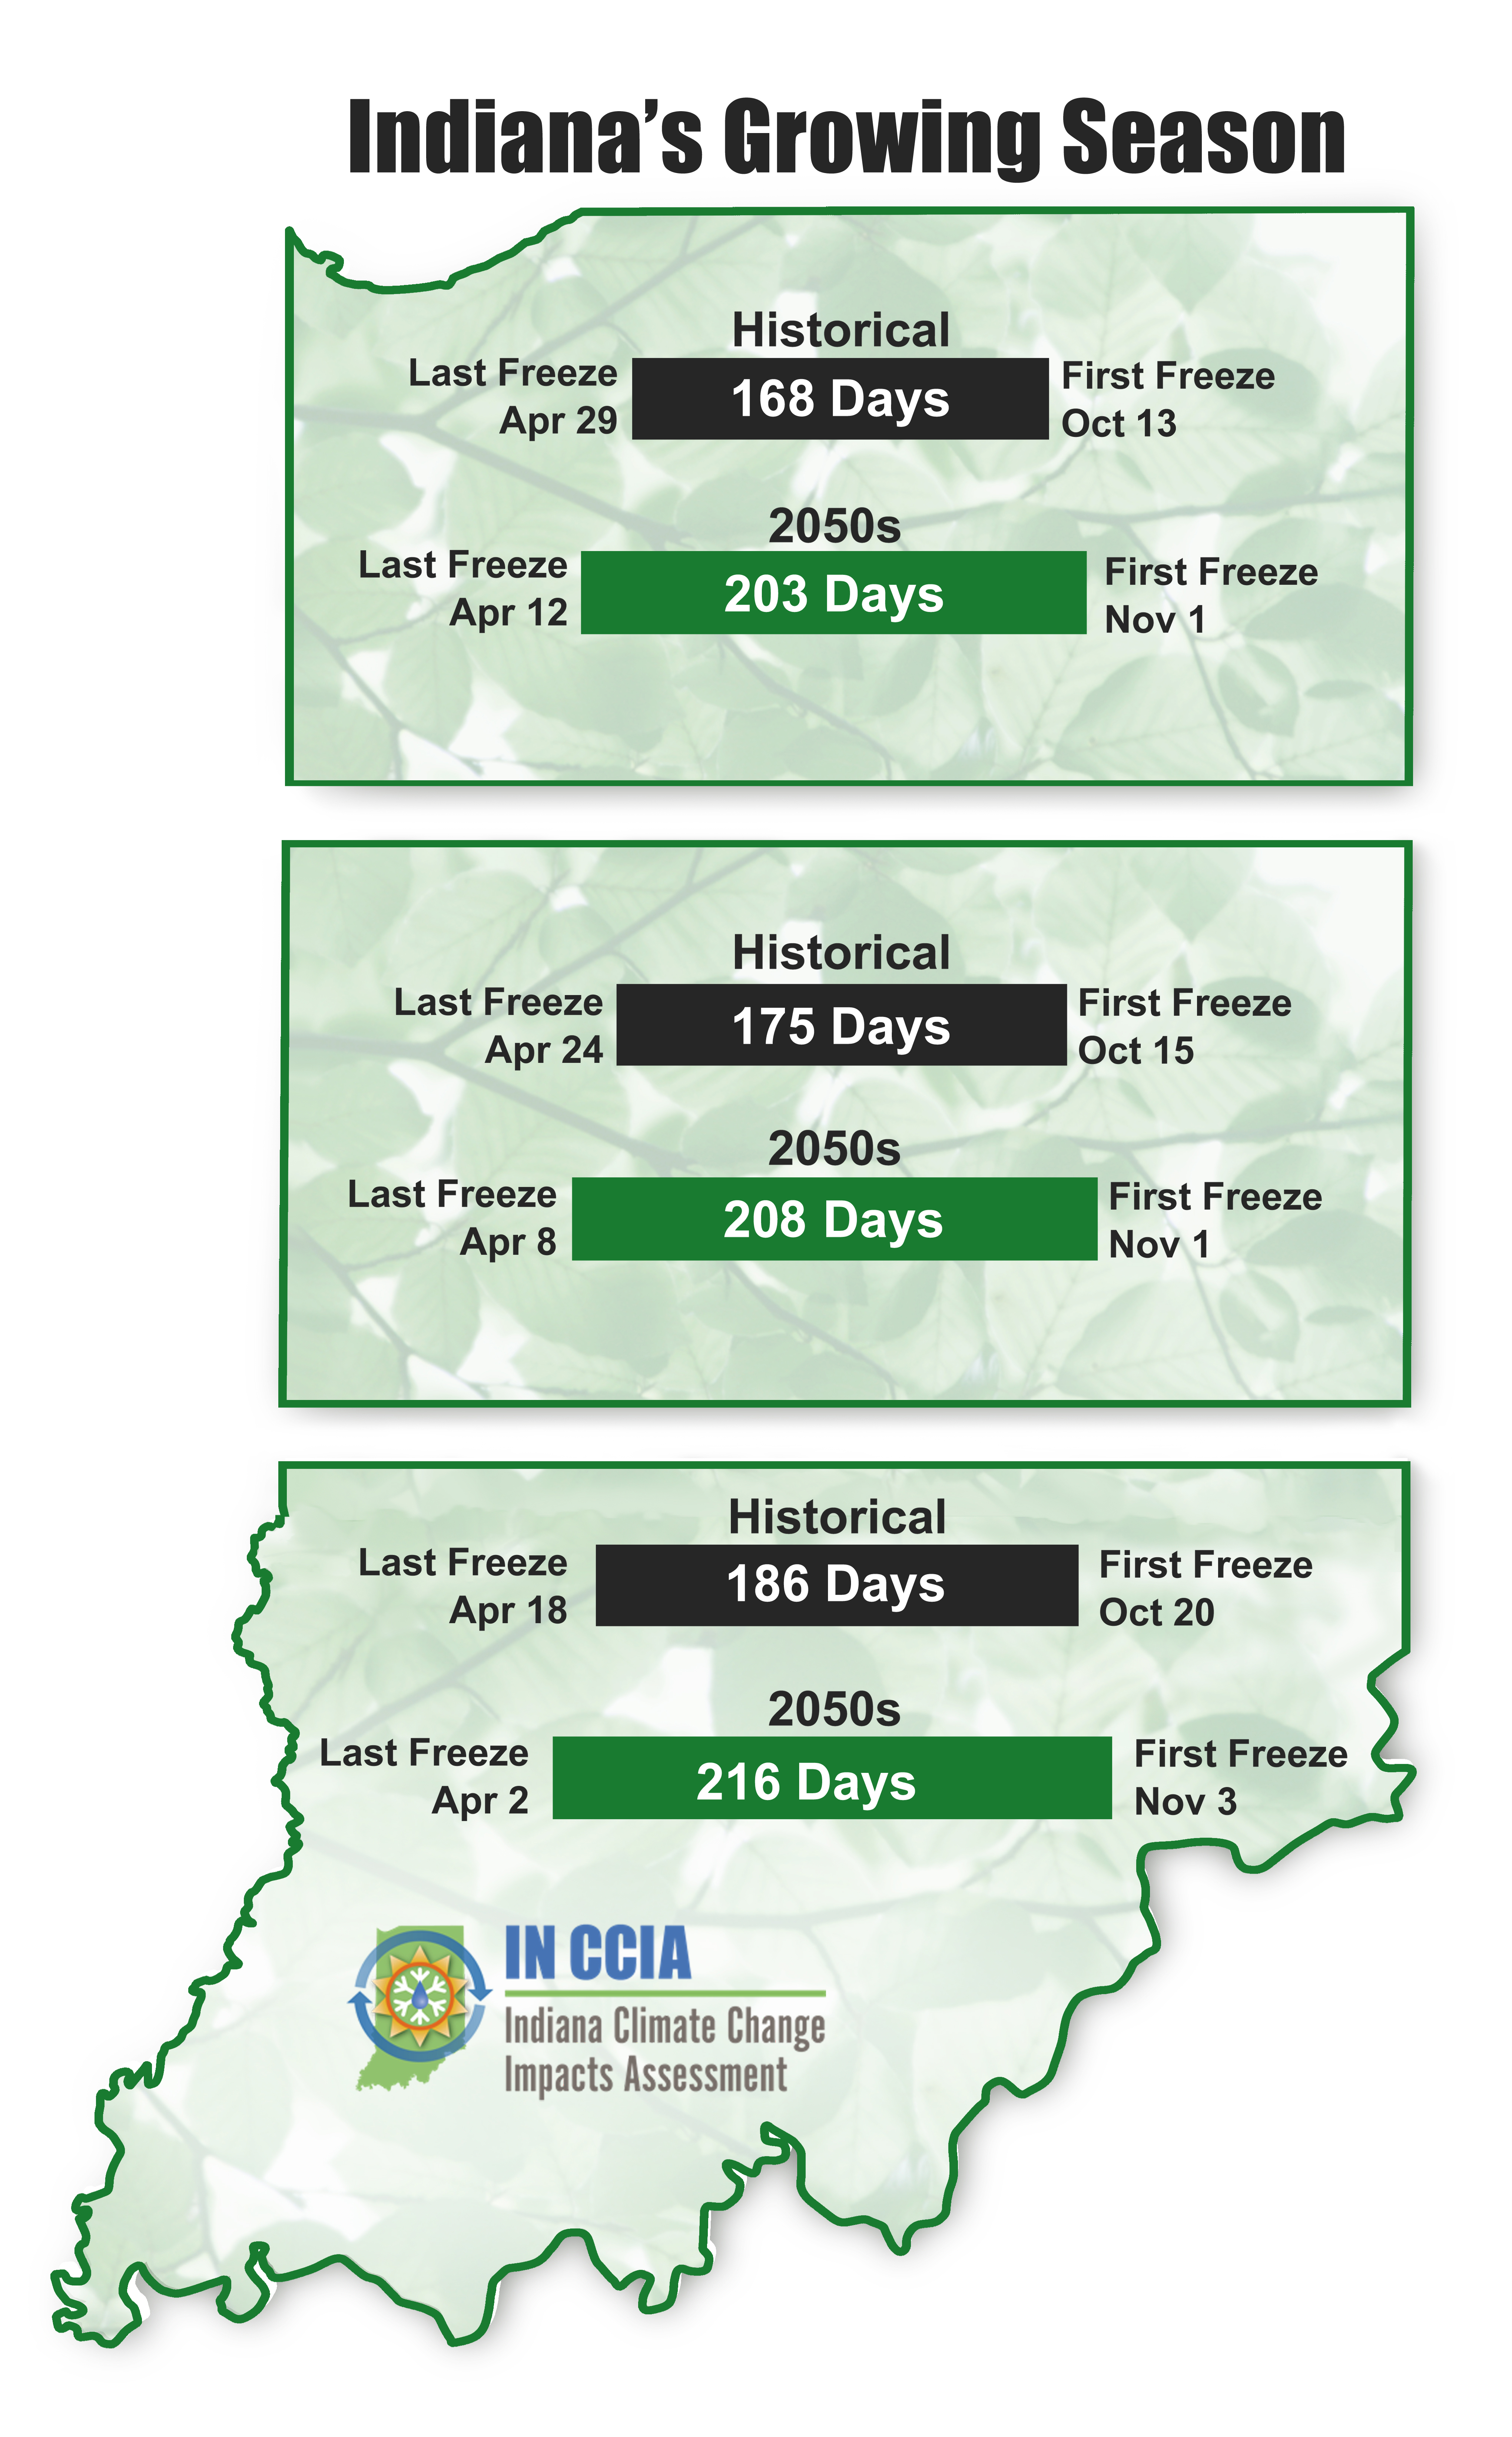
Climate change is extending and amplifying the growing season for plants in Indiana. This is the case not only for crops, but for allergen-producing plants as well. This, too, negatively affects air quality across the state. Indiana’s frost-free season — in which the temperature continuously stays above 32°F — has lengthened by an average of nine days beyond what it was in 1915 (Widhalm et al., 2018b). Eight of those have come in the spring and one in the fall. Under a high-emissions6 scenario, by mid-century2 Indiana’s growing season is projected to lengthen by 35 days, 33 days, and 30 days in the northern, central, and southern areas of the state respectively. This allows allergy-causing plants such as ragweed to produce pollen for longer periods, extending the seasonal allergy season, and to produce more pollen, which can increase the onset, frequency and severity of allergic reactions (Ziska et al., 2011). Pollen is also a trigger for asthma attacks, inflammation, coughing and wheezing (Darrow et al., 2012).

Carbon Dioxide & Plant Growth
Did you know that some plants, like ragweed and poison ivy, thrive with higher concentrations of carbon dioxide (CO2) in the atmosphere? Researchers have found that poison ivy plants, for example, grow faster and produce more toxic oil per plant in high-CO2 environments. Poison ivy toxicity could double by the year 2050 if CO2 emissions continue unabated. Ragweed has also been shown to grow faster, with increased pollen production, when grown in warmer conditions with higher levels of CO2. Grass pollen also grows in abundance as CO2 concentrations rise. With more than 50 million Americans suffering from seasonal allergies, at a cost of $18 billion annually, these changes threaten to reduce the health and well-being of many Hoosiers.
(Sources: Ziska et al. (2007), Ziska and Caulfield (2000), Albertine et al. (2014))
Insect-borne Illnesses
Warmer winter and spring temperatures are expected to change insect-borne disease risks in Indiana. Our state is projected to see fewer days with extremely cold temperatures, which have historically helped control pest populations. Since 1960, Indiana has seen 9 fewer days per year with low temperatures below 5°F (Widhalm et al., 2018b). This trend is projected to continue and intensify. By late century7, Indiana is projected to have substantially fewer extremely cold nights per year. The average lowest temperature of the year – typically experienced late on a cold night in winter – historically4 ranged from about -9°F to -1°F from north to south across Indiana. By mid-century2, this temperature is projected to warm by about 6°F.
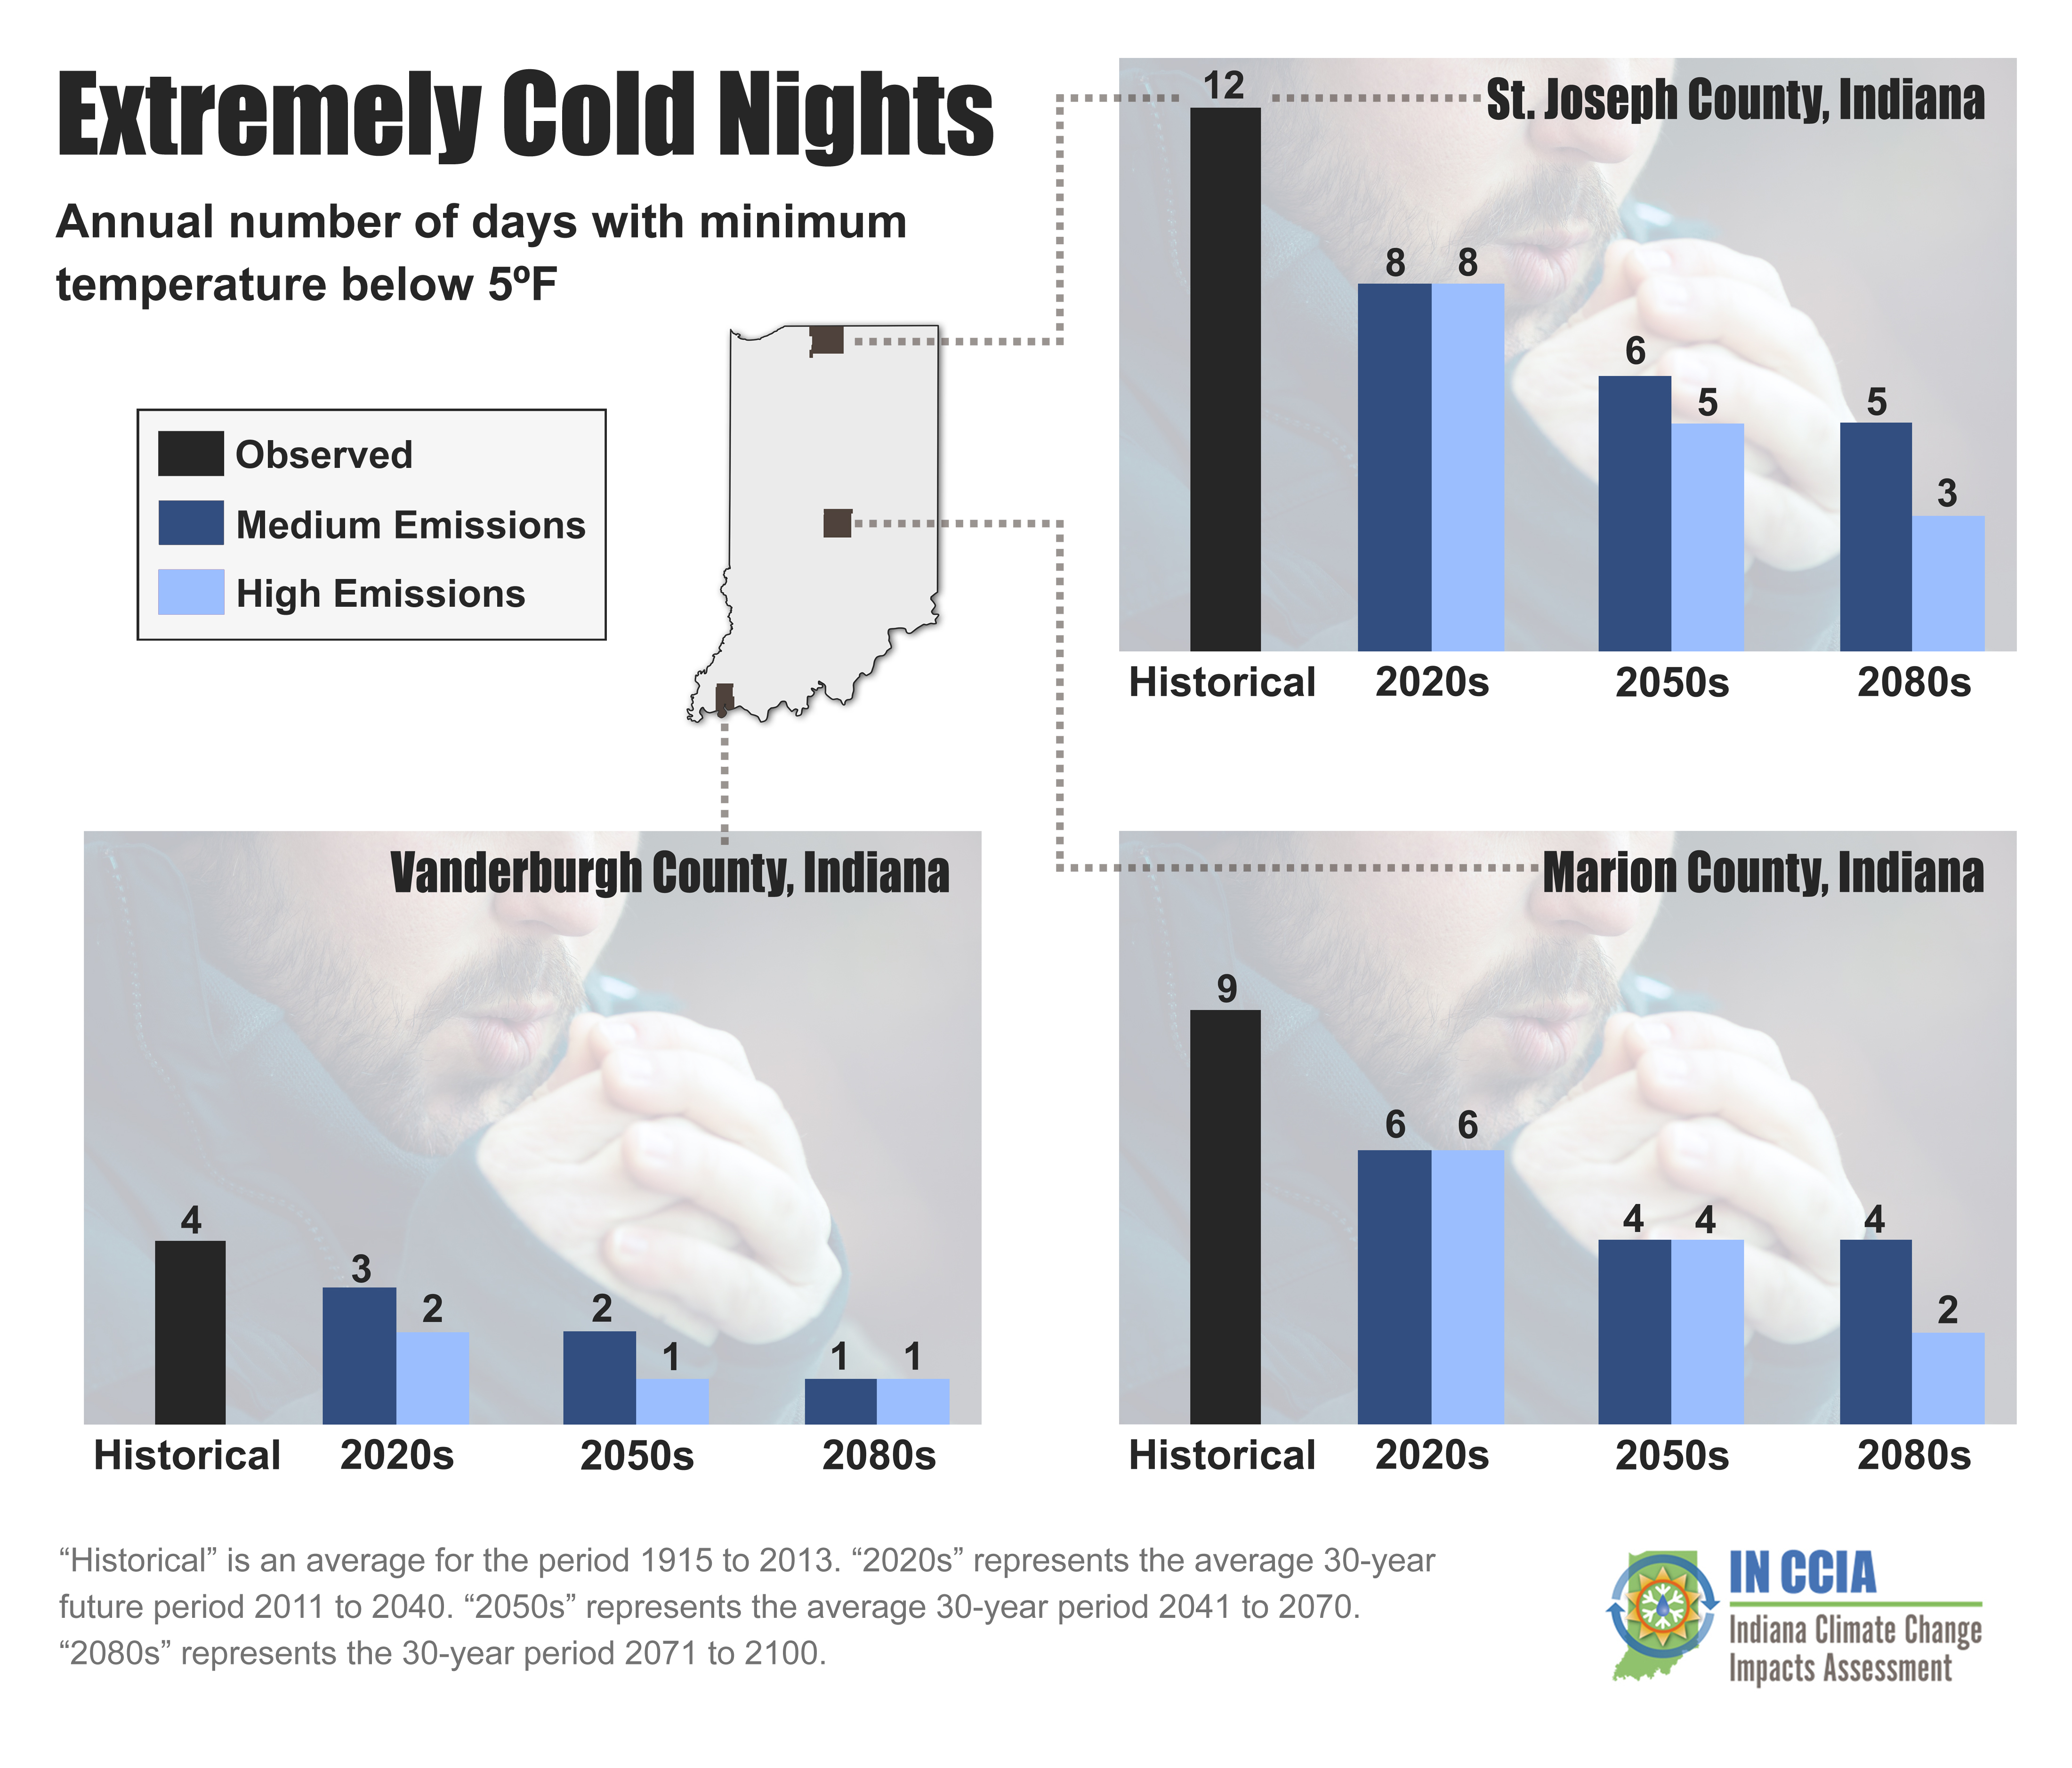
Above: Extremely cold nights per year in three representative Indiana counties. An extremely cold night occurs when the daily low temperature is lower than 5°F. “Historical” is the average for the period from 1915 to 2013. For the future projections, “2020s” represents the average 30-year period from 2011 to 2040, “2050s” represents the average from 2041 to 2070, and “2080s” represents the period from 2071 to 2100. Data for other locations available. Source: Hamlet et al. (in review) and Widhalm et al. (2018a).
These extreme cold events provide a natural control on the number and extent of some species of nuisance pests such as ticks and mosquitoes. As temperatures rise, these pests are better able to survive the winter, increase their populations and expand their ranges. That means without increased attention to the control of these pests, there will be more of them, in more places and for longer periods to transmit diseases such as West Nile virus, Zika virus and Lyme disease.
Traps monitored in Marion County13 already show a 500% increase in the number of mosquitoes from 1981 to 2016, which is consistent with observed changes in temperature and precipitation during this time. Mosquitoes breed in standing water arising from rainfall and flooding. With projections for increased spring rain and temperatures, Indiana should expect larger mosquito populations and more mosquito species expanding their ranges into the state in the future.
The Asian tiger mosquito (Aedes albopictus), introduced to the U.S. in 1987, and the Asian bush mosquito (Aedes japonicus) have already been found in Indiana. These mosquitoes are effective carriers for a number of viruses, including dengue, yellow fever, chikungunya and Zika. An even more effective carrier of these diseases, the yellow fever mosquito (Aedes aegypti), has been moving northward with the warming, wetter climate, and southern Indiana is now within its potential range14.
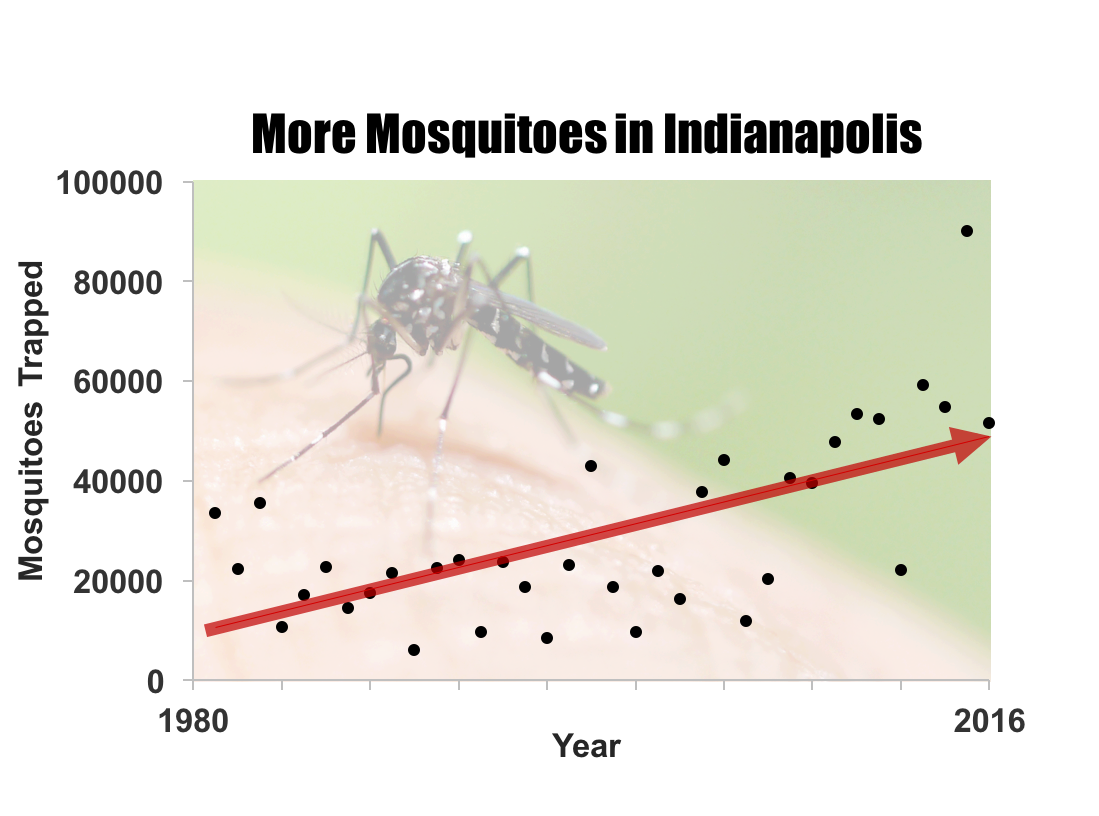
Above: Mosquitoes trapped in 20 light traps in Marion County, Indiana, from 1981 to 2016. Black dots show annual counts. Red line is the linear trend over the period of record. Source: Marion County Public Health Department and Filippelli et al. (in review).
Water-based Problems
In our rivers and lakes, climate change will bring risks from flooding and toxic algae. Over the last century,15 Indiana’s statewide annual rainfall has increased by 5.6”, or about 15 percent. Extreme rainfall events in the Midwest (USGCRP 2017), and specifically in Indiana, have also been happening more frequently (Widhalm et al., 2018b).
Future projections show a continuation of observed trends, with annual rainfall increasing about 6 percent to 8 percent by mid-century and 5 percent to 10 percent by late-century16, and with more frequent heavy downpours.
However, precipitation changes will not be evenly distributed throughout the year. Much of the increase is expected to come in the spring and winter – by mid-century2, the high-emissions6 scenario brings precipitation increases of 16 percent in spring and 20 percent in winter. Summer and fall rainfall projections indicate potentially drier conditions but are less certain compared to other seasons (see Widhalm et al., 2018a) for further details).
Projected Changes in Indiana’s Precipitation
| Scenario | Period | Winter | Spring | Summer | Fall | Annual |
| Medium Emissions | 2050s | 16% | 13% | -2% | -2% | 6% |
| 2080s | 17% | 10% | -3% | -3% | 5% | |
| High Emissions | 2050s | 20% | 16% | -3% | -2% | 8% |
| 2080s | 32% | 17% | -8% | -2% | 10% |
Above: Projected annual and seasonal percent change in precipitation for Indiana compared to the historical period (1971 to 2000). Values represent state-level averages from 10 climate model projections. For the future projections, “2050s” represents the average from 2041 to 2070, and “2080s” represents the period from 2071 to 2100. Source: Hamlet et al. (in review).
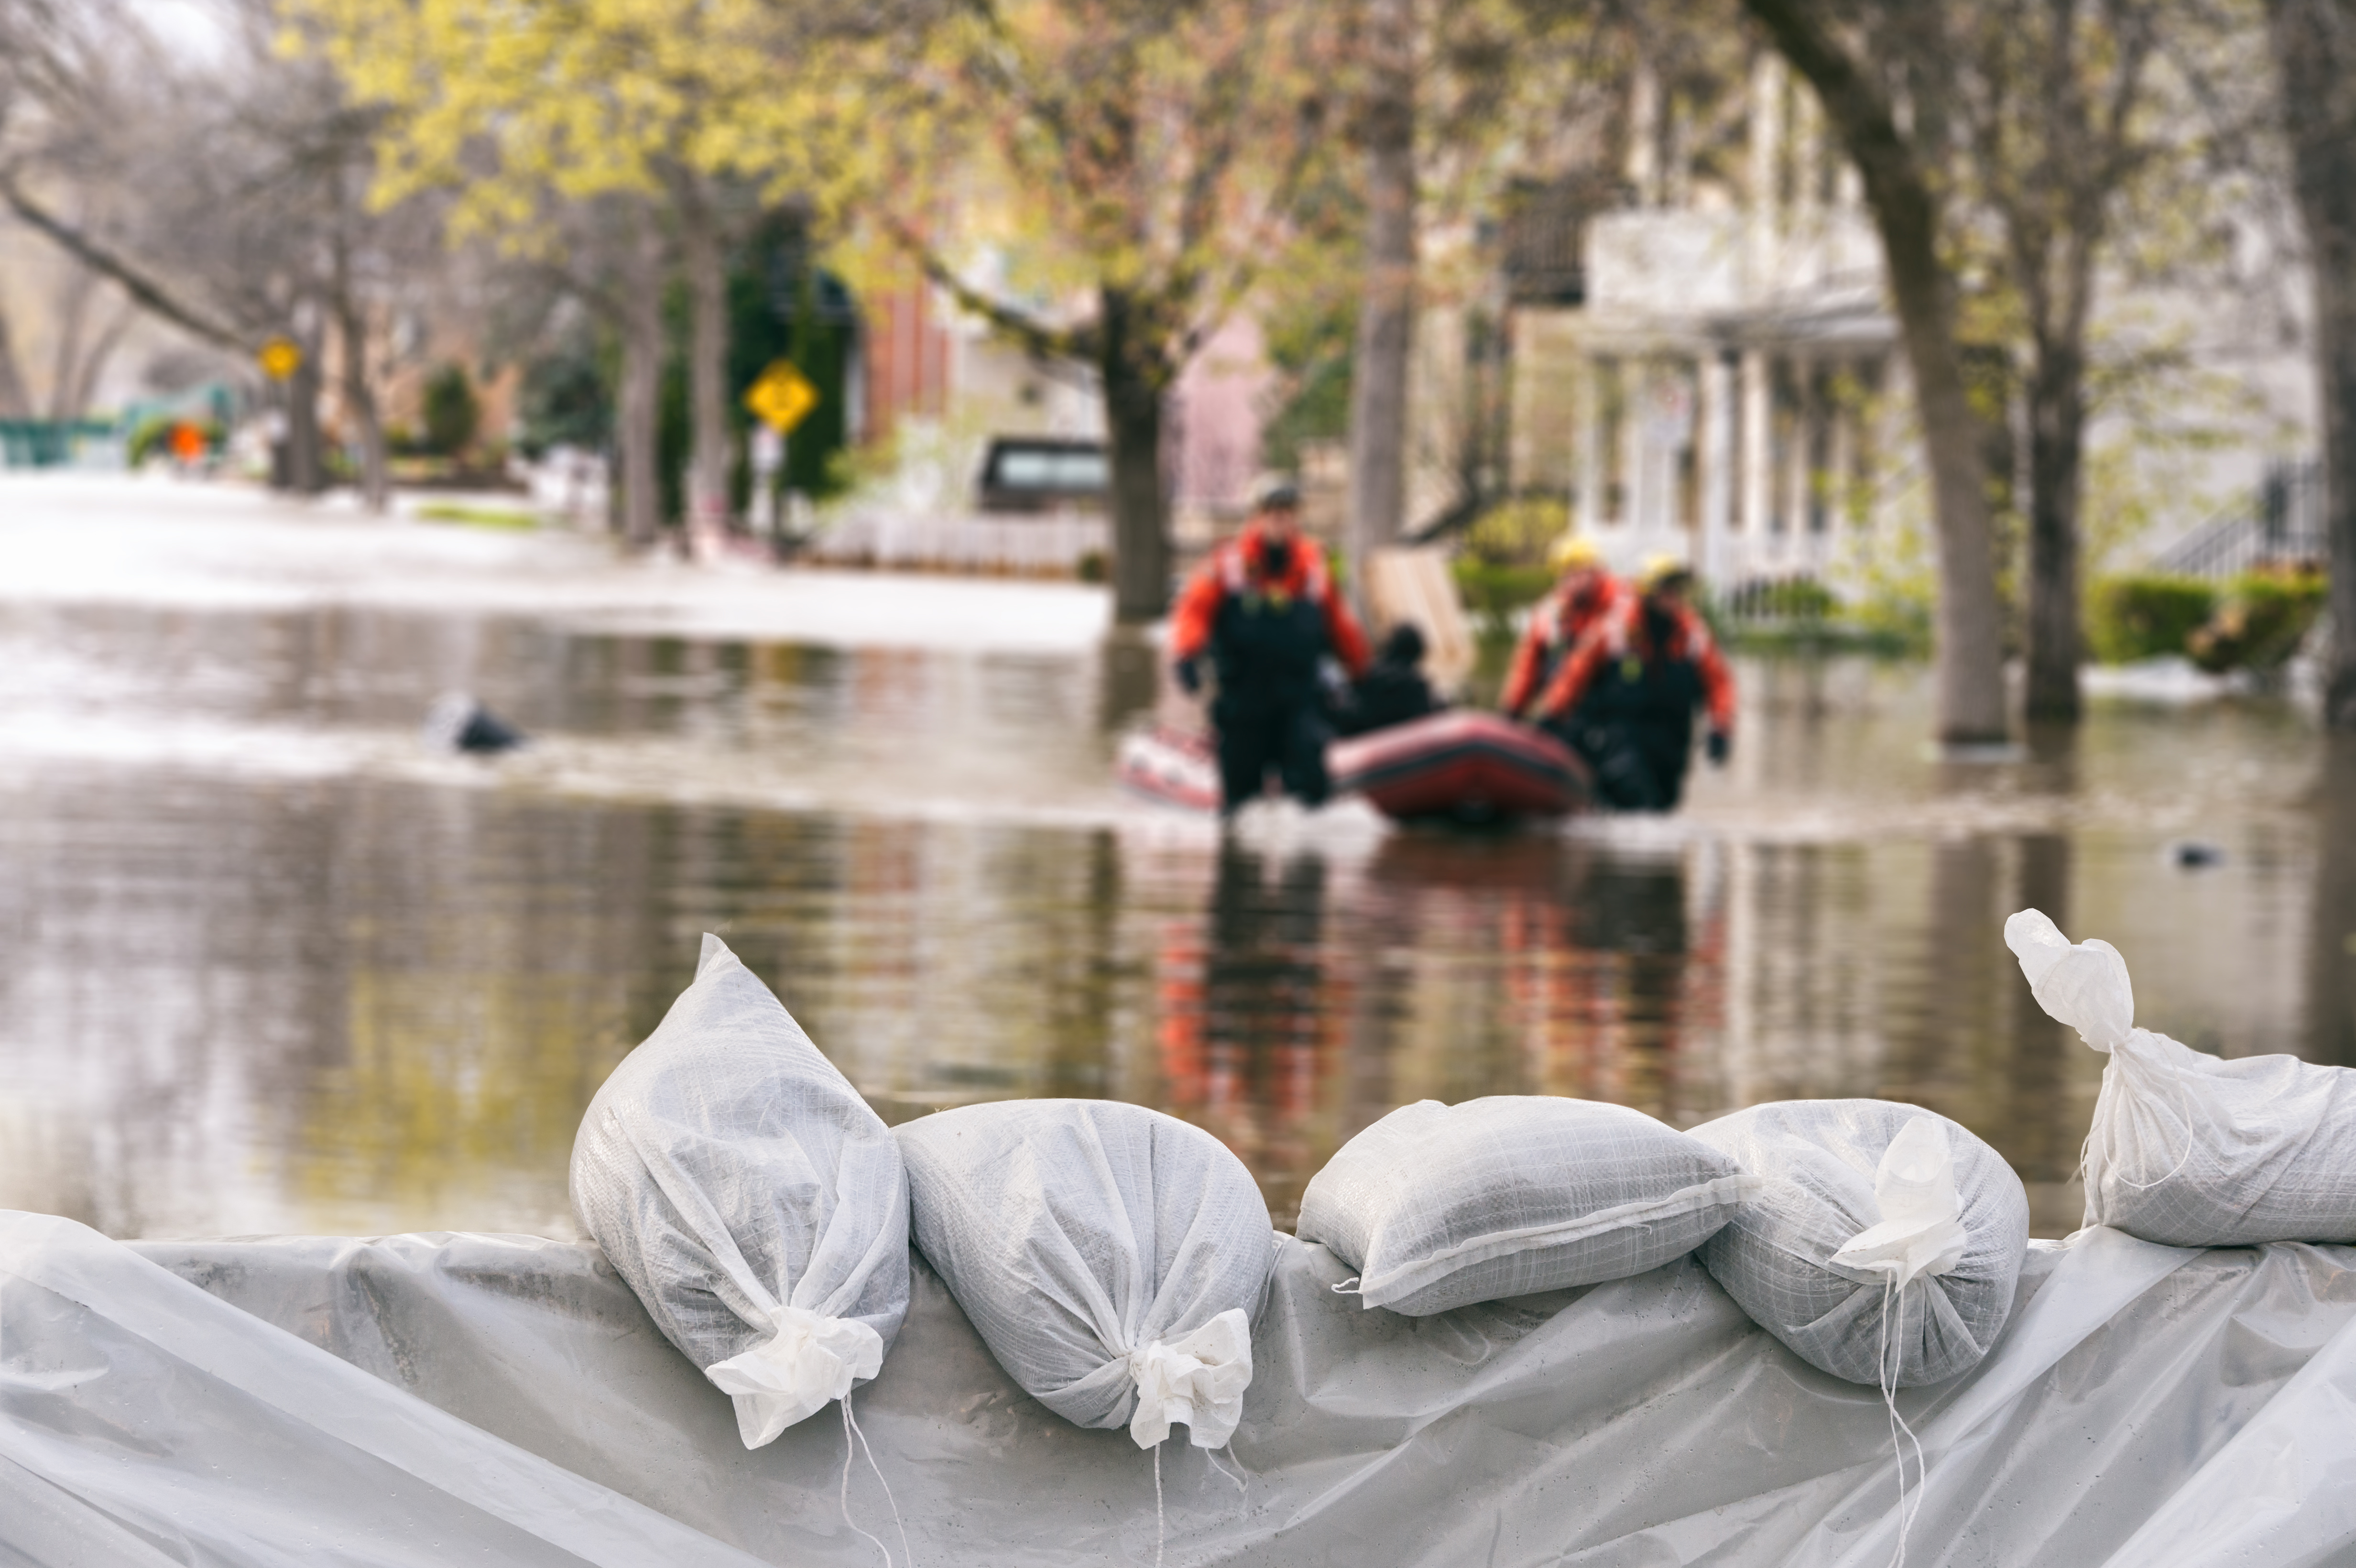 The increased frequency and severity of precipitation, as well as the timing in the spring and winter, considerably increase the risk of flooding, especially in low-lying areas throughout the state. These flood events will be responsible for fatal and non-fatal injuries and waterborne disease. Heavy storms can cause storm drains and sewage pipes to overflow and residential stormwater management systems (e.g., sump pumps) to fail. Contact with stormwater/wastewater has been correlated with increased rates of gastrointestinal illnesses. Dampness in homes, schools and other buildings caused by flooding can increase mold growth and lead to higher rates of asthma and allergies.
Floods also bring other problems that will impact Hoosiers’ health. For instance, the increased rain, along with higher temperatures, is expected to increase the growth of harmful algae, which can lead to dangerous algal blooms. The Indiana Department of Environmental Management has data from Brookville Lake17 from 2012 that show climate-related trends in algae cell counts and harmful algal blooms. Blue-green algae blooms are more likely in warmer water. Nutrients from farm fields, carried by runoff, also contribute to their formation.
The algae forms scum on the surface of water and creates cyanotoxins. These can be ingested through fish caught in the water, by drinking or touching infected water, and even breathing air near the water. Depending on the type of algae, the toxins can cause vomiting, diarrhea, confusion, seizures, liver damage, or even paralysis and death18. This hyper-production of algae can also cause fish kills, leading to negative economic impacts, and can degrade water quality from drinking water sources to such a level that replacement sources need be brought in, at great expense (as happened in Toledo, Ohio, in 2014).
Back to Top
Additional Impacts
Previous sections have discussed several ways in which a changing climate can affect Hoosiers’ health. Those impacts can have additional, downstream consequences such as increased rates of anxiety and depression as a result of trauma during extreme climate events.
Stress is a prime factor in hypertension, a host of cardiopulmonary and other organ diseases, and behavioral health problems such as aggression. Mental health is an increasingly recognized concern following climate change-driven extreme events (heat waves, floods)19. Post-traumatic stress disorder (PTSD) is commonly observed following an extreme weather event: a recent review reported that PTSD can develop among 30 percent to 40 percent of those directly affected, 10 percent to 20 percent of first responders, and among 5 percent to 10 percent of the general population following a disaster (Goldmann and Galea 2014). The frequency of serious mental illnesses (such as anxiety, depression and PTSD) among New Orleans residents was estimated to have doubled following Hurricane Katrina (Kesseler et al 2006). Surveys following Hurricane Sandy also identified increased anxiety, depression and PTSD (Lieberman-Cribbin et al 2017). Although the impacts lessen over time, elevated rates of mental illness are apparent even years later20.
Other projected impacts of climate change have direct or indirect consequences for Hoosiers’ health. These include increases in violent and property crimes, decreases in agricultural yields, and a variety of other societal impacts that are projected to cumulatively harm Indiana’s economy (Hsiang et al. 2017). Increases in poverty can affect individuals’ access to health care, and combined with decreases in agricultural yields (crops and livestock) and rising food prices can exacerbate food insecurity in the state. The overall health impact on individuals will depend on many factors including socioeconomics and demographics, environmental factors and the extent of exposure to hazards.
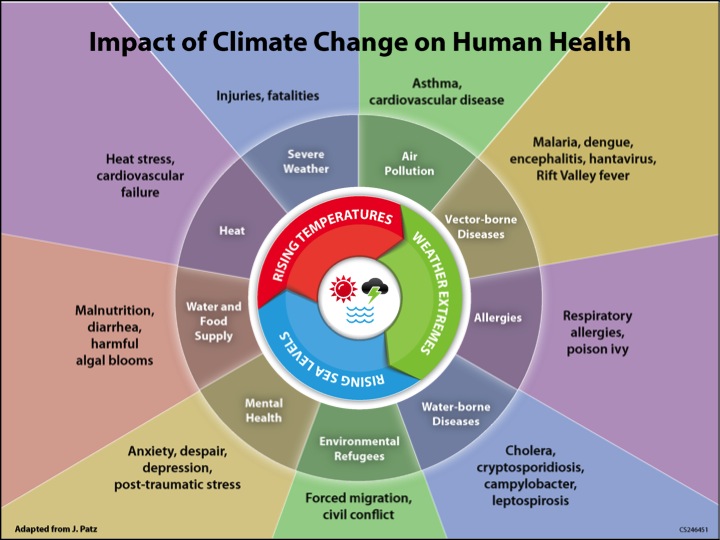
Above: This diagram describes how disruptions in the climate translate to impacts on human health. Source: Monika Dutt, Medical Officer of Health (Cape Breton, Guysborough, Antigonish), adapted from National Center for Environmental Health, Centers for Disease Control and Prevention (CDC).
Key Knowledge Gaps
Several unknowns exist in projecting future health impacts from climate change in Indiana, beyond the fact that different models provide a variety of projections of future temperature and precipitation. Although it is important to take into account the range of possible future climates that is reflected in this report, we must also take into account the range of possible future human behaviors, migration patterns, and interventions. For example:
- Will climate change drive migration away from coastal communities in the United States and elsewhere, and if so, will some migrants settle in Indiana?
- How will future water infrastructure investments change flooding intensity or duration, and thus impact health directly through flood effects or indirectly through standing water and mosquito populations?
- How will changes in technology, affluence, and societal priorities affect the delivery of cooling relief to those vulnerable populations without adequate cooling and with pre-existing conditions?
- How might the ranges of “tropical” diseases carried by host mosquito species, already present in Indiana, extend their reach into Indiana? Will we develop or deploy new technologies to sterilize or otherwise eradicate harmful mosquito populations?
- How quickly might vaccines and anti-viral medications be developed to prevent vector-borne viral diseases like Lyme disease, dengue, avian flu, and malaria?
- Will the effects of climate change elsewhere in the world drive political instability that could cause Hoosiers in the military to be placed in harm’s way?
Conclusions
In recent decades, changes in Indiana’s climate have affected Hoosiers’ health and well-being. This report highlights the growing challenges that we can expect as the trend toward a warmer and wetter climate accelerates. Although some segments of our population face greater threats than others, all Hoosiers will face health risks from these new conditions.
The most severe health outcomes can be avoided by dramatically reducing global emissions of heat-trapping gases, minimizing the amount of future warming. But significant warming is likely even if society makes major efforts to slow climate change. To minimize risks from unavoidable warming, Hoosiers will need to adjust Indiana’s social and physical systems to cope with hotter summers, longer and more intense allergy seasons, increased exposure to tropical pests and heightened flood risks. Close attention must be given to the most vulnerable among us—the very young, the elderly, those with chronic health conditions and low-income households—as they are disproportionately affected by climate change.
The health impacts of climate change can be reduced with short- and long-term planning, and many resources are available to help states, communities and individuals increase their ability to cope with a shifting climate and limit contributions to this worldwide problem. Also, many actions to address climate change have positive and immediate benefits to our health and well-being. Understanding the full scope of health impacts associated with our changing climate is a critical first step in building stronger and more productive communities and families.
References
Albertine , J.M., W.J. Manning, M. DaCosta, K.A. Stinson, M.L. Muilenberg, and C.A. Rogers. (2014). Projected carbon dioxide to increase grass pollen and allergen exposure despite higher ozone levels. PLoS ONE 9: e111712.
Alexeeff, S. E., Pfister, G. G. and D. Nychka. (2016). A Bayesian model for quantifying the change in mortality associated with future ozone exposures under climate change. Biometrics 72: 281-288. doi: 10.1111/biom.12383
Caiazzo F, Ashok A, Waitz IA, Yim SHL, and SRH Barrett. (2013). Air pollution and early deaths in the United States. Part I: Quantifying the impact of major sectors in 2005. Atmos Env. doi: 10.1016/j.atmosenv.2013.05.081
Darrow, L.A., J. Hess, C.A. Rogers, P.E. Tolbert, M. Klien, and SE. Sarnat. (2012). Ambient pollen concentrations and emergency department visits for asthma and wheeze. J Allergy Clin Immunol. 130: 630-638.
EPA. (2015). Climate Change in the United States: Benefits of Global Action. United States Environmental Protection Agency, Office of Atmospheric Programs, EPA 430-R-15-001.
Filippelli, G., Jay, S., Gibson, J., Wells, E., Moreno-Madriñán, M.J., Ogashawara, I., Freeman, J., Rosenthal, F. (in review). The current and future impacts of climate change on human health in Indiana. Climatic Change (Read free at https://rdcu.be/cdhAU)
Goldman, E. and S. Galea. (2014). Mental health consequences of disasters. Annu Rev Public Health 35:169–83.
Hamlet, A., Byun, K., Robeson, S., Widhalm, M., and M. Baldwin. (in review). Impacts of Climate Change on the State of Indiana: Ensemble future projections based on statistical downscaling. Climatic Change. https://doi.org/10.1007/s10584-018-2309-9. (Read for free at https://rdcu.be/cdhzT)
Hsiang, S., R. Kopp, A. Jina, M. Delgado, J. Rising, S. Mohan, R. Muir-Wood, D. J. Rasmussen, M. Mastrandrea, P. Wilson, K. Larsen and T. Houser (2014). American Climate Prospectus: Economic Risks in the United States.
Hsiang, S., Kopp, R., Jina, A., Rising, J., Delgado, M., Mohan, S., Rasmussen, D.J., Muir-Wood, R., Wilson, P., Oppenheimer, M. and K. Larsen. (2017). Estimating economic damage from climate change in the United States. Science 356:1362-1369.
Jacobson, MZ. (2008). On the causal link between carbon dioxide and air pollution mortality. Geophys Res Lett. 35: L03809. doi: 10.1029/2007GL031101
Kessler, R., S. Galea, B.T. Jones, and H.A. Parker. (2006). Mental illness and suicidality after Hurricane Katrina. Bull World Health Organ. 84:930-939. https://bit.ly/2GtIu0v
Lieberman-Cribbin, W., B. Liu, S. Schneider, R. Schwartz, and E. Taioli. (2017). Self-reported and FEMA flood exposure assessment after Hurricane Sandy: Association with mental health outcomes. PLoS ONE 12: e0170965. https://bit.ly/2Iwbwyb
Schwartz, J., J. Buonocore, J. Levy, C. Driscoll, K.F. Lambert, S. Reid. (2014). Health Co-benefits of Carbon Standards for Existing Power Plants. Part 2 of the Co-Benefits of Carbon Standards Study. A report of the Science Policy Exchange. Harvard University, Cambridge, MA; Syracuse University, Syracuse, NY; Boston University, Boston, MA. 34 pages.
Schwartz, J.D., M. Lee, P.L. Kinney, S. Yang, D. Mills, M.C. Sarofim, R. Jones, R., Streeter, A. St. Juliana, J. Peers, and R.M. Horton. (2015). Projections of temperature-attributable premature deaths in 209 U.S. cities using a cluster-based Poisson approach. Environmental Health 14:85. DOI 10.1186/s12940-015-0071-2
Sherwood, S.C. and M. Huber. (2010). An adaptability limit to climate change due to heat stress. Proc Natl Acad Sci. 107 (21) 9552-9555; https://bit.ly/2IxnQ1c
Sun, Q., X. Hong, and L.E. Wold. (2010). Cardiovascular effects of ambient particulate air pollution exposure. Circulation 121: 2755-2765.
Tagaris E, Liao KJ, Delucia AJ, Deck L, Amar P, and AG Russell. (2009). Potential impact of climate change on air pollution-related human health effects. Environ Sci Technol. 43: 4979-4968. doi: 10.1021/es803650w
USGCRP. (2017). Climate Science Special Report: Fourth National Climate Assessment, Volume I. Wuebbles, D.J., D.W. Fahey, K.A. Hibbard, D.J. Dokken, B.C. Stewart, and T.K. Maycock, eds. U.S. Global Change Research Program, Washington, DC, USA, 470 pages.
Widhalm, M., Hamlet, A. Byun, K., Robeson, S., Baldwin, M., Staten, P., Chiu, C., Coleman, J., Hall, B., Hoogewind, K., Huber, M., Kieu, C., Yoo, J., and J.S. Dukes. (2018a). Indiana’s Past & Future Climate: A Report from the Indiana Climate Change Impacts Assessment. Purdue Climate Change Research Center, Purdue University. West Lafayette, Indiana. DOI: 10.5703/1288284316634
Widhalm, M., Robeson, S., Hall, B., Baldwin, M., and J. Coleman. (2018b). Indiana’s Climate Trends: A Resource for the Indiana Climate Change Impacts Assessment. Purdue Climate Change Research Center, Purdue University, West Lafayette, Indiana. DOI: 10.5703/1288284316635
Ziska, L.H. and F.A. Caulfield. (2000). Rising CO2 and pollen production of common ragweed (Ambrosia artemisiifolia), a known allergy-inducing species: implications for public health. Aust J Plant Physiol. 27: 893-898.
Ziska, L., Knowlton, K., Rogers, C., Dalan, D., Tierney, N., Elder, M.A., Filley, W., Shropshire, J., Ford, L.B., Hedberg, C. and Fleetwood, P., et al. (2011). Recent warming by latitude associated with increased length of ragweed pollen season in central North America. Proc Natl Acad Sci. 108: 4248-4251.
Ziska, L.H., R.C.Sicher, K.George, and J.E. Mohan. (2007). Rising atmospheric carbon dioxide and potential impacts on the growth and toxicity of poison ivy (Toxicodendron radicans). Weed Science 55: 288-292. https://bit.ly/2GusaMN
How to Cite
Filippelli, G.M., Widhalm, M., Filley, R., Comer, K., Ejeta, G., Field, W., Freeman, J., Gibson, J., Jay, S., Johnson, D., Mattes, R., Moreno-Madriñán, M.J., Ogashawara, I., Prather, J., Rosenthal, F., Smirat, J., Wang, Y., Wells, E., and J.S. Dukes. 2018. Hoosiers’ Health in a Changing Climate: A Report from the Indiana Climate Change Impacts Assessment. Purdue Climate Change Research Center, Purdue University. West Lafayette, Indiana. https://bit.ly/2IvumFC
IN CCIA Health Working Group:
- Gabriel Filippelli, Indiana University-Purdue University Indianapolis (IUPUI), lead
- Karen Comer, IUPUI
- Gebisa Ejeta, Purdue University
- William Field, Purdue University
- Jennifer Freeman, Purdue University
- Joseph Gibson, Marion County Public Health Department
- Stephen Jay, IUPUI
- Daniel Johnson, IUPUI
- Max Jacobo Moreno-Madriñán, IUPUI
- Richard Mattes, Purdue University
- Igor Ogashawara, IUPUI
- Jeremy Prather, Mesh Coalition
- Frank Rosenthal, Purdue University
- Jeries Smirat, IUPUI
- Yi Wang, IUPUI
- Ellen Wells, Purdue University
Acknowledgements
We thank Brian Wallheimer for drafting this report, Stan Coffman for assistance with graphics, and staff from Purdue University’s Department of Agricultural Communication, including Maureen Manier, Darrin Pack, Erin Robinson, Kenny Wilson, Andrew Banta, Joan Crow and Russell Merzdorf for help with the production and release of the report. We also thank Purdue University Libraries Scholarly Publishing Division, specifically Nina Collins and Marcia Wilhelm-South, for providing online publication support for all documents associated with the IN CCIA.
Footnotes
1 Average 30-year period from 2036 to 2065. See Schwartz et al. (2015) for additional details.
2 Average 30-year period from 2041 to 2070. See Widhalm et al. (2018a) for additional details.
3 Projected change in temperature averaged across 10 climate models for two scenarios of heat-trapping gas emissions. The “medium” emissions scenario (RCP 4.5) is the lower bound of the temperature range and the “high” emissions scenario (RCP 8.5) is the upper bound of the temperature range. The high-emissions scenario represents our current trajectory. Mid-century refers to the 30-year period from 2041 to 2070. Late century refers to the 30-year period from 2071 to 2100. Future temperature changes are relative to the statewide annual average temperature from 1971 to 2000. Further details provided in Widhalm et al. (2018a).
4 Average from the period 1915 to 2013.
5 The “medium” emissions scenario uses Representative Concentration Pathway (RCP) 4.5, which has been used to develop many previous projections summarized by the Intergovernmental Panel on Climate Change. To achieve the medium scenario, global greenhouse gas emissions must be significantly reduced almost immediately and peak in the 2040s before declining.
6 The “high” emissions scenario uses Representative Concentration Pathway (RCP) 8.5, which has been used to develop many previous projections summarized by the Intergovernmental Panel on Climate Change. The high scenario represents our current trajectory. Under the high scenario, global greenhouse gas emissions continue to increase until late this century.
7 Average 30-year period from 2071 to 2100. See Widhalm et al. (2018a) for additional details.
8 Poverty information comes from the Indiana Institute for Working Families https://bit.ly/2IxpX58.
9 Climate change and labor statistics are from EPA 2015. Percent change in labor is relative to hours worked in 2005. Labor losses are for high-risk industries (farm labor, construction, manufacturing, etc.). Additional details available at https://www.epa.gov/cira/climate-action-benefits-labor.
10 Average from the period 1981 to 2010. See Hsiang et al. (2014) for additional details.
11 Average for the period 2040 to 2059. See Hsiang et al. (2014) for additional details.
12 Other impacts of PM2.5 exposure include ischemic heart disease, cerebrovascular disease (strokes), chronic obstructive pulmonary disease, lung cancer and lower respiratory infections (pneumonia). Recent research shows that ambient PM2.5 was the fifth-ranking mortality risk factor in 2015 https://bit.ly/2wT1Hcq.
13 Data from Marion County Public Health Department, Mosquito Control Program
14 Mosquito range information from the Centers for Disease Control and Prevention https://bit.ly/2wJpu97.
15 Average from the period 1895 to 2016.
16 Projected change in precipitation averaged across 10 climate models for two scenarios of heat-trapping gas emissions. The “medium” emissions scenario (RCP 4.5) is the lower bound of the precipitation range and the “high” emissions scenario is the upper bound of the precipitation range. The high-emissions scenario indicates our current trajectory. Mid-century refers to the 30-year period from 2041 to 2070. Late century refers to the 30-year period from 2071 to 2100. Further details provided in Widhalm et al. (2018a).
17 https://www.in.gov/idem/algae/
18 More detailed information about the impacts of human exposure to cyanobacteria is available from the U.S. EPA at https://www.epa.gov/nutrient-policy-data/health-and-ecological-effects.
19 The American Psychiatric Association position statement “How Climate-Related Natural Disasters Affect Mental Health” https://www.psychiatry.org/patients-families/climate-change-and-mental-health-connections/affects-on-mental-health
20 See https://go.nature.com/2k9I3jc and https://bit.ly/2KzSuaH