Maintaining Indiana’s Urban Green Spaces: A Report from the Indiana Climate Change Impacts Assessment
Protecting the benefits of nature in cities
Cities use green infrastructure, including forests, community gardens, lawns and prairies, to improve the quality of life for residents, promote sustainability and mitigate the effects of climate change. These and other kinds of green spaces can decrease energy consumption, increase carbon storage and improve water quality, among other benefits.
More than 70 percent of Hoosiers reside in urban settings, and green infrastructure can provide significant economic advantages. In Indianapolis, for example, urban forests provide a $10 million annual benefit through stormwater control, carbon sequestration, energy reduction and air pollution filtration.
However, just like human-built infrastructure, urban green infrastructure will be subject to the impacts of a changing climate, and its management must be considered as Indiana gets warmer and precipitation patterns change. This report from the Indiana Climate Change Impacts Assessment (IN CCIA) applies climate projections for the state to explore the potential threats to urban green infrastructure, and considers potential management implications and opportunities. The findings presented here are primarily based on the IN CCIA Urban Green Infrastructure Working Group technical report (Reynolds et al., in review) and the IN CCIA report Indiana’s Past and Future Climate (Widhalm et al., 2018a).
the takeaway
- Key finding: Urban green infrastructure—including forests, green roofs, community gardens, and native plantings—provides economic, environmental and health benefits to cities in Indiana. The importance of maintaining green infrastructure to support those benefits will likely increase in a changing climate.
- Key finding: Maples are among the most commonly planted street trees in Indiana. Many of them could experience negative effects from a warming climate. By late-century, habitat suitability for black maple and sugar maple is projected to decline in Indiana. Silver and red maples, conversely, are likely to have no change or increased habitat suitability.
- Key finding: Warming temperatures are expected to increase heat stress on urban plants and may result in additional pressure from pests and diseases. Plant heat stress days—with temperatures reaching above 86°F—in central Indiana are projected to increase by 6.5 to 8 weeks by mid-century1. Elevated temperatures within urban areas (urban "heat islands") may further exacerbate the impacts of climate change.
- Key Finding: Projected increases in rainfall volume and intensity by mid- and late-century may result in added soil erosion and are expected to increase stress on Indiana’s green drainage infrastructure, which could lead to degradation and loss of function.
- Key finding: A warmer, longer growing season with higher levels of atmospheric carbon dioxide (CO2) may promote tree growth and carbon storage in Indiana’s urban green spaces. However, excessive heat stress may lead to carbon storage reductions in trees and increased CO2 emissions from soil. Damage from extreme weather events to trees, and reduced snow cover on lawns can also lead to carbon losses.
- Key finding: Just as for human-built "gray infrastructure," proactive planning for climate change involves anticipating potential impacts to green infrastructure, such as increased stormwater and heat stress, and adjusting management strategies. Communities may consider managing for key characteristics of resilient ecosystems (e.g. biodiversity, redundancy) and/or adopting strategies to deal with a specific aspect of climate change (e.g. shifting species compositions, building soil water holding capacity).
- Key finding: Climate change may present opportunities to promote urban green infrastructure. Unlike human-built "gray infrastructure," green infrastructure can be conducive to grassroots stewardship and governance, and has the potential to relieve climate change-related strains on municipal budgets.
Benefits of Urban Green Infrastructure
Urban green spaces offer economic, environmental and health benefits to Indiana cities and their residents.
Trees can significantly affect a city’s microclimate by providing shade, evaporative cooling and windbreaks. In Indiana, urban trees save about $157 million annually in residential electrical and heating costs, and they help avoid 1.3 million tons of carbon dioxide emissions annually (Nowak et al., 2017).
Urban trees play an essential role in urban air quality, too. It was estimated that Indiana’s urban trees removed 8,400 tons of air pollution in 2010, at a value of $63 million. Tree canopy loss due to climate-related stressors can reduce the ability of urban trees to filter the air.
Urban trees and other vegetation increase the amount of porous ground that can take up rain and melting snow and keep water from overburdening storm sewers. It’s estimated that urban trees provide about $24 million in stormwater management benefits to the state annually. Riparian buffers, bioswales, rain gardens and other green drainage infrastructure can also retain or redirect precipitation that would otherwise travel over impervious surfaces to storm drains.
Urban trees and green spaces also provide opportunities for recreation, relaxation and social engagement, supporting physical and mental health as well as community building.
Green roofs–roofs adapted to allow for growth of plants–are an underutilized method of stormwater retention. They also lengthen the life of a roof, decrease heating and cooling costs for the building, reduce noise and air pollution, and provide habitat for pollinators.
Many wildlife species benefit from urban green spaces. Woody species such as oaks, poplars, maples, blueberries and spruces support caterpillars, and urban forests can provide important “stopover” habitat for migrating birds. Prairie plantings of all sizes, including curbside plantings and small “pocket prairies,” can attract pollinators and native birds.
Compared to the turfgrass species used for lawns, prairie vegetation can capture and absorb more runoff. It also requires less fossil fuel, water and fertilizers than traditional lawns and landscaping, which reduces environmental impacts and saves money.
Urban farm plots, including community gardens, orchards and rooftop gardens offer the opportunity to grow fresh fruits and vegetables. They also reduce the amount of shipping necessary to deliver food to consumers, potentially reducing a city’s carbon footprint (the amount of CO2 emitted from using fossil fuels like coal and oil).
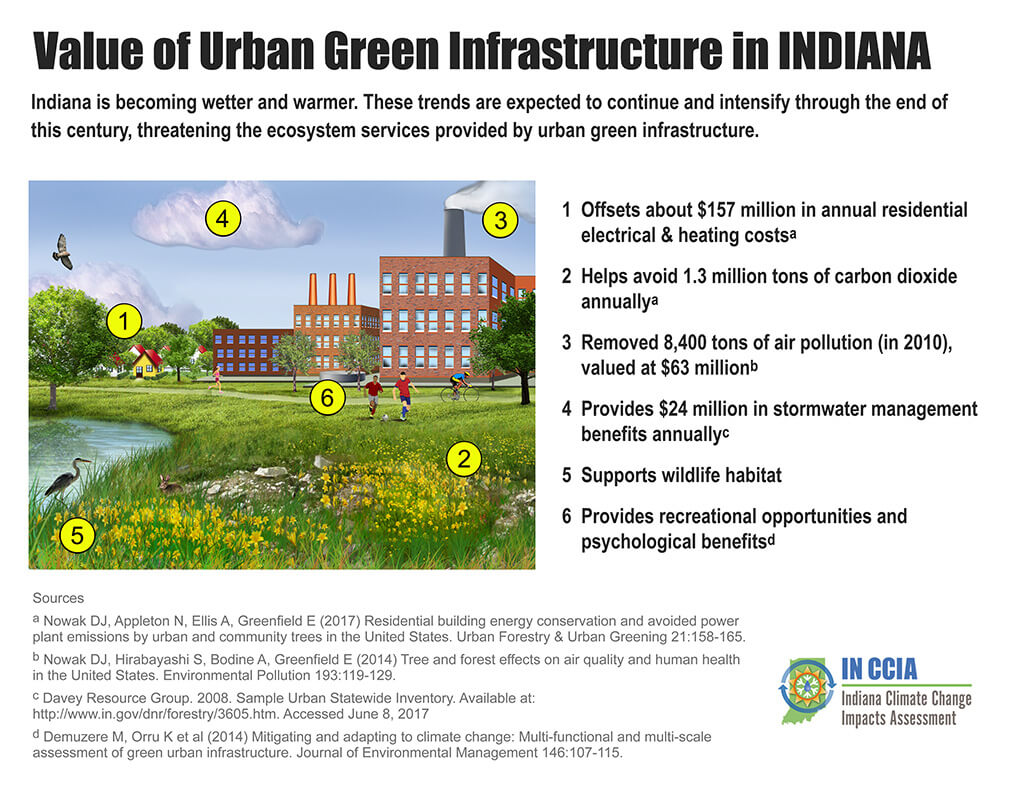
Above: A summary of community and personal benefits of urban green infrastructure in the state of Indiana.
Our Changing Climate
Observations show that over the last century Indiana’s climate has become warmer and wetter (Widhalm et al., 2018a). These trends are projected to continue with warmer, wetter winters and springs along with hotter, drier summers. The state’s annual average temperature is expected to rise 5 to 6°F by mid-century and 6 to 10°F by the end of this century, depending on the amount of heat-trapping gases we put into the atmosphere2. In southern Indiana, the daily high temperature is projected to exceed 95°F for 50 to 89 days per year by the end of this century3, with localized areas exceeding 100 days per year. For comparison, the southern third of the state historically4 averages about seven extremely hot days per year. Projected temperature increases will likely be even greater in urban areas due to the urban heat island effect, whereby building materials and heat sources cause cities to hold and generate more heat. Statewide, precipitation is projected to increase by about 17 percent in spring and 32 percent in winter by late century, with less of that moisture coming as snow5. Rain in the summer may decline; an average across climate models suggests a drop of about 7 percent5, but model projections for this period vary.
Carbon Storage and Urban Trees
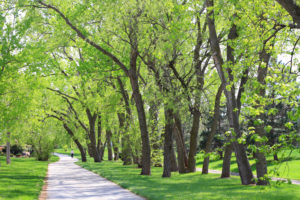 Trees, including those found in urban landscapes, take up carbon dioxide (CO2) through photosynthesis and convert it to organic form. Some of this organic carbon is stored in roots, leaves, and trunks, or ultimately in soil. Such biological carbon sequestration offsets some of the CO2 emissions from human activities, such as burning coal and oil. In the U.S., forests are estimated to offset about 10 to 20 percent of U.S. emissions annually. Urban trees in Indiana specifically are estimated to store about 9.7 million tons of carbon at a rate of 0.25 kilograms per square meter per year (kg m-2 y-1).
Increased atmospheric CO2 may improve young trees’ abilities to store carbon at a faster rate. Warmer temperatures also lead to more growth in trees, which could further promote carbon uptake. However, extreme heat can stress trees–damaging their ability to store carbon–and lead to more CO2 loss from soils. More frequent and/or intense precipitation could also damage or kill trees, leading to carbon loss. Scientists are still working to fully understand the combined effects of these gains and losses in carbon storage.
Sources: Phillips et al. (2018), Nowak et al. (2013) and the U.S. Forest Service
Responses of Urban Trees
Rising temperatures and changes in precipitation patterns may reduce growth of some urban tree species. They may also bring with them increased pressures from insects and diseases.
Maple trees, which are commonly planted in urban areas, are projected to see changes in future habitat suitability depending on the species and location6. For instance, silver maple and red maple trees are well suited for Indiana’s projected climate by century’s end. However, black maple and sugar maple are expected to decline.
Suitability of habitat for northern red oak, white oak and shagbark hickory growing in forests outside of cities is marginally threatened by projected climate changes, but these trees may be at greater risk in cities where they are exposed to more stormwater runoff, road salt, air pollution and restricted growing conditions next to streets and buildings.
A wide variety of tree and other plant species currently found to Indiana’s south may be better suited to the state’s future climate conditions, as the limitations of winter cold diminish. Incorporating these species into urban green infrastructure may offset some of the risks due to reductions in habitat suitability for Indiana’s native plants.
Model projections for non-native tree species, routinely planted along streets and in yards, are unavailable, so it’s unclear how some of these trees will fare in the future. Japanese tree lilac and littleleaf linden, commonly planted along streets, are adapted up to the American Horticultural Society’s heat zone 7, which has 61 to 90 days above 86°F each year. By mid-century7, much of central and southern Indiana could be considered heat zone 8 (91 to 120 days per year above 86°F) or zone 9 (121 to 150 days per year above 86°F), potentially making conditions less favorable for those trees in the future.
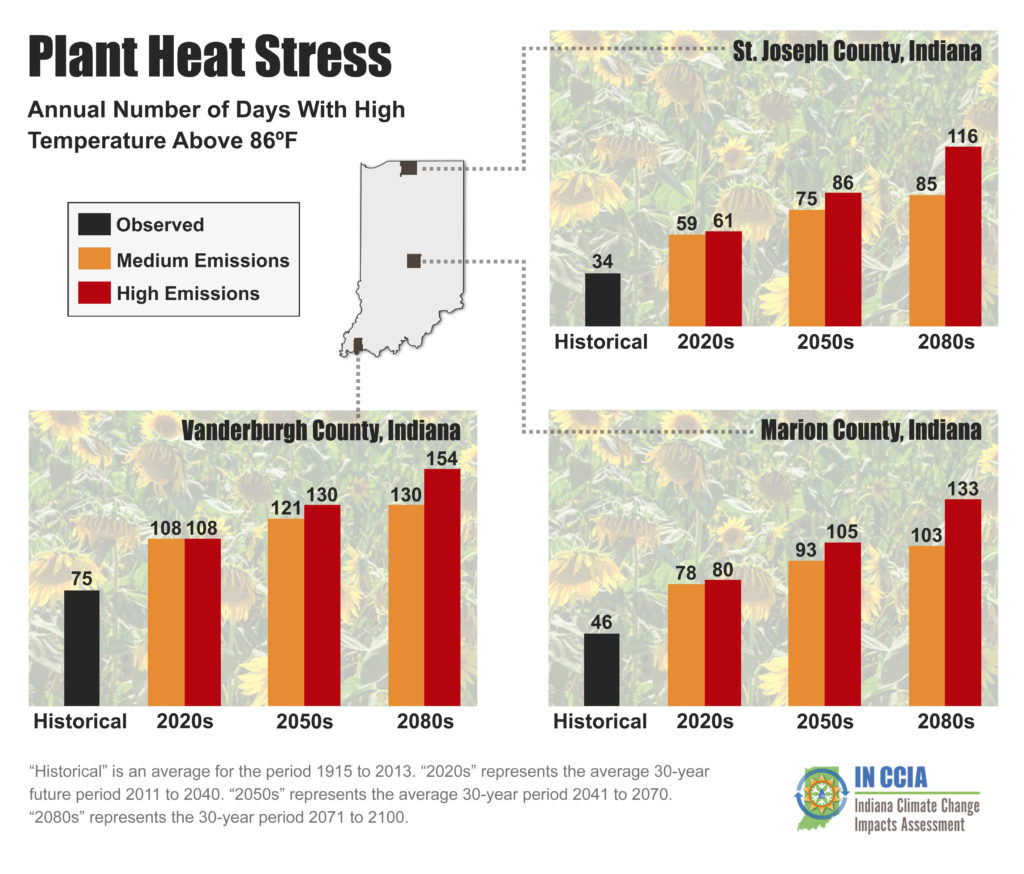
Above: Annual number of days per year with temperatures exceeding 86°F for three representative Indiana counties. “Historical” is the average for the period from 1915 to 2013. For future projections, “2020s” represents the average 30-year period from 2011 to 2040, “2050s” represents the average from 2041 to 2070, and “2080s” represents the average from 2071 to 2100. The American Horticulture Society classifies heat zones into 12 categories based on the number of days per year with temperatures above 86°F: Zone 1 (less than 1 day), Zone 2 (1 to 7 days), Zone 3 (8 to 14 days), Zone 4 (15 to 30 days), Zone 5 (31 to 45 days), Zone 6 (46 to 60 days), Zone 7 (61 to 90 days), Zone 8 (91 to 120 days), Zone 9 (121 to 150 days), Zone 10 (151 to 180 days), Zone 11 (181 to 210 days), Zone 12 (more than 211 days). Sources: Widhalm et al. (2018a) and The American Horticulture Society.
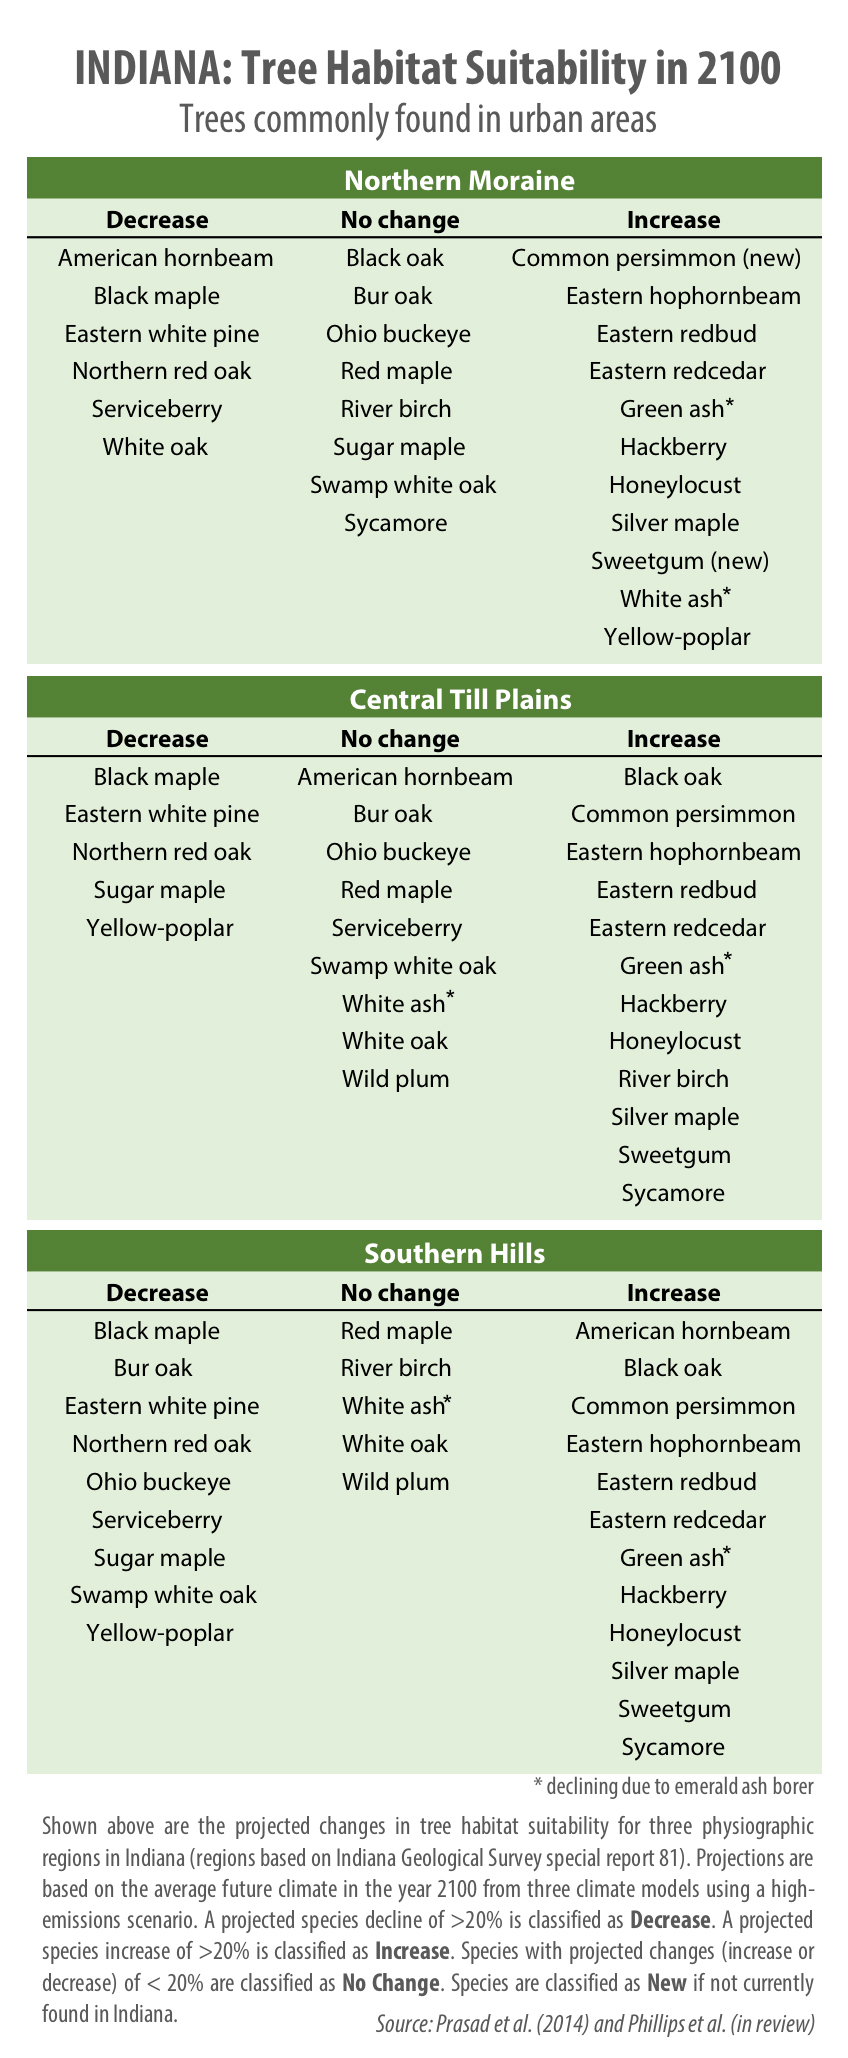
Above: Projected changes in tree habitat suitability in Indiana by 2100 based on a high-emissions scenario. Species listed above are those commonly found in urban areas based on a selection of more than 70 tree species found in Indiana. Full species list and projections for medium-emissions scenario are available. A map of physiographic regions in Indiana is available from the Indiana Geological Survey. Sources: Prasad et al. (2014) and Phillips et al. (in review).
Impacts on Other Green Infrastructure
Indiana’s increasing precipitation and extreme precipitation events will impose physical and biogeochemical stresses on green drainage infrastructure, potentially causing degradation and loss of function. Excess stormwater can impair restoration of riparian buffers—vegetated areas along streams that stabilize soil and intercept pollutants, among other benefits. The physical and biological degradation of urban streams reduces their ability to mitigate nitrate pollution and reduces stream biodiversity. And because rain gardens are less effective at reducing stormwater runoff for larger storm events, increases in extreme precipitation events could result in greater contaminant loads from stormwater sewers. Longer floods, however, may lower emissions of nitrous oxide, a heat-trapping gas, from urban riparian buffers (Jacinthe et al., 2012).
Extreme Rainfall in Indiana
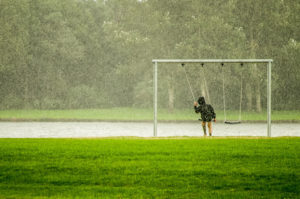 Indiana is a water-abundant state that is becoming wetter by the decade. In fact, Hoosiers see over 5 inches more annual precipitation today than they did a century ago. While ample rainfall supplies our drinking water and helps keep our lawns and gardens green, we are more frequently getting too much of a good thing.
Weather records show that while our annual total precipitation is increasing, so, too, are the number of heavy downpours and the intensity of storm events. When rain falls quickly over a short period of time, human-built and green infrastructure can be overwhelmed and damaged, with rippling effects on human and environmental health. In the Midwest, the amount of water falling in the heaviest rainfall events has grown by 42 percent from 1958 to 2016. In Indiana specifically, the number of days per year with heavy rainfall events is increasing by about 0.2 days per decade. As temperatures rise over the next century, climate scientists have concluded that heavy downpours will continue to intensify.'
Sources: Widhalm et al. (2018b), USGCRP (2017)
Hotter summers may lead to aggressive, warm-season grasses becoming dominant in urban prairies, resulting in a loss of diversity. Wet prairie plantings are vulnerable to flooding due to increased precipitation in winter and spring.
As Indiana winters become warmer, less precipitation will fall as snow and the number of days with snow cover is projected to decline by about 40 percent8. In New York, less snow cover has led to lawns retaining less nitrogen and emitting more heat-trapping gases (nitrous oxide and CO2). Given projected decreases in snow cover in Indiana, similar effects could occur.
The Annual Ginkgo Leaf Drop
Anyone with a ginkgo tree in their yard knows to keep their rakes and trash bags nearby when the weather forecasters say the first hard freeze of fall is coming. That's because unlike other trees, the ginkgo will drop all of its leaves in a single day when temperatures dip to about 20 to 25°F.
At Purdue University in West Lafayette, Indiana, the 2017 ginkgo leaf-drop occurred on November 10. While there are no historical observations of the ginkgo leaf-drop itself on campus (that we know of), there is a nearby weather station with consistent temperature observations dating back to the mid-1960s. The observations show that on the Purdue campus, the first hard freeze of the fall (defined here as 23°F as an estimate for when the ginkgo tree will drop its leaves) is happening about two weeks later compared to the mid-1960s. That means we can estimate that the annual ginkgo leaf-drop is happening about two weeks later. This is consistent with long-term warming trends in autumn low temperatures in Indiana.
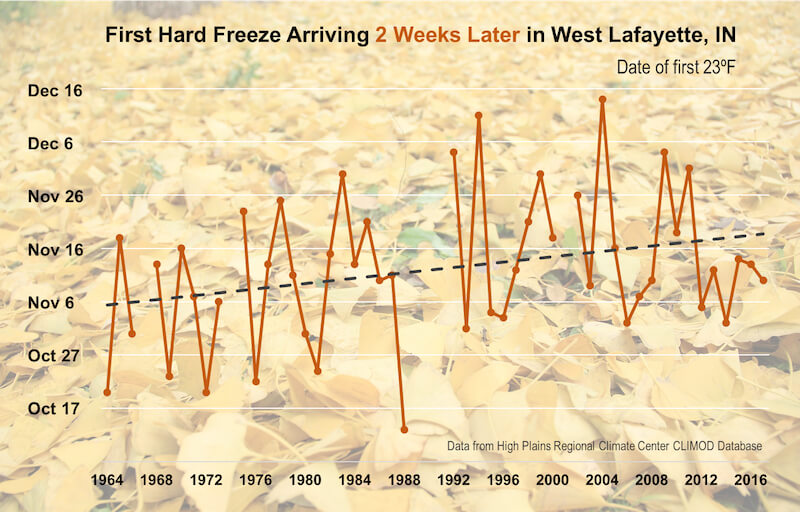
Above: Observed date of the first 23°F freeze each autumn from 1964 to 2017 at the Purdue University Airport in West Lafayette, Indiana. Years with six or more days of missing observations have been excluded. Data were accessed from the High Plains Regional Climate Center CLIMOD Database.
Management Strategies
There are several proactive steps that can be taken to improve resilience of urban green infrastructure. Depending on the location and need, green spaces can be made more bio-diverse, enhancing their capacity to adapt to changing conditions; more redundant, providing insurance against loss of any one component; more modular, compartmentalizing areas to limit the spread of diseases or invasive pests and plants; and more connective, enabling migration of beneficial species.
Landscaping with native plants will help to support whole-system biodiversity and reduce the prevalence of invasive species, whose impacts are expected to increase with climate change. Encouraging grassroots efforts to promote biodiverse neighborhood green spaces taps into growing citizen appreciation of the many benefits of “nearby nature,” helping to strengthen and grow urban green infrastructure through shared governance and stewardship. Coping with the management challenges imposed by extreme weather events and other climate changes could impose additional strain on already tight city budgets. Community stewardship of urban green space could help to relieve some of that strain.
Urban forests, urban farms and lawns may require more irrigation in hotter, drier summers. Or those spaces may need to be proactively planted with more drought-tolerant species. Those who care for trees or gardens will need to pay more attention to how climate is affecting their plants and shift management strategies accordingly. Tree pruning may need to occur at different times of the year, for example.
Proactively planning for chemical or biological control of fungal pathogens or to ward off pests may be necessary to keep tree canopies intact. Forest managers might consider increasing genetic, species and structural diversity among trees or transition to new types of green spaces.
Municipal officials may have to plan for additional tree and branch removal following heavier rains or losses from diseases and pests. Timing for leaf-removal services may need to run later into the year as warm temperatures last deeper into the fall.
In urban gardens or farms, cover crops and mulch can help protect soil and improve soil quality. These methods reduce erosion concerns, build organic matter, improve soil water retention and develop resilience against extreme wet or dry periods. Unexpected frosts can be countered through use of hoop houses, high tunnels and greenhouses, and by avoiding planting in low areas, which are more vulnerable to frosts.
Wetter winters and springs, and more frequent heavy rainfall events, might overburden stormwater drainage systems. Incorporating green drainage solutions could be one option to help offset those effects.
Urban prairies may require more drought-tolerant species, as well as changes to burning and mowing practices. Herb-dominated species mixes may help control aggressive warm-season grasses in drier prairies, while wet prairies may need species that can tolerate prolonged flood conditions.
Resources for Managers
 If you are a natural resource manager looking for additional information about adjusting urban green infrastructure for climate change, you can start here:
- Chicago Wilderness Region Climate Action Plan for Nature–guides conservationists in anticipating, adapting to, mitigating and communicating about climate change in urban natural areas.
- Forest Adaptation Resources: Climate Change Tools and Approaches for Land Managers–discusses climate change planning for natural and urban forests.
Additional resources for anticipating, identifying and managing invasive and pest species in Indiana’s urban and rural forests can be found at the websites maintained by the Indiana Invasive Species Council, Purdue Extension Entomology and the Indiana Department of Natural Resources Division of Entomology and Plant Pathology.
Key Knowledge Gaps
Continued research is needed to improve our ability to anticipate which species will thrive in Indiana’s urban forests, gardens and other green spaces as our climate changes. We also need to improve our understanding of how green space carbon budgets may change as our climate becomes warmer and wetter so that green infrastructure can be best employed toward the goal of zero-carbon cities. Furthermore, comprehensive inventories of urban forests and other forms of green infrastructure are needed as a basic foundation for anticipating and preparing for vulnerabilities, and integrating green and gray infrastructure for optimal urban functioning and resilience. Researchers are still learning about how Indiana cities measure and prepare for changing risks to urban forests and other green infrastructure. As new knowledge is gained, best practices can be distributed to communities to help prepare them for the challenges of a changing climate.
Conclusion
Urban green infrastructure provides many benefits to cities in Indiana, including stormwater control, reductions to residential electrical costs, wildlife habitat, locally grown food, carbon mitigation and storage, and recreational opportunities. Indiana’s climate is expected to get warmer overall, with wetter conditions in the winter and spring and potentially drier conditions in the summer. Those changes increase the importance of managing and maintaining urban green infrastructure, but will also increase the risk of damage to urban forests, prairies, farms and other spaces from heat, flooding, diseases and pests. Proper assessment and planning can safeguard many of these spaces and play a significant role in addressing the impacts cities should expect from a changing climate.
References
Cherkauer, K.A., Bowling, L., Chaubey, I., Chin, N., Ficklin, D., Kines, S., Lee, C., Pignotti, G., Rahman, S., Singh, S., Valappil, F., and T. Williamson. (in preparation). Climate change impacts and strategies for adaptation for water resource management in Indiana.
Hamlet, A., Byun, K., Robeson, S., Widhalm, M., and M. Baldwin. (in review). Impacts of Climate Change on the State of Indiana: Future Projections Based on CMIP5. Climatic Change. https://doi.org/10.1007/s10584-018-2309-9. (Read for free at https://rdcu.be/cdhzT )
Jacinthe, P.A., Bills, J.S., Tedesco, L.P., and R.C. Barr. (2012). Nitrous oxide emission from riparian buffers in relation to vegetation and flood frequency. Journal of Environmental Quality 41:95-105.
Nowak, D.J., Appleton, N., Ellis, A., and E. Greenfield. (2017). Residential building energy conservation and avoided power plant emissions by urban and community trees in the United States. Urban Forestry & Urban Greening 21:158-165.
Nowak, D.J., Greenfield, E.J., Hoehn, R.E., and E. Lapoint. (2013). Carbon storage and sequestration by trees in urban and community areas of the United States. Environmental Pollution 178:229–236.
Phillips, R.P., Brandt, L., Polly, D., Zollner, P., Saunders, M.R., Clay, K., Iverson, L., and Fei, S. (In review). Towards an improved understanding of the ecological and economic consequences of climate change for Indiana forests. Climatic Change. (Read for free at https://rdcu.be/cdhAA)
Phillips, R.P., Fei, S., Brandt, L., Polly, D., Zollner, P., Saunders, M.R., Clay, K., Iverson, L., Widhalm, M., and J.S. Dukes. (2018). Indiana’s Future Forests: A Report from the Indiana Climate Change Impacts Assessment. Purdue Climate Change Research Center. West Lafayette, Indiana.
Prasad, A.M., Iverson, L.R., Peters, M.P., and S.N. Matthews. (2014). Climate change tree atlas. Northern Research Station, U.S. Forest Service, Delaware, OH. http://www.nrs.fs.fed.us/atlas.
Reynolds, H.L, Brandt, L., Fischer, B.C., Hardiman, B.S., Moxley, D.J., Sandweiss, E., Speer, J., and S. Fei. (in review). Implications of climate change for managing urban green infrastructure in Indiana. Climatic Change. (Read for free at https://rdcu.be/cdhAQ)
USGCRP. (2017) Climate Science Special Report: Fourth National Climate Assessment, Volume I [Wuebbles, D.J., D.W. Fahey, K.A. Hibbard, D.J. Dokken, B.C. Stewart, and T.K. Maycock (eds.)]. U.S. Global Change Research Program, Washington, DC, USA, 470 pp.
Widhalm, M., Hamlet, A. Byun, K., Robeson, S., Baldwin, M., Staten, P., Chiu, C., Coleman, J., Hall, B., Hoogewind, K., Huber, M., Kieu, C., Yoo, J., and J.S. Dukes. (2018a). Indiana’s Past & Future Climate: A Report from the Indiana Climate Change Impacts Assessment. Purdue Climate Change Research Center, Purdue University. West Lafayette, Indiana. DOI: 10.5703/1288284316634
Widhalm, M., Robeson, S., Hall, B., Baldwin, M., and J. Coleman. (2018b). Indiana’s Climate Trends: A Resource for the Indiana Climate Change Impacts Assessment. Prepared for the Indiana Climate Change Impacts Assessment, Purdue Climate Change Research Center. DOI 10.5703/1288284316635
How to Cite
Reynolds, H., Brandt, L., Widhalm, M., Fei, S., Fischer, B., Hardiman, B., Moxley, D., Sandweiss, D., Speer, J., and J.S. Dukes. (2018). Maintaining Indiana’s Urban Green Spaces: A Report from the Indiana Climate Change Impacts Assessment. Purdue Climate Change Research Center, Purdue University. West Lafayette, Indiana. DOI: 10.5703/1288284316653
IN CCIA Urban Green Infrastructure Working Group:
- Heather Reynolds, Indiana University, co-lead
- Leslie Brandt, U.S. Forest Service, co-lead
- Songlin Fei, Purdue University
- Burnell Fischer, Indiana University
- Brady Hardiman, Purdue University
- Donovan Moxley, Indiana University
- Eric Sandweiss, Indiana University
- James Speer, Indiana State University
Footnotes
1 Plant heat stress data provided by the IN CCIA Climate Working Group (Widhalm et al., 2018a). Central Indiana refers to the average across the middle third of the state. Projected change in temperature averaged across 10 climate models for two scenarios of heat-trapping gas emissions. The “medium” emissions scenario (RCP 4.5) is the lower bound of the range and the “high” emissions scenario (RCP 8.5) is the upper bound of the range. The high-emissions scenario represents our current trajectory. Mid-century refers to the 30-year period from 2041 to 2070. Predicted change in heat stress days is relative to a baseline from 1915 to 2013.
2 Projected change in temperature averaged across 10 climate models for two scenarios of heat-trapping gas emissions. The range represents outcomes from a medium- and high-emissions scenario (see footnote 1). Mid-century refers to the 30-year period from 2041 to 2070. Late-century refers to the 30-year period from 2071 to 2100. Future temperature changes are relative to the statewide annual average temperature from 1971 to 2000. Further details provided in Widhalm et al. (2018a).
3 Southern Indiana refers to the average across the southern third of the state. The range represents outcomes from medium- and high-emissions scenarios (see footnote 1). End of century, also called late century, is the average for the period 2071 to 2100.
4 Historical period is the average from 1915 to 2013. See Widhalm et al. (2018a) for details.
5 Projected change in precipitation averaged across 10 climate models for two scenarios of heat-trapping gas emissions (medium and high). Percent change is relative to the statewide average from 1971 to 2000. Late century refers to the 30-year period from 2071 to 2100. See Widhalm et al. (2018a) for details.
6 Projected changes in tree habitat suitability are for the year 2100 assuming a high-emissions scenario. Data are from the U.S. Forest Service Climate Change Tree Atlas (Prasad et al. 2014). Full species list and projections for medium-emissions scenario are available.
7 Mid-century refers to the 30-year period from 2041 to 2070.
8 Projected change in snow cover is based on data provided by the IN CCIA Water Resources Working Group (Cherkauer et al., in preparation). The 40 percent decline cited in the report refers to predictions for the period 2041 to 2070, relative to the period 1984 to 2013, based on a high-emissions scenario.
Acknowledgements
We thank Brian Wallheimer for drafting this report, Stan Coffman for assistance with graphics, and staff from Purdue University’s Department of Agricultural Communication, including Maureen Manier, Darrin Pack, Erin Robinson, Kenny Wilson, Andrew Banta, Joan Crow and Russell Merzdorf for help with the production and release of the report. Thank you to PCCRC managing director Rose Filley for valuable input. We are grateful to Nina Collins and Marcia Wilhelm-South from the Purdue University Libraries Scholarly Publishing Division for online publication support for all documents associated with the IN CCIA.