Interactive cytoscape visualization
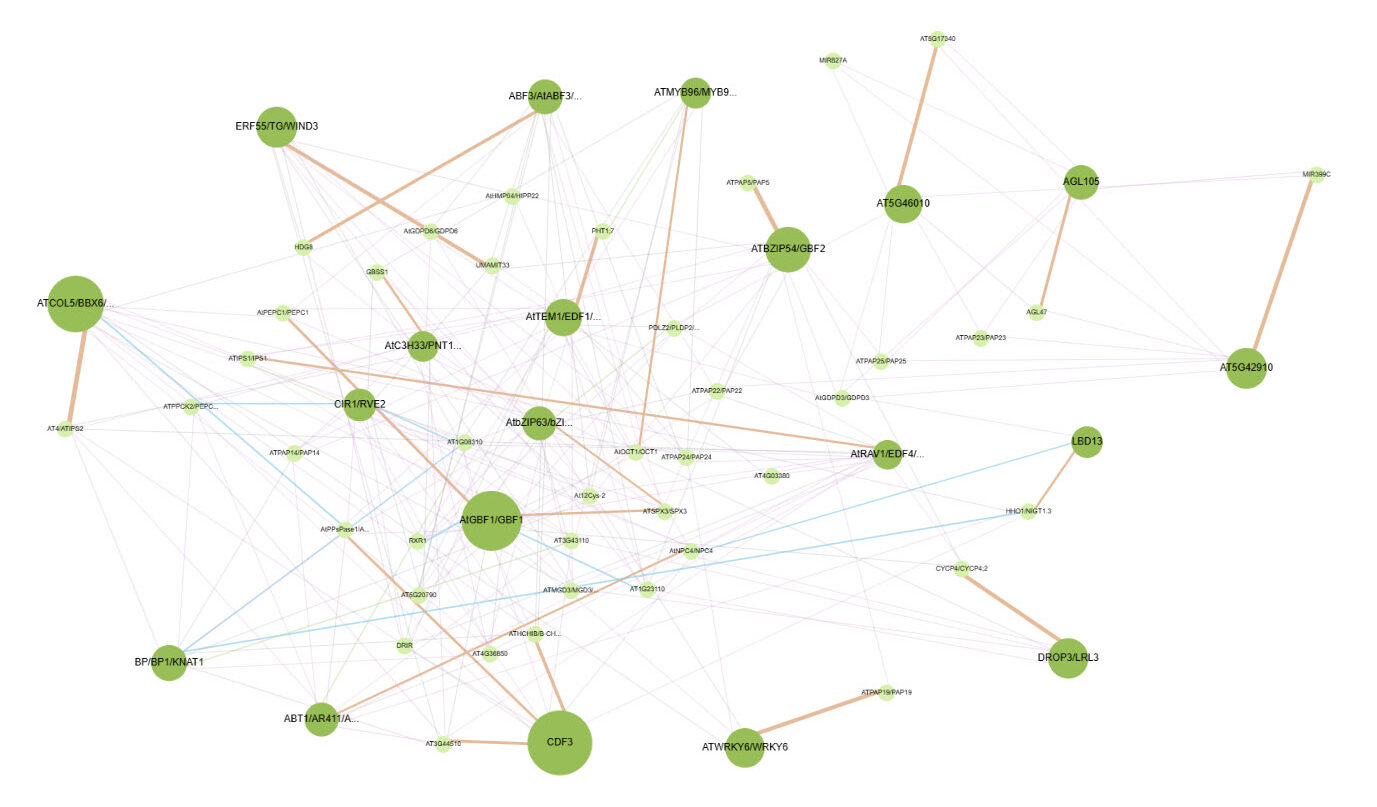
Dr. Kranthi Varala needed a web-accessible tool to extract data and visualize the regulatory network for WHO. The total amount of data was over 100 million data elements. Our team utilized shared university resources to provide a no-cost solution for Dr. Varala.
From Dr. Varala’s lab website:
This site offers access to the organ-specific GRNs from Arabidopsis thaliana, generated as part of the OD-GRN project (https://doi.org/10.1101/2023.06.17.542927). Briefly, an ML classifier was trained to predict the organ of origin for each RNASeq run in NCBI’s SRA. Primary data is available here: https://purr.purdue.edu/projects/odgrn/publications/4311 Gene Regulatory Network (GRN) inference was performed for each organ from all samples labeled as belonging to that organ. GRN inference was done using the GENIE3 algorithm with ~1,700 TFs provided as potential regulators for each gene. This approach was applied to the Flower, Root, Seed and Shoot datasets. The leaf dataset was subsampled to select 1,000 random RNASeq runs to make the inference feasible. Finally, two additional GRNs were inferred: 1. Mature Leaf(Ecotypes) and 2. Leaf(All Stages). The Mature leaf (Ecotypes) dataset included only the RNASeq runs from the Arabidopsis 1K initiative which sampled leaves from over 1000 ecotypes at the adult, but vegetative stage. Finally, the leaf All Stages samples included all leaf samples that were not from the 1K initiative and thus represent leaf samples from multiple stages of the Arabidopsis life cycle. For these two data sets, GRN inference was limited to 200 regulators per gene (K=200 option in the GENIE3 algorithm). The top 10% of all edges predicted for each GRN were retained and are available to query and visualize in this tool.