The Future of Indiana's Water Resources: A Report from the Indiana Climate Change Impacts Assessment
Climate affects our water resources
Indiana’s water resources—in streams and lakes, in plants and soils, and underground—are a critical component of the state’s economy and well-being. Availability of this important resource is driven by precipitation and temperature patterns, both of which have shifted in recent decades, and is also highly influenced by how we manage natural and human systems.
As local temperatures continue to rise1 and rainfall patterns shift, managing the multiple water needs of communities, natural systems, recreation, industry, and agriculture will become increasingly difficult. Ensuring that enough water is available in the right places and at the right times will require awareness of Indiana’s changing water resources and planning at regional and state levels.
This report from the Indiana Climate Change Impacts Assessment (IN CCIA) applies climate change projections for the state to explore how continued changes in Indiana’s climate are going to affect all aspects of water resources, including soil water, evaporation, runoff, snow cover, streamflow, drought, and flooding. The findings presented here are primarily based on the IN CCIA Water Resources Working Group technical report (Cherkauer et al., 2021) and the IN CCIA report IN CCIA report Indiana’s Past and Future Climate (Widhalm et al., 2018).
the takeaway
Key finding: Precipitation has already increased across Indiana, and this pattern is projected to continue, with most future increases occurring in the winter and spring, making for wetter spring conditions. Summer precipitation is projected to remain the same or decrease slightly, but the intensity of summer storm events is projected to increase.
Key finding: Ongoing increases in temperature will accelerate, raising evapotranspiration rates – the amount of moisture lost to plant use and evaporation from surface soils and water – by 5 to 6 percent across Indiana by midcentury.
Key finding: Water storage in soil is expected to increase by 2 to 5 percent in the spring and decrease by 5 to 9 percent in the fall, though the amount of change will vary across the state. Wetter springs could make agricultural planting difficult and the potential for flooding more likely. Water deficits will increase late in the growing season, because higher temperatures will cause faster evapotranspiration while summer rainfall remains unchanged or decreases slightly.
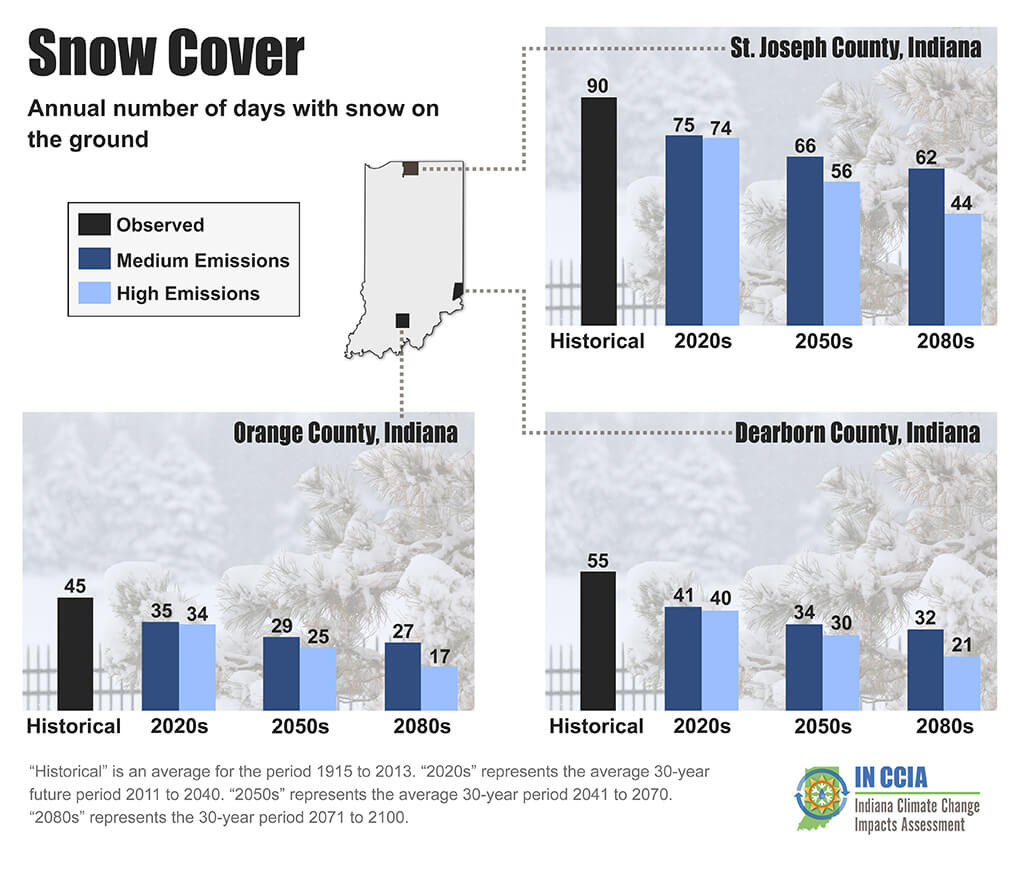
Key finding: Snowfall and snow cover across the state will decline as winter temperatures rise. More precipitation in the winter will come as rain, and snow that does fall will melt faster. The number of days with significant soil frost will decrease sharply throughout the century.
Key finding: Streamflow has generally increased for all but the northeast part of the state over the last 30 years. Annual streamflow is expected to continue rising throughout the state, with distinct seasonal shifts. In spring, more precipitation will increase streamflow, but risks of flooding due to snow melt or rain on snow may decline late in the century. Average streamflow will decrease in the summer and fall, but the total number of low-flow days is expected to decrease as summer precipitation intensity increases.
Key finding: The frequency and magnitude of high streamflow events are expected to rise, especially in the Patoka River and St. Joseph River2 basins. Increased spring precipitation and saturated soils will make flooding and ponding on agricultural fields more likely, and more intense precipitation events will lead to more urban flooding as stormwater retention facilities more quickly reach their capacities. Continued urban development and more intensive agricultural drainage is likely to further exacerbate flooding issues.
Key finding: Wetter conditions overall are expected to reduce the likelihood of prolonged, multi-year droughts in Indiana. However, flat or declining summer precipitation occurring in less frequent but more intense storm events, paired with loss of soil water from rising rates of evapotranspiration, increase the likelihood of sudden onset, short-duration droughts.
Indiana Water Use and Management
Historically, Indiana has been considered a water-rich state with significant groundwater reserves, especially in the north. However, with the climate changing and increasing demands, the resource will need to be carefully managed. Only about 10 percent of the state’s surface area drains into the Great Lakes; the rest drains primarily through the Wabash and Ohio Rivers into the Mississippi River, which eventually reaches the Gulf of Mexico. A detailed accounting of water availability and water use in Indiana can be found in the 2014 report Water and Economic Development in Indiana.
Surface water withdrawals account for most of the water resources used throughout the state. About 53 percent of surface water used (3,822 million gallons per day [mgd] in 2015) goes to the energy sector (and all but 5 percent of that is returned to the local watershed), while 32 percent (2,287 mgd) goes to the industrial sector. Other surface water uses include public water supplies (7 percent), agriculture (2 percent), rural water supplies (1.5 percent) and mining (1.4 percent). Overall, Indiana’s surface water withdrawals have been declining in recent decades, mostly driven by reductions from the energy sector.
Groundwater accounts for about 10 percent of the state’s fresh water. Agriculture and household water supplies are the two largest groundwater uses, and extraction for these uses is increasing. The number of high-capacity irrigation facilities (including both ground and surface water extraction) more than doubled from 1985 to 2013, with 400 new installations from 2007 to 2013. While water availability is not currently restricted by increasing demand, shallow wells may have to be re-drilled if increasing trends in use continue.
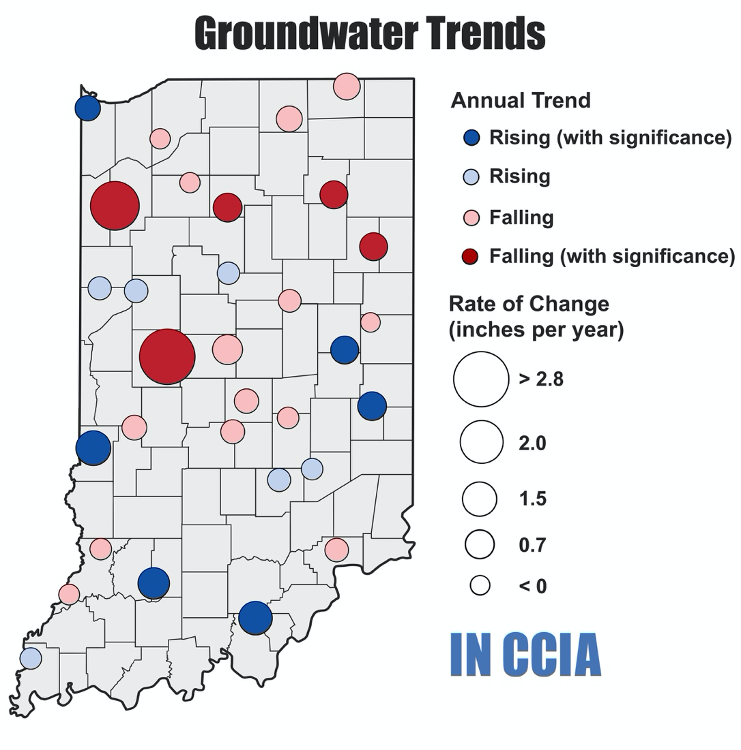
Observed trend in water table depth over the last 30 years. Falling water tables indicate that groundwater resources are in decline. (Source: State of Indiana Waters, accessed October 7, 2019)
Indiana is perceived as water-rich but still experiences water extremes. Managers must plan for both too much and too little water. Over the last two decades alone, recurring severe floods and a severe drought have cost Hoosiers billions of dollars in losses of crops, infrastructure, and personal property (https://www.ncdc. noaa.gov/billions/).
Agricultural drainage and runoff can degrade water quality as nutrients leach from soils and reach nearby waterways that drain into the Great Lakes and the Gulf of Mexico. These nutrients can increase harmful algal blooms and deplete oxygen in the water, creating “dead zones.”
As described throughout this report, Indiana will need to account for future increases in late winter and early spring precipitation, which may increase streamflow and saturate soils, leading to ponding or flooding in agricultural fields. Those precipitation changes along with uncompensated increases in agricultural drainage may also increase flooding along streams. Increased precipitation may also overwhelm municipal stormwater systems, filling them faster and leading to urban flooding. Adapting to and planning for these climate changes will be essential in managing the state’s future water resources and minimizing negative consequences.
The Data
Future climate projections in this report are based on an ensemble average of six global climate models for midcentury (2041 to 2070) and late-century (2071 to 2100). See Byun and Hamlet (2018) and Hamlet et al. (2019) for details. Two future scenarios of greenhouse gas concentrations are considered — “medium” and “high.” These scenarios follow Representative Concentration Pathways (RCPs) 4.5 and 8.5, respectively, which have been used to develop many previous projections summarized by the Intergovernmental Panel on Climate Change. Additional information about the techniques and assumptions of climate modeling are found in the IN CCIA report Indiana’s Past and Future Climate.
The Variable Infiltration Capacity (VIC) large-scale hydrology model was used for statewide simulations of water movement and storage, as well as simulation results relating to infiltration, soil water, evapotranspiration, streamflow and cold-season processes. The VIC model simulations calculate a complete water and energy balance for each simulation grid cell in the state. The model also simulates snow and soil frost, soil water, surface runoff, baseflow (i.e., the groundwater contribution to streamflow) and evapotranspiration. The base model has been updated to include lake and wetland subsurface drainage. Simulations rely on historical hydrologic data, including daily precipitation, and maximum and minimum air temperature, from 1915 through 2010.
Precipitation
Indiana has already seen increases in precipitation. From 1895 to 2019, annual precipitation has increased by about 6.5 inches, with larger increases in the southern portion of the state. These trends are expected to continue, though the type of precipitation, when it falls, and its intensity will change.
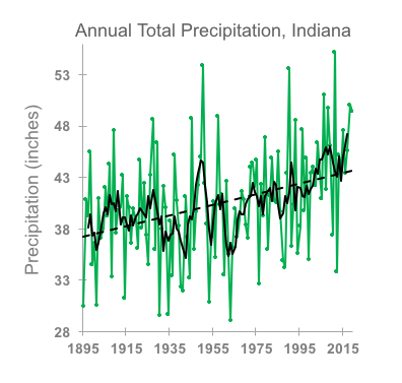
Statewide annual total precipitation for Indiana from 1895 to 2019 shown in green. Black solid line shows the 5-year running average precipitation. Black dashed line shows the increasing linear trend in annual precipitation (0.52”/decade). Source: NOAA Climate at a Glance Database.
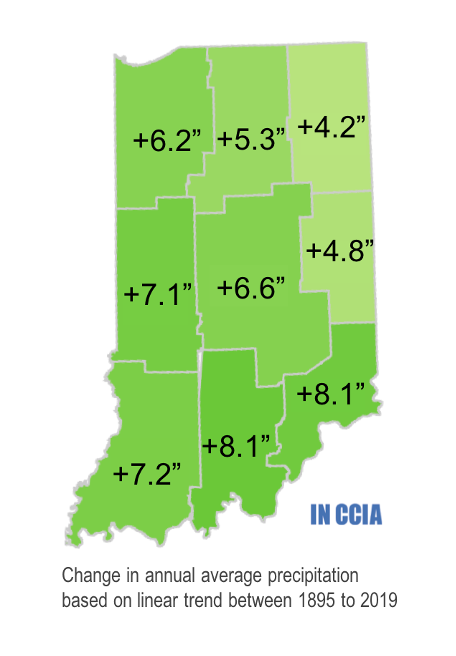
Increase in annual precipitation for Indiana’s nine climate divisions, based on a linear trend, from 1895 to 2019. Source: NOAA Climate at a Glance Database.
Indiana is expected to see 6 percent to 8 percent more annual precipitation by midcentury under the medium- and high-emission scenarios, respectively, with distinct seasonal changes. Nearly all climate models predict increased precipitation in the winter and spring, and most models point toward slightly drier conditions in the summer and fall. More of this precipitation will fall as rain as warmer temperatures reduce the amount of snow that falls across the state (for details, see Winter Processes).
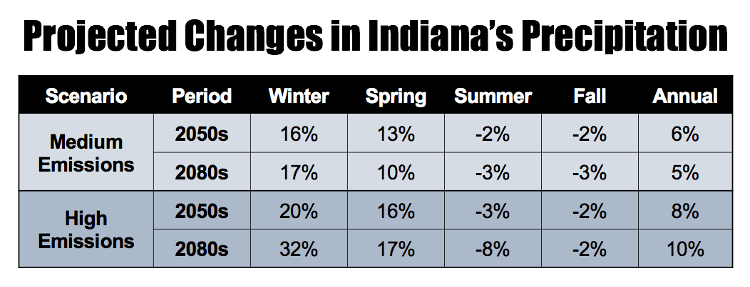
Projected annual and seasonal percent change in precipitation for Indiana compared to the historical period (1971 to 2000). Values represent state-level averages from 10 climate model projections. For the future projections, “2050s” represents the average from 2041 to 2070, and “2080s” represents the period from 2071 to 2100. Source: Hamlet et al. (2019).
Extreme precipitation events in Indiana are occurring more often and are increasing in intensity. Storms can be measured by their duration (length in minutes, hours or days), intensity (amount of water precipitating over the duration of the storm), frequency (how often storms of a certain size have occurred) and whether storms of a given intensity and duration are happening more frequently than they did in the past.
Since 1900, the number of days per year with extreme rainfall (defined as the top 1 percent of all events) has increased by 0.2 days per decade on average, with most occurring since 1990. Averaged across the Midwest, there has been a 42 percent increase in the amount of precipitation falling in the top 1 percent of events from 1958 to 2016 (USGCRP, 2017), meaning today’s largest rainfall events are bringing a higher volume of water than in the past.
The heavy rainfall trends that have been measured in Indiana and the Midwest are expected to continue. According to the National Climate Assessment, the Midwest is projected to see a twofold to threefold increase in the number of storm events exceeding a two-day, five-year return period3 by late century under the high-emissions scenario (USGCRP, 2017). The amount of precipitation in a one-day, 20-year return period storm is projected to increase by about 20 percent under high emission scenarios, and by 11 percent under medium-emission scenarios in the Midwest (USGCRP, 2017). One study looking specifically at Indiana found that, by late century, the magnitude of one-day, 25-year storm events in the summer will be more than 20 percent larger than in the past for most areas in the state, although the results are highly variable in different parts of the state due to limited data (10 years) from the climate simulations (Byun 2019).
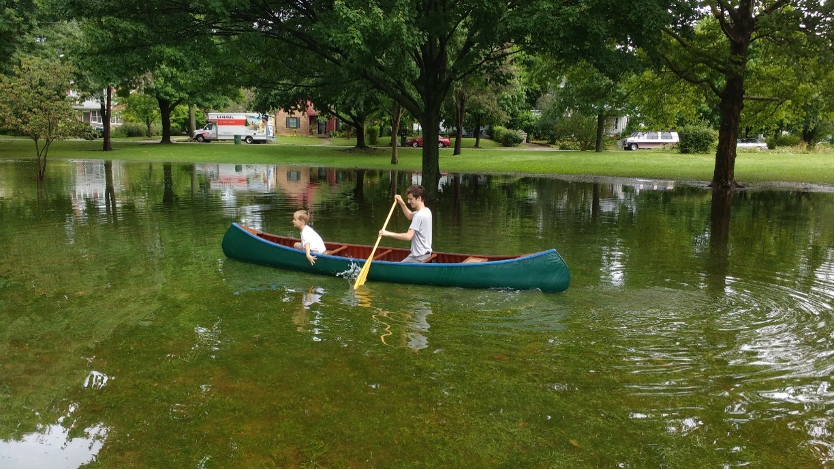
Canoeing on Nokomis Park in South Bend (Indiana) in August 2016 after an estimated 1,000-year rainfall event that caused widespread damage to homes and businesses.
Recent extreme storms and floods have provided a preview of climate change impacts to stormwater and river flooding. In August 2016, South Bend received more than 8 inches of precipitation in 24 hours (some precipitation measurements around the city were much higher than 8 inches), an approximately 1,000-year rainfall event4 (meaning there was only a 0.1 percent chance of this event happening in any given year based on historical records) that caused widespread groundwater flooding and sewer backflows.
The unusually wet spring of 2019 significantly delayed agricultural planting schedules across the state, but was followed by moderate drought conditions by late summer. Projections of future climate suggest that this combination of conditions will become more common in Indiana.
Evapotranspiration
Evapotranspiration is the total amount of water used by plants and lost due to evaporation directly from surface-water bodies and soil. Satellite data indicate that Indiana loses 14 inches of water per year in the northern part of the state and 43 inches per year in the south from evapotranspiration, for a statewide average of about 34 inches per year. Developed areas lose about 5 inches per year. Evapotranspiration peaks from May to August in Indiana.
Evapotranspiration rates are expected to increase under all emission scenarios and throughout the century, mainly from increasing temperatures. This is true even in the winter when reduced snow cover and soil frost, combined with higher temperatures, lead to larger evaporative losses.
By midcentury, Indiana’s average annual evapotranspiration is expected to increase by around 6 to 7 percent under the medium- and high-emission scenarios, respectively, with average annual evapotranspiration rates of about 36 inches per year for both scenarios.
Evapotranspiration rates remain the highest in the south under both the medium- and high-emission scenarios, but the relative percent change is similar across the entire state (increasing by about 5 to 7 percent) by mid- and late-century.
Percent change in Indiana’s future annual average evapotranspiration compared to the historical statewide average (1984 to 2013). For the future projections, “2050s” represents the average of the 30-year period from 2041 to 2070 and “2080s” represents the average of the 30-year period from 2071 to 2100. The lower end of the projection range is based on the medium emissions scenarios. The higher end of the projection range is based on the high emissions scenario. Source: Cherkauer et al. (2021)
Increasing temperatures will drive up water demand, but evapotranspiration also depends on water availability, which is projected to decline during warm season months throughout the century. Evapotranspiration rates are expected to increase through midcentury, driven by annual precipitation increases. A decline in water availability by late-century could cause evapotranspiration to stall and even start to decline.
Soil Water
Soil water is the amount of water stored in the root zone, or about the top 3 to 6 feet of soil. In Indiana, soil water is most abundant in the spring and becomes depleted through late spring and summer as plants and crops use it as a resource. Soil water is replenished through winter precipitation, snow melt and spring rain. Soil water levels – including the amount and the timing of recharge and depletion – play a critical role in crop production, water availability for streams, groundwater recharge, and flood risk, among other impacts.
Scientists assess annual soil-water storage based on soil water at the end of the “water year,” which is the last day of September. Under the medium- and high-emission scenarios, average soil-water storage is expected to drop by about 5 percent by midcentury, and by 8 to 10 percent by late century.
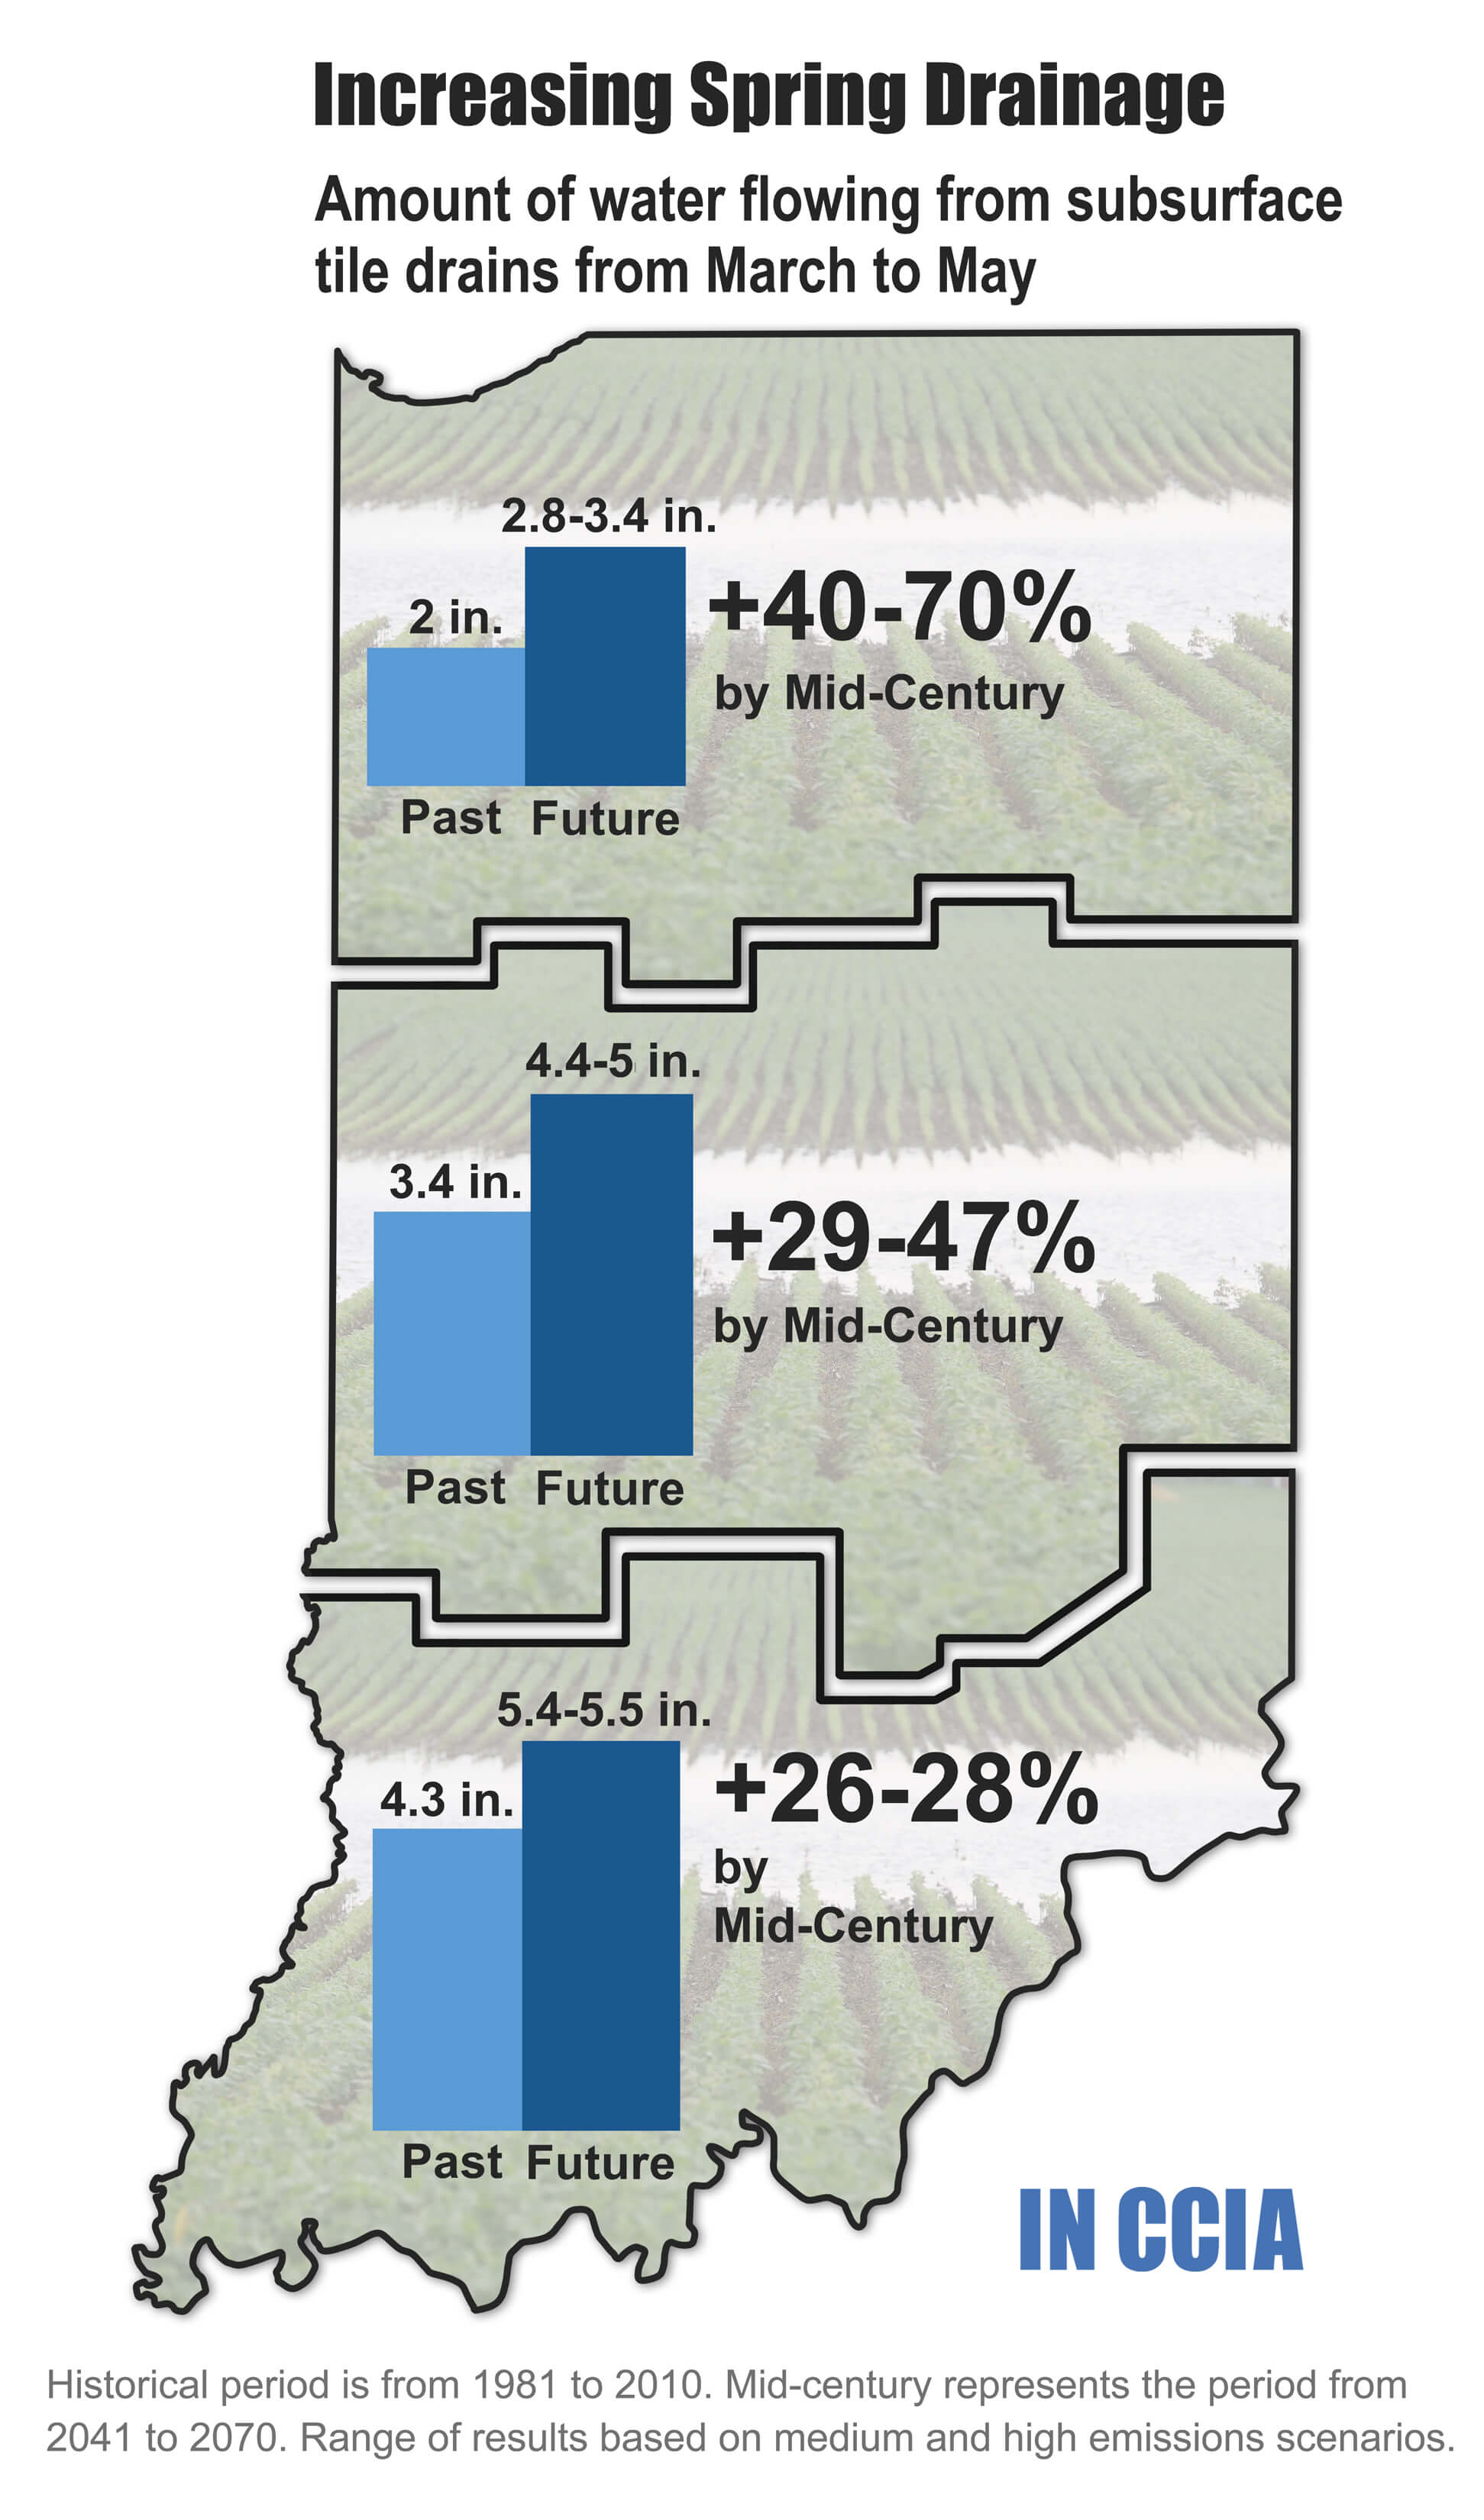
Farming in Indiana relies on subsurface drainage systems (“drainage tiles”) to remove excess water — minimizing saturated root-zone conditions and making fields accessible in the spring. In the future, peak soil-water storage is expected to shift earlier in the year, from April to March, with spring soil water storage increasing by 4 percent by midcentury and by up to 9 percent by the end of the century. Subsurface drainage is expected to increase in the winter and spring because of these wetter conditions as well as the warmer climate, resulting in less snow cover and less soil ice. This will increase annual subsurface drainage by 17 to 25 percent by midcentury, with spring subsurface drainage increasing by 32 to 48 percent.
With warmer, drier summers in the future, crops will be more dependent on winter and spring precipitation, suggesting that it will be important to monitor and actively manage subsurface drainage to keep enough water in soils to supply water for crops. According to Bowling et al. (2018), the median growing-season water deficit — the difference between growing-season precipitation and plant-available water demand — is expected to double by midcentury, increasing from 3.7 inches historically to 7.6 to 8.1 inches in the future. Increasing soil water deficits will push more farmers to install irrigation or implement alternative drainage water management to mitigate the increasing risk of yield losses due to short, intense drought conditions late in the growing season. Fall soil water storage is projected to decrease by 5 percent midcentury, and up to 9 percent by the end of the century.
According to research by Byun et al. (2019), extreme low soil water conditions (7-day, 10-year return interval) are expected to remain unchanged or occur slightly less frequently by the middle of the century for both the medium and high emissions scenario as overall conditions moisten. By the end of the 21st century, for the high emissions scenario specifically, portions of Indiana are expected to see a modest increase in the frequency of extreme low soil water.
Winter Processes
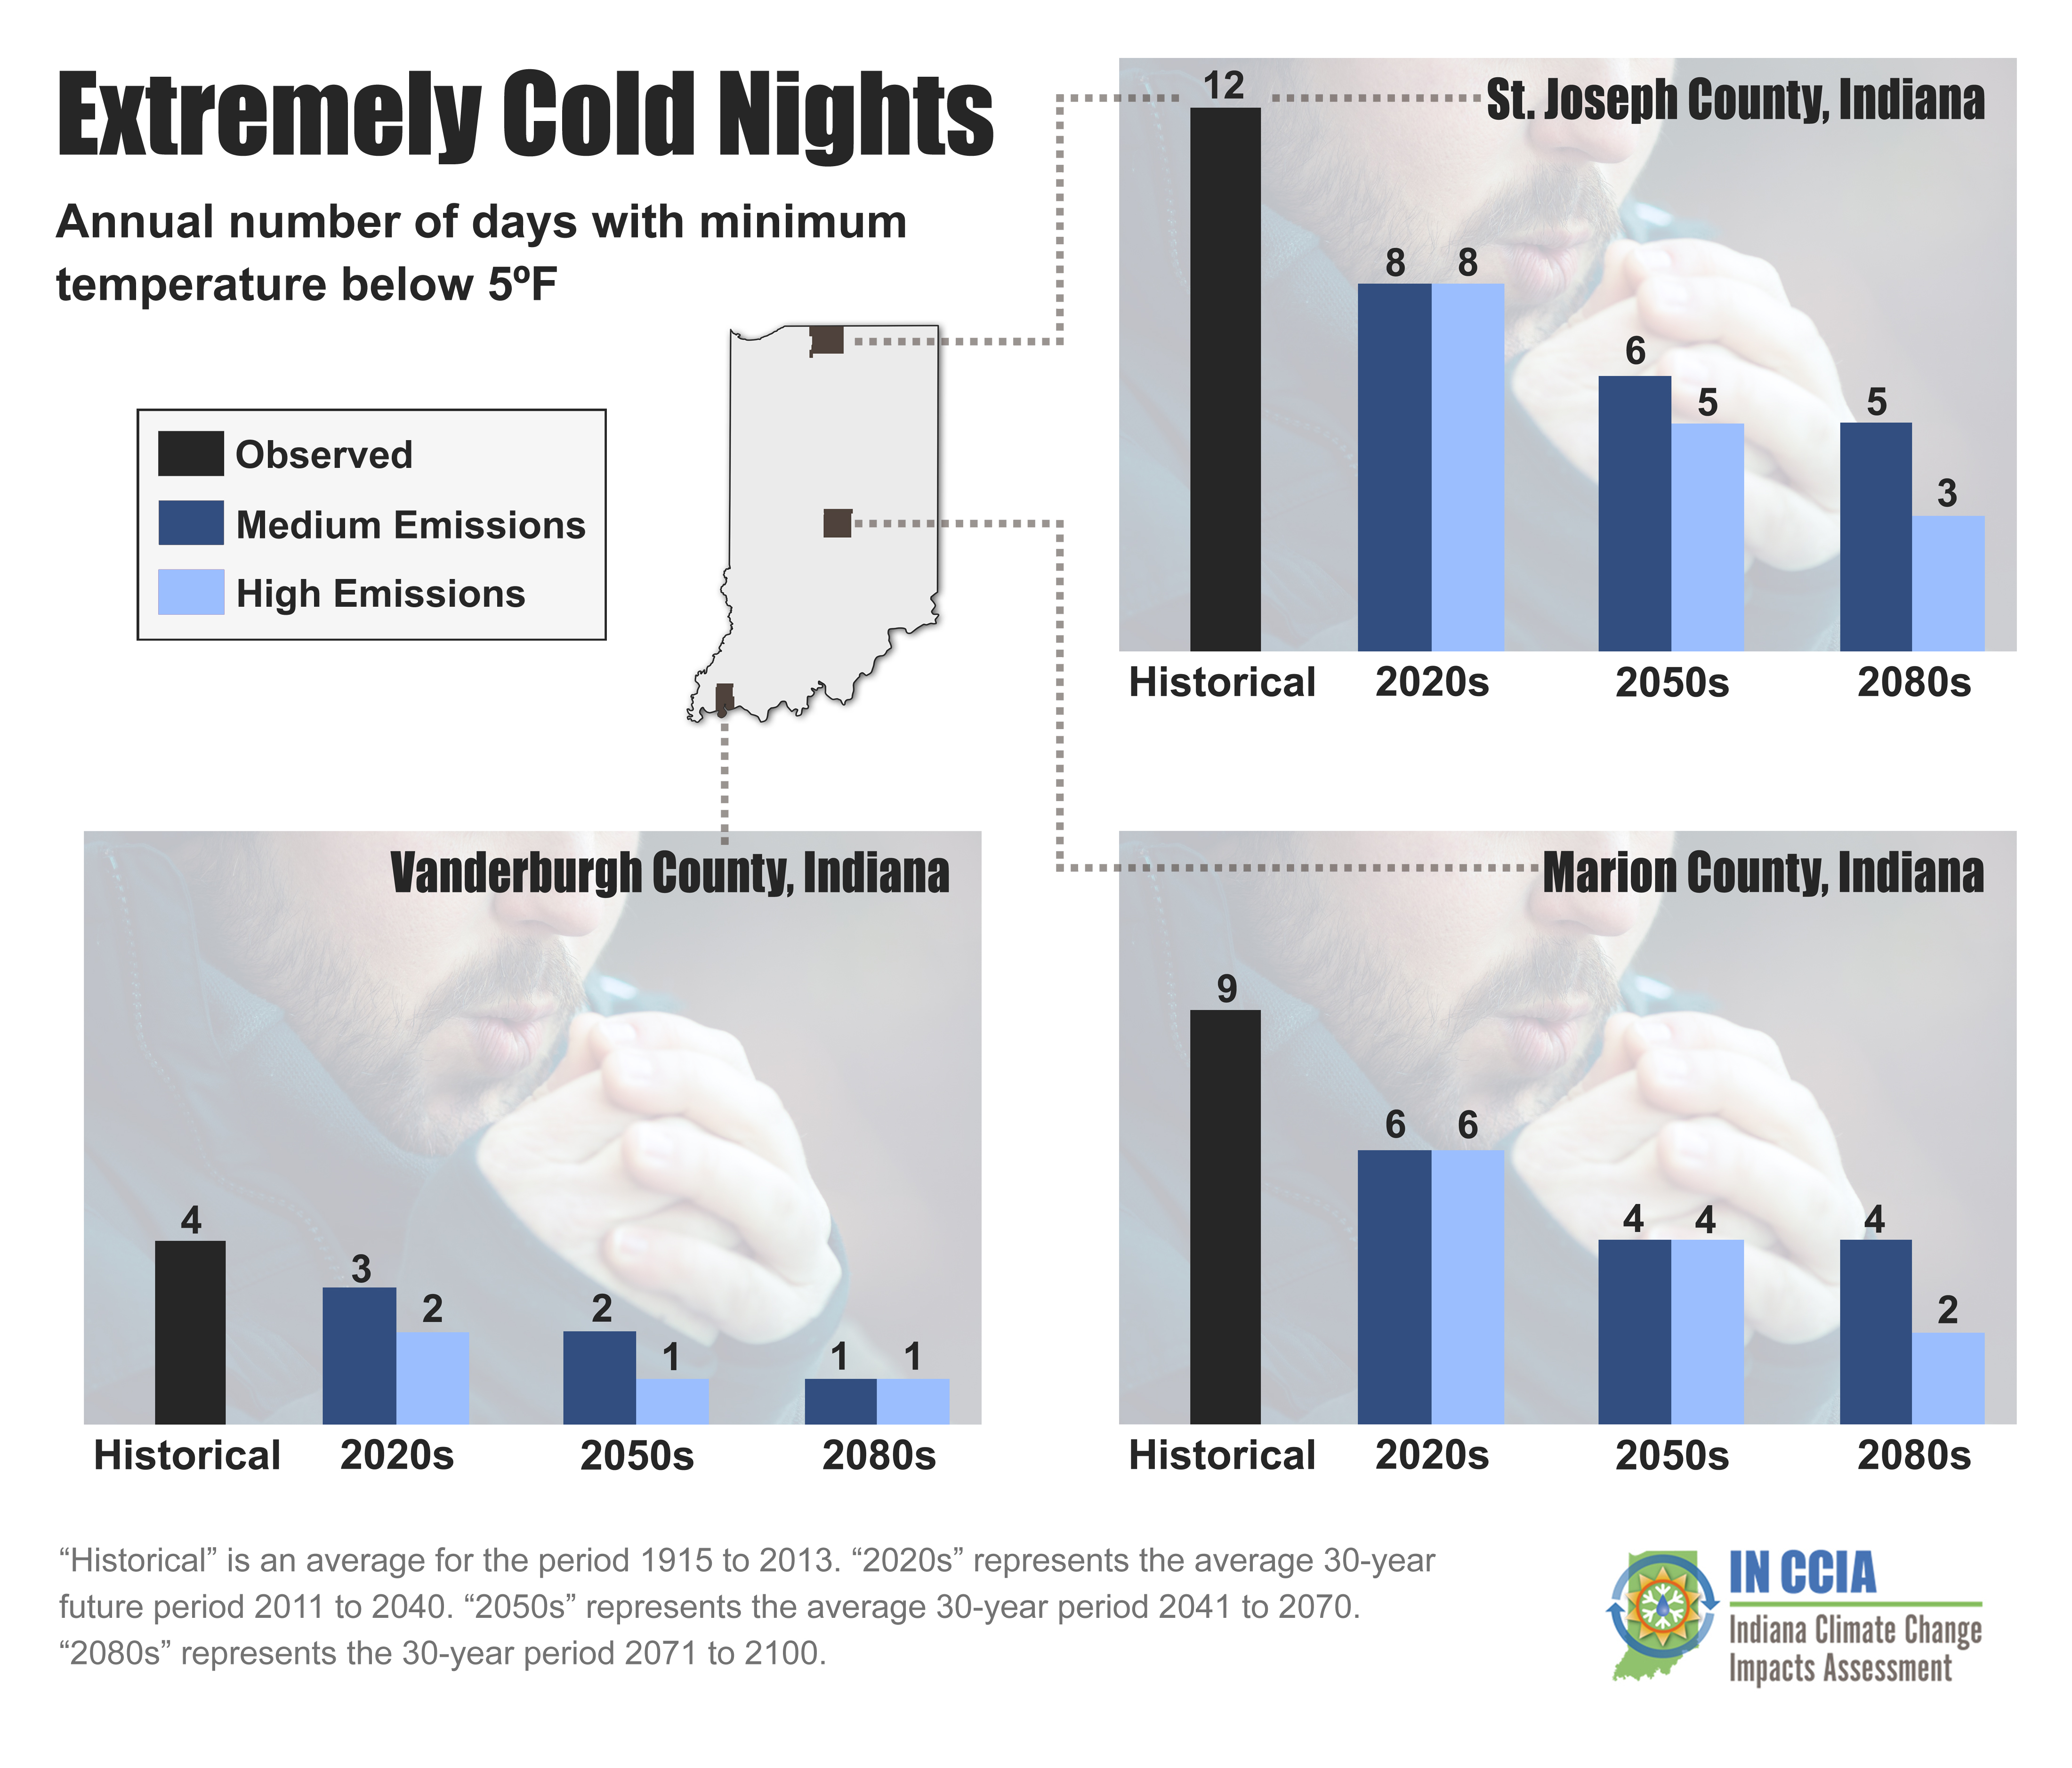
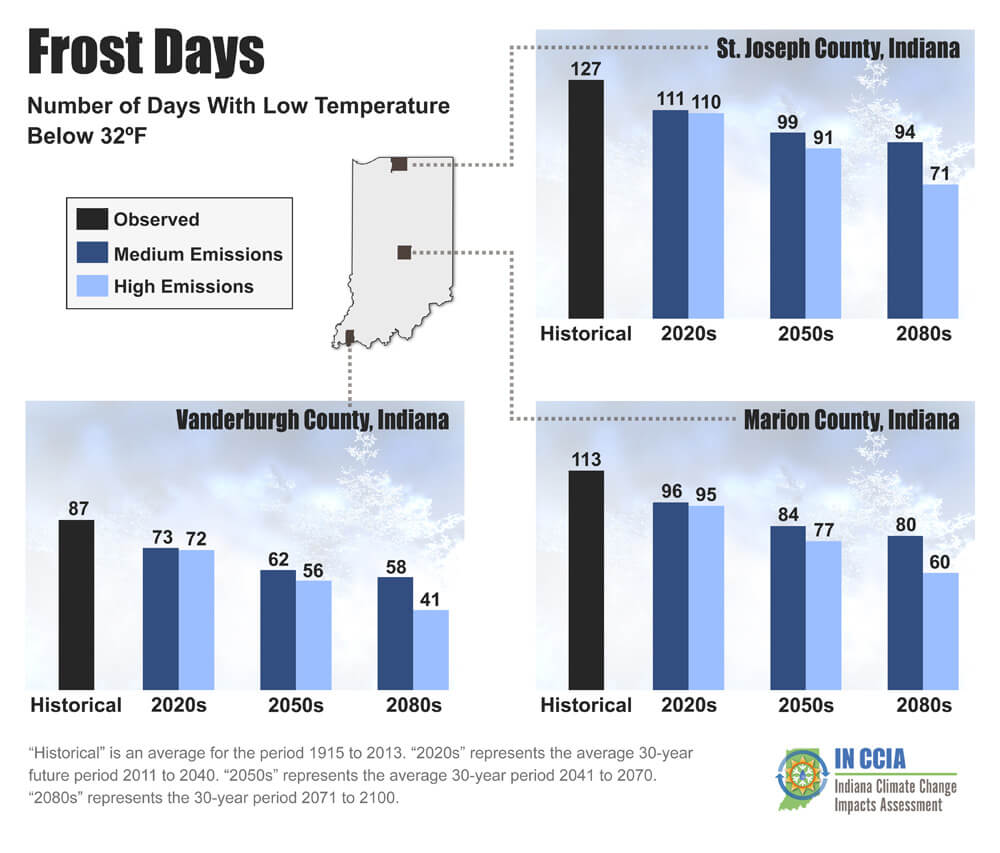
Indiana’s winter temperatures are projected to warm by 5°F to 6°F by midcentury5, with the average coldest night of the year expected to warm by about 6°F. Indiana will see fewer cold days where low temperatures drop below 5°F, and fewer frost days with temperatures below 32°F are expected. Overall, Indiana’s winter is projected to shorten by 20 to 25 days by midcentury, and up to 44 days by late-century6 (Chin et al., 2018). These temperature shifts will significantly affect winter hydrological processes including snowfall, snow cover, soil frost, runoff, streamflow, and flood risks.
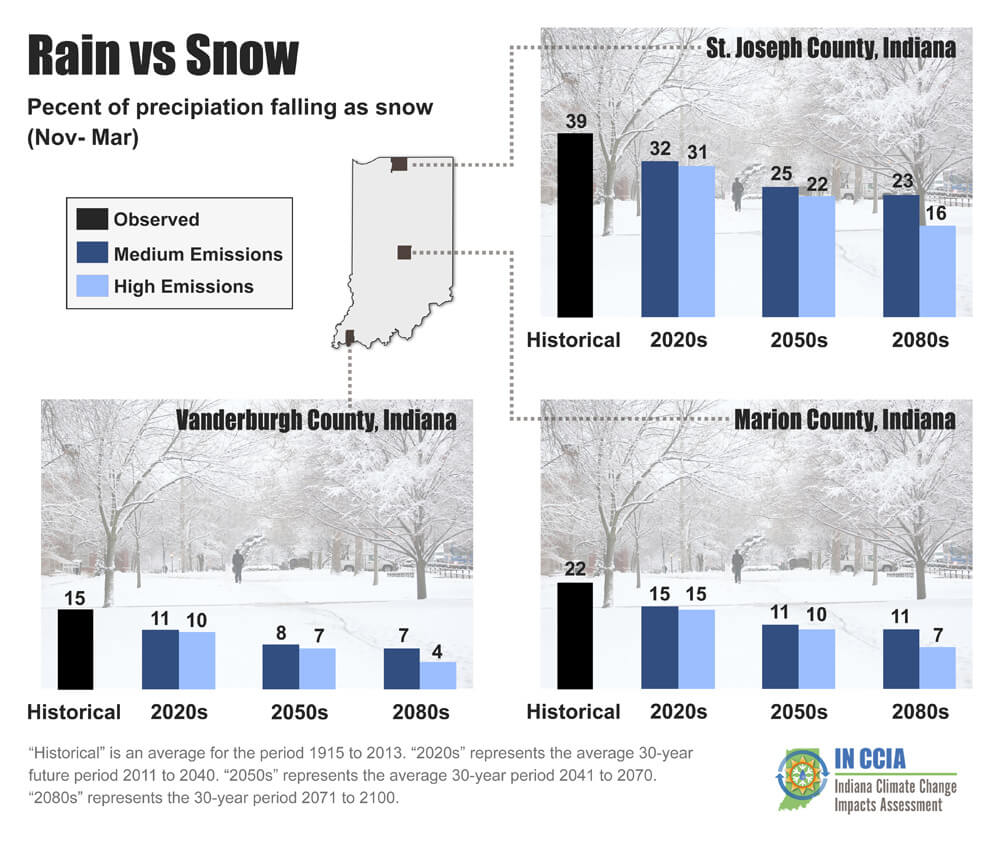
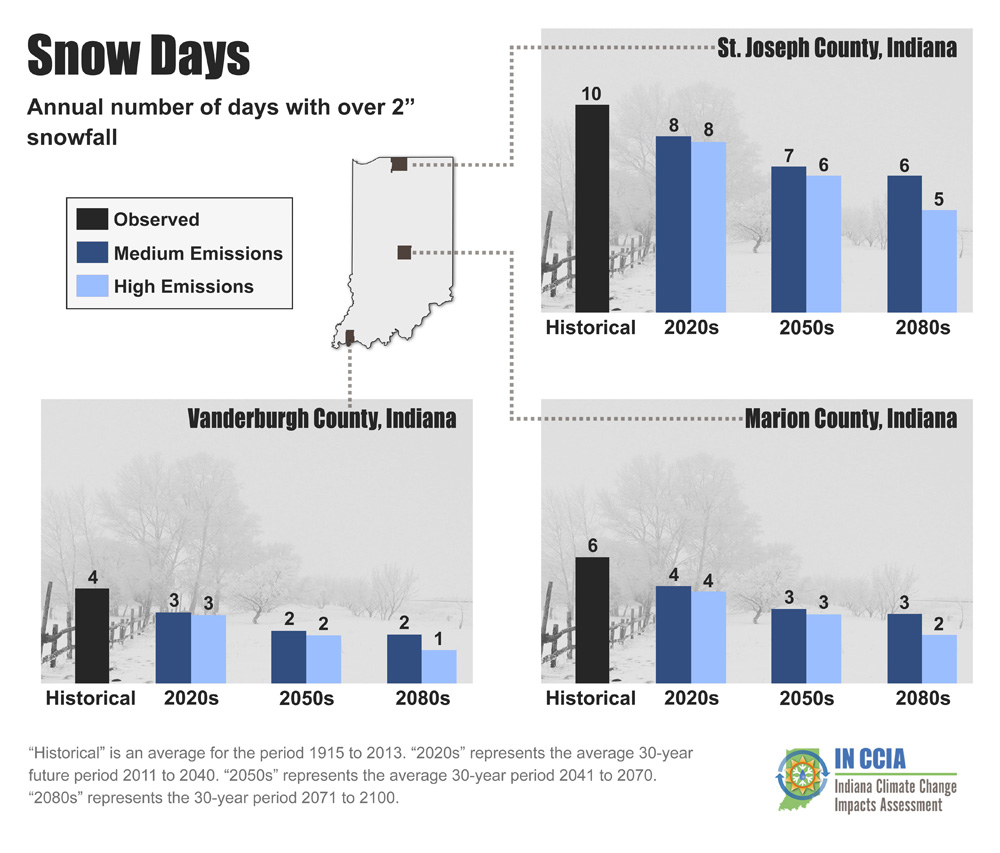
Although cold-season precipitation is expected to increase, a greater proportion will fall as rain instead of snow. In the north, snowfall7 will be greatly reduced compared to the past. Allen County, for example, is projected to see snowfall decline 36 to 42 percent by midcentury. In southern Indiana, where historically only about 15 percent of cold season precipitation has fallen as snow, there will be little snowfall at all by late century. In Vanderburgh County, snowfall is projected to decline 42 to 47 percent by midcentury and up to 65 percent by late-century. While the percent change in southern Indiana is similar to northern Indiana, it is important to remember these changes are relative to actual snowfall totals, meaning northern Indiana will see a greater total loss. (South Bend typically receives about three times as much snow as Evansville). Throughout the state, and under both emissions scenarios, the number of days per year with snowfall events greater than 2 inches will be halved by midcentury.
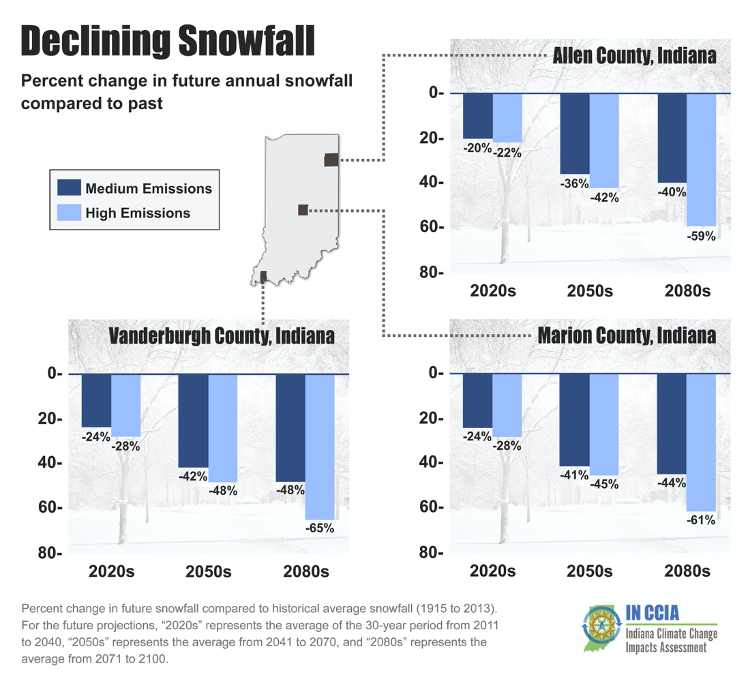
Percent change in annual snowfall for three Indiana counties. Percent change is relative to the historical average from 1915 to 2013. Data come from the IN CCIA analysis (Hamlet et al., 2019), which are based on averages from 10 climate model projections, includes a precipitation gauge under-catch correction for historical precipitation, and assumes a fixed snow-to-water density ratio (0.1).
As total snowfall declines, the number of days with snow on the ground is also expected to decline for all future periods and under all climate scenarios. On average, Indiana sees nearly 63 days per year of snow cover. By mid-century, that declines to about 37 to 42 days per year.
The snowpack measured using the snow water equivalence (SWE), the amount of liquid water with the same mass as the snow, will decline significantly by the middle of this century and decreases for all periods under all climate scenarios. Indiana’s average winter SWE is expected to decline by 50 to 61 percent by midcentury, with winter SWE declining up to 73 percent by late century.
These projected changes in the amount and form of winter precipitation affect future flood risks, as do other projected changes, including winter soil temperatures and soil frost. Thick snow can insulate soil, keeping its temperature higher. Ice in the soil prevents snow melt or rain from soaking in as quickly, leading to more runoff. Indiana is expected to see fewer days with snow, as noted, and much less soil frost. Those conditions are likely to help offset increases in flood risks from other winter processes.
Soil temperatures in the state are expected to rise for all future time periods and for both emissions scenarios. The historical average winter soil temperature in Indiana is just above 33°F, and that is expected to rise to nearly 35°F to 36°F by midcentury.
Warming soils also coincide with a reduction in the number of days with significant soil frost. Indiana historically sees about 50 days per year with significant soil frost, meaning frost that reaches 4 inches or more into the ground. Under the medium- and high-emission scenarios, the number of days with significant soil frost is expected to drop by 45 to 54 percent by midcentury.
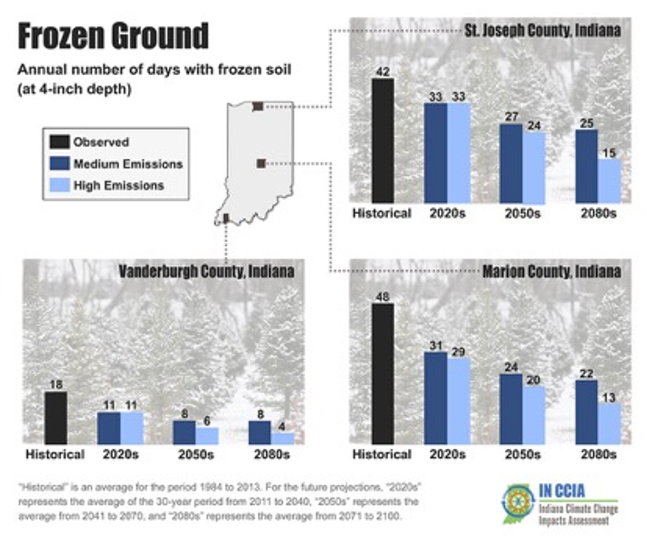
Number of days per year with frozen soil (at 4-inch depth) for three representative Indiana counties. “Historical” is the average for the period from 1984 to 2013. For future projections, “2020s” represents the average 30-year period from 2011 to 2040, “2050s” represents the average from 2041 to 2070, and “2080s” represents the average from 2071 to 2100.
Streamflow
Across most of Indiana, streamflow is on the rise. Of the 109 U.S. Geological Survey (USGS) streamflow monitoring sites, 98 report increased flow over the last 30 years. These trends in streamflow align with observed trends in precipitation, but attributing increased flows directly to climate change is difficult since land management and changing infrastructure play an important role in local flow. Still, multiple factors indicate that climate change, especially increasing precipitation, is a major driver. Past research looking exclusively at streamflow gages in areas with minimal land-use change found similar upward trends in streamflow (Hirsch and Ryberg 2012), and recent work from Ficklin et al. (2018) comparing streamflow trends in natural and human-modified waterways show climate change has a similar impact across those systems.
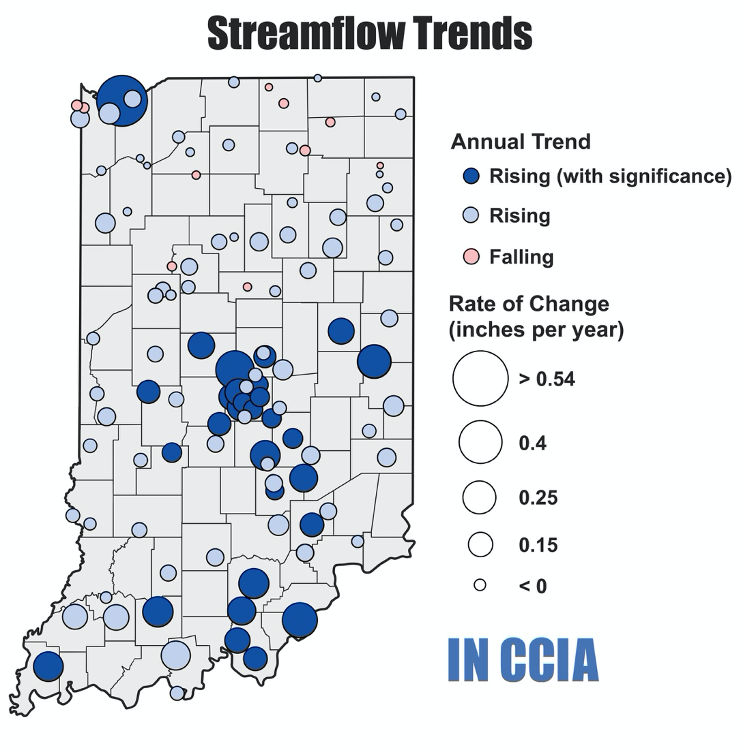
Annual average streamflow trend for the past 30 years for each USGS streamflow gauging station in the state. Trend is provided as change in inches per year over the watershed area, with increasing trends indicating an increase in observed streamflow. Source: State of Indiana Waters, accessed October 7, 2019.
Increased precipitation throughout Indiana is generally expected to result in higher annual streamflow, with increases primarily happening in the winter and spring seasons.
Future streamflow projections for three similar-size watersheds from north to south across the state show that monthly average streamflow from January through April is expected to increase under both scenarios by midcentury. May streamflow is projected to decrease between the mid- and late-century periods, with a reduction in streamflow for that month occurring in the St. Joseph River (northern) and Patoka River (southern) watersheds. Summer and fall streamflow is expected to decline compared to historical values, with larger declines in the south.
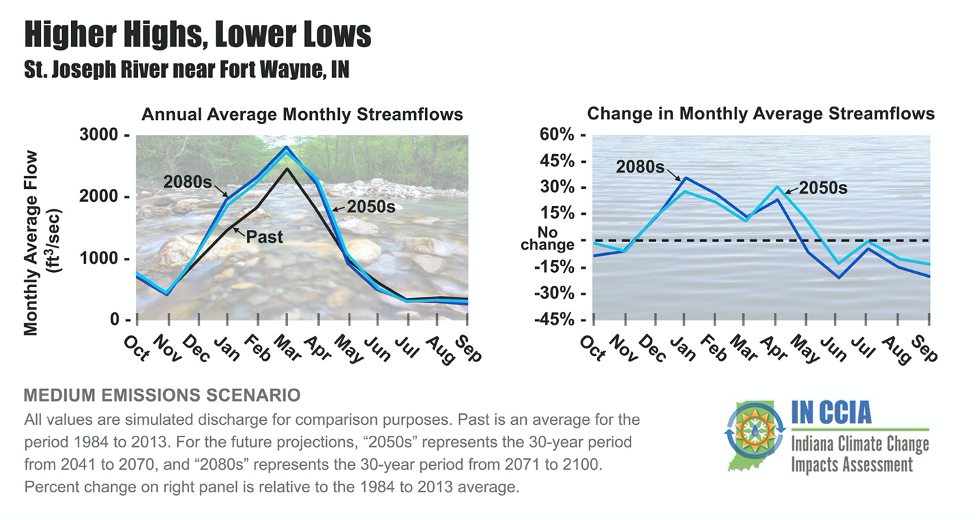
Past and future average monthly streamflow at three similar-size watersheds representing the northern, central and southern parts of the state. Left panels show streamflow for the past (1984-2013) and for two future periods based on a medium-emissions scenario. Right panels show the percent change in future projections compared to the past. The 2050s time period represents the average of the 30-year period from 2041 to 2070, and 2080s represents the average of the 30-year period from 2071 to 2100. All values are simulated discharge for comparison purposes. Projections for a high emissions scenario are available online. Source: Cherkauer et al. (2021)
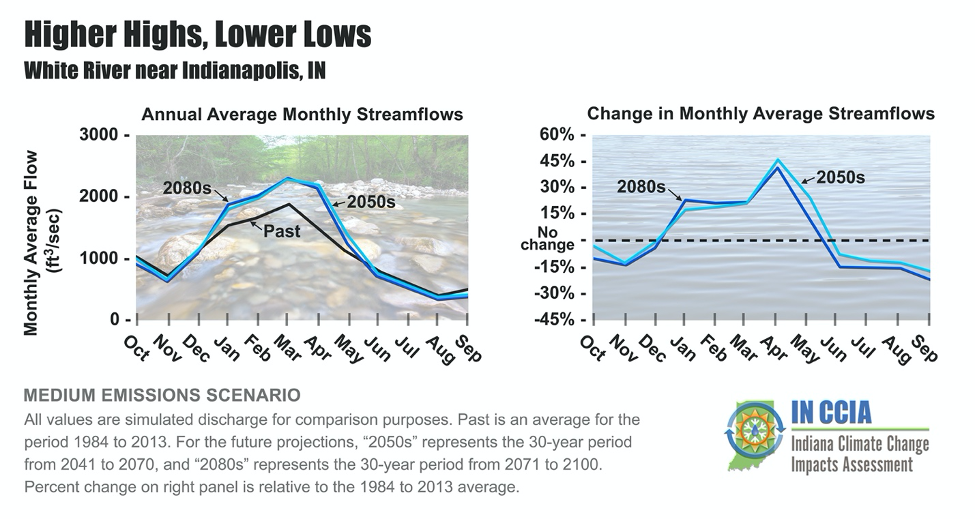
Past and future average monthly streamflow at three representative and similar-size watersheds representing the northern, central and southern parts of the state. Left panels show streamflow for the past (1984-2013) and for two future periods based on a medium-emissions scenario. Right panels show the percent change in future projections compared to the past. The 2050s time period represents the average of the 30-year period from 2041 to 2070, and 2080s represents the average of the 30-year period from 2071 to 2100. All values are simulated discharge for comparison purposes. Projections for a high emissions scenario are available online. Source: Cherkauer et al. (2021)

Past and future average monthly streamflow at three representative and similar-size watersheds representing the northern, central and southern parts of the state. Left panels show streamflow for the past (1984-2013) and for two future periods based on a medium-emissions scenario. Right panels show the percent change in future projections compared to the past. The 2050s time period represents the average of the 30-year period from 2041 to 2070, and 2080s represents the average of the 30-year period from 2071 to 2100. All values are simulated discharge for comparison purposes. Projections for a high emissions scenario are available online. Source: Cherkauer et al. (2021)
Highest monthly average flows are expected to remain centered on March, but with greater increases in streamflow in the months before and after the peak for most cases. The northern and central watersheds experience a shift in flow volumes to earlier in the year between the mid- and late-century periods. Timing of the months with the lowest average monthly flows is not expected to change, reflecting the end of the summer growing season and highest evapotranspiration period.
Despite lower average monthly flows in July, August and September, nearly all locations across the state are expected to see fewer total days with extremely low streamflow by midcentury. While this may sound counterintuitive at first, it results from the overall shift in streamflow toward generally wetter conditions. As the average flow increases, there will be more days with high flows (discussed in the “Flooding” section below), leaving fewer days available for low flows. Additionally, the projected increase in summer storm intensity results in greater variability in summer streamflow (Cherkauer and Sinha, 2010). By the end of the century, however, drier conditions are prevalent in late summer and early fall with smaller increases in low flows, or even decreases in some cases (Byun et al., 2019).
Climate Change and Water Quality
Seasonal shifts in rainfall and runoff patterns, coupled with warming temperatures, will have serious implications for our water quality. For example, extreme rainfall events in the spring can wash just-applied fertilizers off farm fields and into streams and rivers where these chemicals can cause excessive growth of harmful algae — and if this occurs in reservoirs, it can affect the quality and safety of drinking water. Additionally, extended warm periods and moderate sewage releases in urban areas can stimulate the growth of dangerous E. coli bacteria, threatening the health and safety of recreational boaters and canoers.
How we manage our natural and human systems can improve, or degrade, our water quality in a changing climate. For instance, some agricultural practices, such as cover crops, may reduce soil erosion during heavy rainfall events and could reduce the amount of sediment and nutrients entering local waterbodies compared to bare farmland. Many communities, including Indianapolis and West Lafayette, have recently modified storm and wastewater systems to better accommodate high-intensity storms. Adopting land and water management practices that build more resiliency to shifting climate conditions is a consideration that will become increasingly important in the coming decades.
Floods
River Flooding
Indiana’s projected wetter winters and springs will lead to higher average streamflow in the state’s rivers and a greater risk of flooding, making streams more susceptible to record flooding events when local weather events bring wet weather to the region.
Changes in peak-flow events are difficult to predict as they tend to be the product of unique combinations of hydrological and meteorological conditions (e.g., wet soils, conversion of snow to rainfall, increasing precipitation, snow melt). Historically, Indiana's monthly streamflow has been greatest in January through March, coinciding with cold season conditions. Although annual peak flows can occur in autumn through spring (Byun et al., 2019), the majority of the highest stage events occur in the months January to March, with 16 of the 25 highest crests recorded during those months for the USGS gauge on the Wabash River at Lafayette, IN (USGS 2023). Seven of the top 10 highest crests for the Tippecanoe River and four of the top 10 floods at the Patoka River USGS sites also fall within that date range (USGS 2020), highlighting the increased importance of antecedent snow conditions and snowmelt for the largest flood events in the northern most parts of the state.
Research from Byun et al. (2019) looked specifically at 100-year flood events8 throughout the Midwest and found that Indiana rivers show some of the largest projected increases in flood risk for the 20 Midwest rivers evaluated. For the high-emissions scenario for the 2080s, the Kankakee River at Wilmington, IL, is projected to experience about a 20 percent increase in the rate of streamflow associated with the 100-year flood, and the Wabash River at Mt. Carmel, IL, (just across the IN border) is projected to experience a more than 50 percent increase in the 100-year flood. In a separate analysis using the same methods, the St. Joseph River 9 at Niles MI (just across the IN border) is projected to experience a 45 percent increase in the 100-year event by the 2080s.
Future flooding simulations, such as those referenced above, assume that land-use practices and drainage activities within the watershed remain the same through the 2080s planning horizon. Predicting the impacts of changes in land use (likely including an increase in impervious areas) and agricultural drainage activities (likely including an increase in density of subsurface drainage and surface ditching) is difficult to predict. However, these impacts will likely result in even greater increases for high-flow events and subsequent flooding.
Estimating Extremes is Difficult, Especially in a Changing Environment
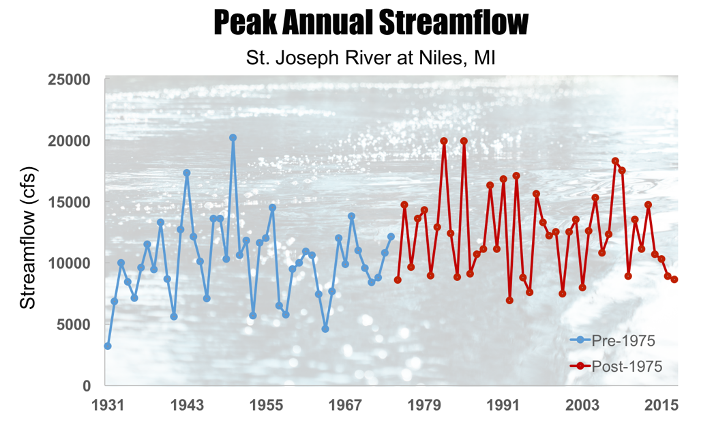
This chart shows the annual peak streamflow in the St. Joseph River9 (at Niles, MI) from 1971 to 2017 (Source: USGS, 2023). Pre- and post-1975 are denoted in blue and red, respectively. The post-1975 mean is 21 percent higher than pre-1975 mean (P=0.0014), implying that flood risk is increasing over time.
High-impact, low-probability events – like those described as a 100-year flood or a 500-year rainfall event – shape the way we build drainage systems, where we build houses, how we price insurance and much more. Scientists estimate the likelihood of these extreme events using statistical analysis of historical events (and the longer the record the better!) The assumption is that what happened in the past is relevant and a good representation of what may happen in the future. This is a concept known as stationarity.
Unfortunately, many recent studies have shown that, with the changes in climate we have been witnessing and that we expect in the future, stationarity is no longer a valid assumption. That means what was once a low-probability event could actually be occurring more frequently, now or in the future. So, while we reference specific event probabilities in this report, those should be viewed as signifying the relative magnitude of events as opposed to a reliable estimate of the probability of occurrence of a given event.
In-field Flooding
Wetter springs will cause more soil-water storage, putting fields near or at saturation more often. Since saturated soils can hold no more water because all the pore space is already filled, there is an increased likelihood of water ponding in field depressions or flowing over the land as surface runoff. Farmers are trying to deal with this by increasing the density of subsurface drainage, but such changes do not help when waterways in the larger region are overwhelmed. Additionally, the short-circuiting brought about by additional subsurface drainage and surface ditching is expected to exacerbate the increase in runoff volumes and peak discharges experienced in downstream areas.
Runoff, which can be used to estimate the risk of in-field ponding or flooding, is expected to increase in winter and spring when precipitation rises, but decrease in the summer and fall. By mid-century, total runoff is expected to increase 8 percent under the medium-emission scenario and 9 percent under the high-emission scenario. By the end of the century, runoff increases could approach 20 percent. Increases in winter and spring, and decreases in summer and fall, are fairly consistent throughout the state.
Urban Flooding
Significant portions of urban landscapes are dominated by impervious surfaces, such as buildings and pavement, that force water to flow into stormwater transport and detention facilities. With increased winter and spring precipitation, detention systems may reach capacity sooner and cause urban flooding. The problems are compounded by continuing floodplain development and levee construction that have left many urban streams and rivers with nowhere to direct increased discharge.
Cities may need to consider upgrades to stormwater systems and changes to stormwater management practices that reduce storm flow and increase infiltration, including reducing the footprints of impervious surfaces and increasing vegetation and wetland space. For communities such as Fort Wayne, Indianapolis, and South Bend, this has meant working far beyond the city limits on a systemwide basis to restore floodplains and influence agricultural practices. Depending on the types of management practices considered, system upgrades may provide an opportunity for municipalities to capture more winter and spring precipitation to recharge groundwater
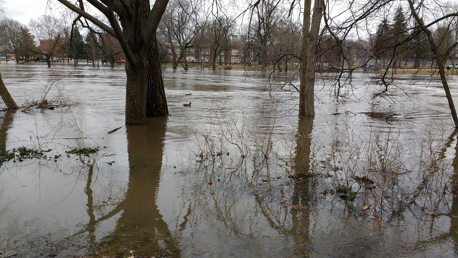
Recent flooding events have provided a preview of climate change impacts. In February 2018, a severe rain-on-snow event in the St. Joseph River9 basin resulted in an approximately 2,500-year flood4, causing widespread damage from river and groundwater flooding and sewer backflows. Pictured here is the 2018 flood at peak high water in the St. Joseph River9 near Northshore Drive and N. Lafayette Blvd. in South Bend, IN. The water levels almost exceeded the maximum measurement height of the USGS gauge at Niles, MI.
Droughts
Drought duration, the number of consecutive days on which severe drought affects a location, is not expected to change over the next century (Mishra et al., 2010). Wetter future conditions are expected to reduce the intensity of drought, meaning fewer extreme and exceptional drought events. However, the occurrence of “flash droughts” – sudden onset, short-duration events – may rise, leading to more frequent bursts of drought conditions over wider areas, especially late in the growing season when crops can be adversely affected.
Key Knowledge Gaps
Some aspects of Indiana’s future climate remain poorly understood, partly because climate models have relatively low resolution. For instance, Indiana receives much of its summer precipitation in convective storms; many of these storms are too small to be represented in the climate models typically used. The same is true of lake-effect snow storms in winter. In the future, higher-resolution climate models and approaches that increase the resolution of weather-related processes over small areas will give us a better understanding of how these small-scale storms may change. That, in turn, will improve projections of heavy rains, runoff, erosion, and soil water.
Some components of Indiana’s water resources, such as groundwater, are not being simulated, and we have limited understanding about how use and demand will change in the coming decades. For other components, such as soil water and water temperature, historical observations are sparse, and this limits scientists’ ability to improve future simulations. Researchers are still working to understand how to best characterize storm and flood event probabilities, which are based on past events and lose their meaning in a shifting climate.
Arguably one of our biggest knowledge gaps is understanding how human decisions will exacerbate or counter the expected impacts from a changing climate. Are current best practices for managing water extremes sufficient in an altered climate? Will communities have the financial resources and political will to proactively refresh aging infrastructure that may be at heightened failure risk from intense storms? How much can downstream communities or farms adapt to water stress in the absence of a basin-wide approach to water management? What new conflicts will arise as people adapt to change – for instance, if farmers increase groundwater use to irrigate crops? None of these actions happen in isolation, and it is unclear how many cascading impacts will unfold.
Conclusions
As Indiana warms and precipitation patterns continue to shift, the state’s invaluable water resources are at risk. Climate change has direct and indirect effects on the hydrological cycle, affecting the timing and intensity of rainstorms, altering water demand and use patterns, and influencing water quality. All of these translate to measurable and tangible impacts on Hoosier communities, businesses, and families.
This assessment provides a localized look at the future of Indiana’s water resources and highlights the growing challenges facing Hoosier professionals and decision-makers who are tasked with keeping our water safe and accessible. While many of the projected impacts are challenging, it is critical for Hoosiers to recognize the important role, and potential, of human behavior and decisions. How we manage our land, build our communities, plan for hazards, and interact with the natural environment will strongly influence the severity of local climate change impacts.
References
Bowling, L., Widhalm, M., Cherkauer, K., Beckerman, J., Brouder, S., Buzan, J., Doering, O., Dukes, J.S., Ebner, P., Frankenberger, J., Gramig, B., Kladivko, E., Lee., C., Volenec, J, and Weil, C. 2018. Indiana’s Agriculture in a Changing Climate: A Report from the Indiana Climate Change Impacts Assessment. Purdue Climate Change Research Center, Purdue University. West Lafayette, Indiana. DOI: 10.5703/1288284316778
Byun, K. 2019. A Comprehensive Framework for Projecting Regional Climate Change Impacts and Analyzing Non-Stationary Statistics of Hydrologic Extremes over the Midwest and Great Lakes Region (Doctoral Dissertation). Retrieved from https://curate.nd.edu/show/2227mp51h3s.
Byun, K., C.-M. Chiu, A.F. Hamlet. 2019: Effects of 21st Century Climate Change on Seasonal Flow Regimes and Hydrologic Extremes over the Midwest and Great Lakes Region of the U.S., Science of the Total Environment, 650(1):1261-1277, DOI:10.1016/j.scitotenv.2018.09.063
Byun, K. and A.F. Hamlet. 2018. Projected Changes in Future Climate over the Midwest and Great Lakes Region Using Downscaled CMIP5 Ensembles. International Journal of Climatology, DOI 10.1002/joc.5388
Cherkauer, K.A., Bowling, L., Byun, K., Chaubey, I., Chin, N., Ficklin, D., Hamlet, A., Kines, S., Lee, C., Neupane, R., Pignotti, G., Rahman, S., Singh, S., Valappil, F.P., and T. Williamson. (2021). Climate change impacts and strategies for adaptation for water resource management in Indiana. Climatic Change, 163. 10.1007/s10584-021-02979-4.
Cherkauer, K.A., and T. Sinha. 2010. Hydrologic Impacts of Projected Future Climate Change in the Lake Michigan Region. Journal of Great Lakes Research 36 (January): 33–50. https://doi.org/10.1016/j.jglr.2009.11.012.
Chin, N., Byun, K., Hamlet, A.F., and K.A. Cherkauer. 2018. Assessing potential winter weather response to climate change and implications for tourism in the U.S. Great Lakes and Midwest. Journal of Hydrology 19:42-56.
Ficklin, D.L., Abatzoglou, J.T., Robeson, S.M., Null, S.E., and J.H. Knouft. 2018. Natural and Managed Watersheds Show Similar Responses to Recent Climate Change. Proceedings of the National Academy of Sciences 115 (34): 8553 LP-8557. https://doi.org/10.1073/pnas.1801026115.
Hamlet, A., Byun, K., Robeson, S., Widhalm, M., and M. Baldwin. (2019). Impacts of Climate Change on the State of Indiana: Ensemble future projections based on statistical downscaling. Climatic Change, https://doi.org/10.1007/s10584-018-2309-9.
Hirsch, R.M., and K.R. Ryberg. 2012. Has the Magnitude of Floods across the USA Changed with Global CO2 Levels? Hydrological Sciences Journal 57 (1): 1–9. https://doi.org/10.1080/02626667.2011.621895.
Mishra, Vimal, Keith A. Cherkauer, and Shraddhanand Shukla. 2010. Assessment of Drought Due to Historic Climate Variability and Projected Future Climate Change in the Midwestern United States. Journal of Hydrometeorology 11 (February): 46–68. https://doi.org/10.1175/2009JHM1156.1.
USGCRP. 2017. Climate Science Special Report: Fourth National Climate Assessment, Volume I [Wuebbles, D.J., D.W. Fahey, K.A. Hibbard, D.J. Dokken, B.C. Stewart, and T.K. Maycock (eds.)]. U.S. Global Change Research Program, Washington, DC, USA, 470 pp.
United States Geological Survey (2021) USGS water use data for Indiana. USGS's National Water Use Information Program, National Water Information System. https://waterdata.usgs.gov/in/nwis/wu. Accessed Jul 2021.
United States Geological Survey (2023) The USGS National Water Dashboard. https://doi.org/10. 5066/F7P55KJN.
Widhalm, M., Hamlet, A. Byun, K., Robeson, S., Baldwin, M., Staten, P., Chiu, C., Coleman, J., Hall, E., Hoogewind, K., Huber, M., Kieu, C., Yoo, J., Dukes, J.S. 2018. Indiana’s Past & Future Climate: A Report from the Indiana Climate Change Impacts Assessment. Purdue Climate Change Research Center, Purdue University. West Lafayette, Indiana. DOI:10.5703/1288284316634
End Notes
1Indiana’s average annual temperature has warmed 1.2°F over the last century. By the middle of the 21st century, Indiana’s annual temperature is expected to increase by 5°F to 6°F, with up to 10°F warming by century’s end. Additional information about expected changes in Indiana’s temperature is available in the IN CCIA report Indiana’s Past and Future Climate.
2There are two St. Joseph Rivers in northern Indiana. This mention refers to the tributary to the Maumee River that is near Fort Wayne, Indiana, and drains to Lake Erie.
3Precipitation frequency estimates are one common way to describe heavy rainfall events, and they are essential for infrastructure design. These estimates are defined as “the depth of precipitation at a specific location for a specific duration that has a certain probability of occurring in any given year” (MetStat Innovations). For example, a 5-year, 48-hour storm event would describe the maximum 48-hour rainfall amount that has a probability of recurring once every 5 years (or a 20 percent chance of happening in any given year). The actual amount of rainfall that would qualify as a 5-year, 48-hour storm is specific to each location, and these data are available from the National Oceanic and Atmospheric Administration (NOAA) via their Atlas 14 publication, and the Precipitation Frequency Data Server (PFDS; https://hdsc.nws.noaa.gov/hdsc/pfds/). Completing the example above, according to NOAA, a 5-year, 48-hour storm event in Indianapolis, Indiana would occur if 4.06” of rain fell in a 48-hour period.
4Although estimating extreme event return intervals in a changing (i.e., non-stationary) environment is challenging, we can nonetheless quantify these recent extremes in the context of a quasi-stationary historical record. According to NOAA's most recent Atlas 14 data set, for example, 8 inches of rain in 24 hours in South Bend is approximately a 500-year event. However, we estimate the 2016 storm as a 1,000-year event because some precipitation gauges in South Bend showed numbers substantially higher than 8 inches.
5Compared to the state’s average temperature from 1971-2000.
6Length of winter is defined as the number of days between the first and last occurrence of at least 6 days with a daily average temperature of less than 41°F.
7Snowfall analysis assumes a fixed 0.1 snow-to-water density ratio.
8The 100-year flood event is the river discharge rate with a 1 percent chance of occurring in any year. As with precipitation frequency, flood event probabilities are location-specific.
9There are two St. Joseph Rivers in northern Indiana. This mention refers to the river that drains into Lake Michigan.
How to Cite
Cherkauer, K.A., Barr, R., Bowling, L., Byun, K., Chaubey, I., Chin, N., Chiu, C., Ficklin, D., Hamlet, A., Kines, S., Lee, C., Neupane, R., Pignotti, G., Rahman, S., Singh, S., Valappoil, F.P., Williamson, T., Widhalm, M., and J.S. Dukes. (2023). The future of Indiana’s water resources: A Report from the Indiana Climate Change Impacts Assessment. Purdue Climate Change Research Center, Purdue University. West Lafayette, Indiana. DOI: 10.5703/1288284317640.
IN CCIA Water Resources Working Group
- Keith Cherkauer, Purdue University (Lead)
- Robert Barr, Indiana University-Purdue University Indianapolis
- Laura Bowling, Purdue University
- Kyuhyun Byun, University of Notre DameA
- Indrajeet Chaubey, Purdue UniversityB
- Natalie Chin, Purdue UniversityC
- Chun-Mei Chiu, University of Notre Dame
- Darren Ficklin, Indiana University
- Alan Hamlet, University of Notre Dame
- Stephen Kines, Purdue University
- Charlotte Lee, Purdue University
- Ram Neupane, Indiana UniversityD
- Garett Pignotti, Purdue UniversityE
- Sanoar Rahman, Purdue University
- Sarmistha Singh, Purdue UniversityF
- Femeena Pandara Valappil, Purdue UniversityG
- Tanja Williamson, U.S. Geological Survey, Ohio-Kentucky-Indiana Water Science Center
A Now at Incheon National University, South Korea
B Now at University of Connecticut
C Now at University of Wisconsin Sea Grant
D Now at Texas Water Development Board
E Now at Washington State University, Vancouver
F Now at Indian Institute of Technology, Palakkad
G Now at Penn State University
Acknowledgments
We thank Brian Wallheimer for drafting this report, Stan Coffman for assistance with graphics, and numerous staff from Purdue University’s Department of Agricultural Communication for help with the production and release of the report. We are grateful to Nina Collins and Marcia Wilhelm-South from the Purdue University Libraries Scholarly Publishing Division for online publication support for all documents associated with the IN CCIA. We give special thanks to Andrew Pappas (Indiana State Department of Health), Gabriel Filippelli (IUPUI), Siavash Beik (Christopher B. Burke Engineering), and many other for reviewing and improving this report.
The Purdue Climate Change Research Center was integrated into Purdue’s Institute for a Sustainable Future in 2022. Indiana Climate Change Impacts Assessment continues to be supported by the Institute and the College of Agriculture and all reports continue to be available at ag.purdue.edu/indianaclimate/. Information about the Institute is available at research.purdue.edu/isf/.