

Indiana Corn Update - Issue #28
Importance of Corn Harvest Timing and Potential Impacts on Kernel Dry Weight
(Daniel Quinn & Evan Cohagan)
Each fall and winter, one common question that we often receive is specific to the idea of “phantom yield loss” or “invisible” reductions in harvested yield that occur when corn is left standing in the field after physiological maturity. In many cases, phantom yield loss is hypothesized as losses in yield due to losses in kernel dry matter caused by seed respiration as harvest is delayed. Early research conducted in Indiana suggested that kernel dry matter losses could occur during field dry down as corn grain moisture declined below approximately 25% (Nielsen, 1996). More recently, private and industry-led trials have continued to raise concerns about so-called “phantom yield loss,” often attributing perceived yield reductions to seed respiration during extended field dry down (https://www.agweb.com/news/crops/farm-journal-test-plots/farm-journal-test-plots-phantom-lurks-your-corn-fields). In contrast, recent peer-reviewed research from Iowa has largely refuted these claims (Parvej et al., 2019). Given these contrasting findings and continued grower interest in this topic, we sought to re-examine the effects of harvest timing on kernel dry matter using current hybrids and modern management practices in 2025 to better understand how harvest decisions influence corn yield potential. This project is also supported by the Indiana Corn Marketing Council.
Corn physiological maturity (growth stage R6), commonly referred to as “black layer”, represents the point at which corn kernels reach their maximum dry matter accumulation. From a yield standpoint, this is important because grain yield is effectively fixed once black layer forms. Physiological maturity typically occurs 55 to 65 days after silking (R1 growth stage) and when kernel moisture is still relatively high, often near 30 to 35%. After R6, the primary change occurring in the crop is grain dry down. This process is driven largely by environmental conditions and occurs at an average rate of about 0.5 percentage points of moisture per day, though this rate is often highly variable due to multiple factors. Dry down tends to be fastest in September, slows considerably in October, and becomes minimal by November as temperatures decline. Cool temperatures, high humidity, and limited solar radiation can further slow dry down and prolong the period corn must remain in the field until it is ready to harvest. In addition, hybrid genetics can also influence post-maturity dry down. Traits such as husk tightness, ear orientation, husk leaf number, and tip exposure can all affect the rate at which moisture can escape. In addition, longer-season hybrids often reach physiological maturity at higher moisture levels, which can delay harvest readiness even if they eventually dry at similar rates. These genetic differences help explain why harvest timing can vary substantially among hybrids planted in the same field.
Beginning in 2025, research trials were established in West Lafayette (ACRE) and Columbia City (NEPAC), Indiana to assess the impacts of harvest timing on kernel dry weight across different hybrids (Pioneer P1136AM, P0953AM, and Dekalb DKC105-35, DKC56-26) and with and without the inclusion of a foliar fungicide application at the R1 growth stage (Figures 1 and 2). In this study multiple ears (15+) were sampled from each individual plot beginning at a grain moisture of 28% and finishing at a grain moisture of 16%, with additional targeted harvest intervals of 24% and 20%. Each individual ear that was sampled was assessed for sample moisture at the time of harvest and then dried to a consistent moisture and to assess total dry weight via a sub-sample of 1000 kernels.

Figure 1. Relationship between corn grain harvest moisture and kernel dry weight at the Agronomy Center for Research and Education (ACRE) in West Lafayette, IN. Kernel dry weights presented is a total dry weight of 1000 kernels taken from sampled ears at each harvest timing and adjusted to a dry moisture of 15.5%. Each individually colored point and line represent an individual corn hybrid and whether or not the hybrid received a fungicide application at the R1 growth stage.
Across our 2025 research trials, we observed no relationship between targeted harvest moisture and kernel dry weight (Figures 1 and 2). Even examining both data figures presented in this article you can notice the “mess” of different colored points and lines which represent different hybrids and the inclusion or exclusion of fungicide. Overall, this data shows no significant relationship between harvest moisture and kernel dry weight across two Indiana locations, four different hybrids and different management practices in this study. Therefore, our preliminary results suggest that kernel dry weight is not being lost via “phantom yield loss” with the proposed primary mechanism of kernel dry matter losses via seed respiration as harvest is delayed. This preliminary result tracks very closely with recent research from Iowa which showed across multiple years, planting dates, and hybrids there was no evidence found of kernel dry matter loss during in-field dry down, confirming that yield potential was not declining due to respiration or biochemical degradation of the grain. In addition, the researchers also found grain quality traits, including protein, oil, and starch concentration also changed very little between black layer and harvest, further supporting the conclusion that kernels themselves are not losing yield or quality as they dry in the field.
Therefore, recent research has shown that kernel dry matter remains stable after black layer and as harvest timing is delayed, meaning yield potential is preserved across typical harvest windows. However, harvest timing still matters because yield losses can occur through physical mechanisms rather than physiological ones. As harvest is delayed, risks of stalk lodging, ear drop, disease development (e.g., ear rots and mycotoxin accumulation), insect damage, and harvest inefficiencies increase, particularly later in the fall. In addition, grain test weight generally improves as grain dries but reaches a plateau once grain reaches a moisture of 20 – 23%, after which further field drying provides limited grain quality benefit, while increasing exposure to potential weather-related losses. Together, these findings further clarify that so-called “phantom yield loss” is likely not driven by kernels losing weight via seed respiration, but likely by reduced grain recovery due to a multitude of potential factors as corn stands longer in the field. From a management standpoint, the goal is to balance grain moisture, drying costs, and field loss risk. In many cases, harvesting before grain moisture drops below approximately 20%, especially in fields with weak stalks or high disease pressure, can help protect yield and improve harvest efficiency.

Figure 1. Relationship between corn grain harvest moisture and kernel dry weight at the Northeast Purdue Agricultural Center (NEPAC) in Columbia, City, IN. Kernel dry weights presented is a total dry weight of 1000 kernels taken from sampled ears at each harvest timing and adjusted to a dry moisture of 15.5%. Each individually colored point and line represent an individual corn hybrid and whether or not the hybrid received a fungicide application at the R1 growth stage.
Cover Crop Termination and Timing
(Maria Carolina Souza, Emmanuel Cooper, Estevan Cason, and Tommy Butts)
Overview
Cover crops play an important role in resilient agricultural systems by improving soil health, reducing erosion, increasing water retention, and helping suppress weeds (Figure 1). Many cover crop options are available, with cereal rye being one of the most commonly used in the Midwest. As we approach the growing season, a common question arises: when is the right time to terminate cover crops? This is an important consideration to maintain crop yield, while maximizing weed suppression capabilities.

Figure 1. The ability of cover crops (cereal rye) to suppress weed emergence (left) compared with abundant weed emergence when no cover crop is employed (right).
Weed Suppression
Delaying cover crop termination as much as is feasible can be beneficial from a weed management standpoint. Allowing the cover crop to grow longer increases biomass production, leading to greater weed suppression. Previous research suggests that about 4,500 pounds of biomass per acre can reduce waterhemp density by 50% or more. Collaborative research led by the University of Wisconsin–Madison Weed Science team involving Purdue and multiple other universities, identified that this amount of biomass can typically be achieved when cereal rye reaches approximately 30 inches in height when using seeding rates of about 60 pounds per acre. Therefore, terminating cereal rye at or beyond this height may optimize weed suppression. Additionally, applying a residual herbicide at termination can further improve weed control, including lengthened control of problematic summer annual weeds like waterhemp (Figure 2).

Figure 2. Reduction in pigweed (waterhemp and Palmer amaranth) density counts when combining PRE residual herbicides with cover crop usage. Figure courtesy of Dr. Rodrigo Werle, Extension Weed Scientist, University of Wisconsin-Madison.
Termination Timing
For corn, delaying cereal rye termination to at- or after-planting can be a concern because it strongly competes for nitrogen. In general, it is recommended to terminate cereal rye approximately two weeks before planting corn to avoid negative growth and yield-limiting impacts. Alternatively, the Midwest Cover Crops Council recommends planting oats or radish as the cover crop of choice when rotating to corn and applying starter fertilizer to help minimize the risk of nutrient deficiencies. If utilizing these cover crop species, termination timing can occur up to corn planting.
For soybean, research has shown a wider window for effective termination with some farmers choosing to plant green, which involves planting soybean directly into a standing cover crop prior to termination (Figure 3). Recent collaborative research conducted across soybean producing states has shown that terminating cereal rye up to the soybean cotyledon stage resulted in significant improvements in waterhemp suppression while not impacting soybean yield.

Figure 3. Soybean planted into cereal rye cover crop terminated at planting (planting green). The picture was taken two weeks after planting.
Regardless of cropping system, the absolute latest that cover crop termination can occur is immediately when transitioning into a reproductive growth stage (i.e., for cereal rye, right at anthesis). This helps ensure a greater likelihood of termination success regardless of the method used. However, as previously mentioned, successful implementation into weed management programs has occurred when terminating cereal rye at a 30” height, and this earlier timing can make sure there is not too much biomass that may hinder effective planting of the cash crop (i.e., resulting in poor soil to seed contact and/or open seed furrows).
Methods for Cover Crop Termination
Cover crops can be terminated using herbicides, tillage, mowing, winterkill, or roller-crimping, with herbicides being the most common approach. The timing of termination strongly influences herbicide selection. If termination occurs after cash crop emergence, options will be limited to herbicides that are selective for the cash crop. In addition to terminating the cover crop, the herbicide applied may also control weed escapes. Therefore, it is important to consider the entire scenario (cover crop species and height, weed species present, and the cash crop being planted) when selecting the most appropriate herbicide program.
Overall, glyphosate is a good option for terminating multiple cover crop species, and its performance can typically be improved when combined with other herbicides. Cereal rye and oats are terminated successfully with glyphosate. The addition of glufosinate may further improve control and help manage weeds that are resistant to glyphosate; however, be aware of season use limitations in-crop if using glufosinate in a burndown. Crimson clover and Austrian winter pea can be terminated with a combination of glyphosate and 2,4-D. As mentioned earlier, including a residual herbicide in the mixture can provide extended weed control, especially on problematic summer annual weeds like waterhemp. However, one note to make, some herbicide combinations can be antagonistic, particularly when applied in less-than-ideal weather conditions (cool and wet). For example, atrazine has been shown to negatively impact glyphosate activity when trying to terminate cereal rye (Figure 4). Finally, always ensure that the herbicides used are labeled for burndown, preplant, or preemergence applications for the cash crop you intend to plant, and make sure to observe any necessary plant back intervals.

Figure 4. Some herbicide mixes can cause antagonism in our burndowns, particularly if weather conditions are less than ideal. For example, in this image, atrazine can negatively impact glyphosate when trying to terminate cereal rye. Image courtesy of Dr. Travis Legleiter, Extension Weed Scientist, University of Kentucky.
For more information on recommended herbicide tank-mixtures for cover crop termination or burndown applications, please see the 2026 Weed Control Guide, which can be found here: https://extensionpubs.osu.edu/category-2c-agricultural-weed-control-2026/.
Additional information
- Elucidating waterhemp (Amaranthus tuberculatus) suppression from cereal rye cover crop biomass
https://www.cambridge.org/core/services/aop-cambridge-core/content/view/A823543261088B71A200D530983A4301/S0043174524000213a.pdf/elucidating_waterhemp_amaranthus_tuberculatus_suppression_from_cereal_rye_cover_crop_biomass.pdf - Influence of cover crop termination strategies on weed suppression, concentration of residual herbicides in the soil, and soybean yield
https://www.cambridge.org/core/services/aop-cambridge-core/content/view/6A5A62CDED30F6158D26B37D4552F73A/S0043174525100593a.pdf/influence_of_cover_crop_termination_strategies_on_weed_suppression_concentration_of_residual_herbicides_in_the_soil_and_soybean_yield.pdf - Midwest Cover Crop Council – Indiana Cover Crop Recipe – Post Soybean, Going to Corn: Use Oats/Radish
https://www.midwestcovercrops.org/2018/12/10/indiana-cover-crop-recipe-post-soybean-going-corn-use-oatsradish/ - Midwest Cover Crop Council – Indiana Cover Crop Recipe – Post Wheat, Going to Soybean or Corn: Use Oats and Radish Mix
https://www.midwestcovercrops.org/2023/10/26/indiana-cover-crop-recipe-post-wheat-going-to-soybean-or-corn-use-oats-and-radish-mix/ - Midwest Cover Crop Council – Termination
https://www.midwestcovercrops.org/termination/ - Terminating Cover Crops - Successful Cover Crop Termination with Herbicides https://www.extension.purdue.edu/extmedia/ws/ws-50-w.pdf
Understanding Nitrous Oxide Emissions from Corn Fields
(Bruno Scheffer & Dan Quinn)
Nitrous oxide (N2O) is a greenhouse gas that can significantly impact the climate. Molecule for molecule, it traps nearly 300 times more heat than carbon dioxide (CO2) in the atmosphere (IPCC, 2021). In corn production systems, most N2O emissions occur in the soil after nitrogen (N) fertilizer is applied. Soil microbes convert N into different forms through processes called nitrification and denitrification, and N2O can be released during these transformations (Firestone & Davidson, 1989).
N fertilizer is essential for achieving high corn yields, but when N is lost as N2O, it means two things: N is leaving the field, and dollars are being lost. Understanding when and why these emissions occur can help improve N use efficiency (NUE) and reduce environmental impacts.
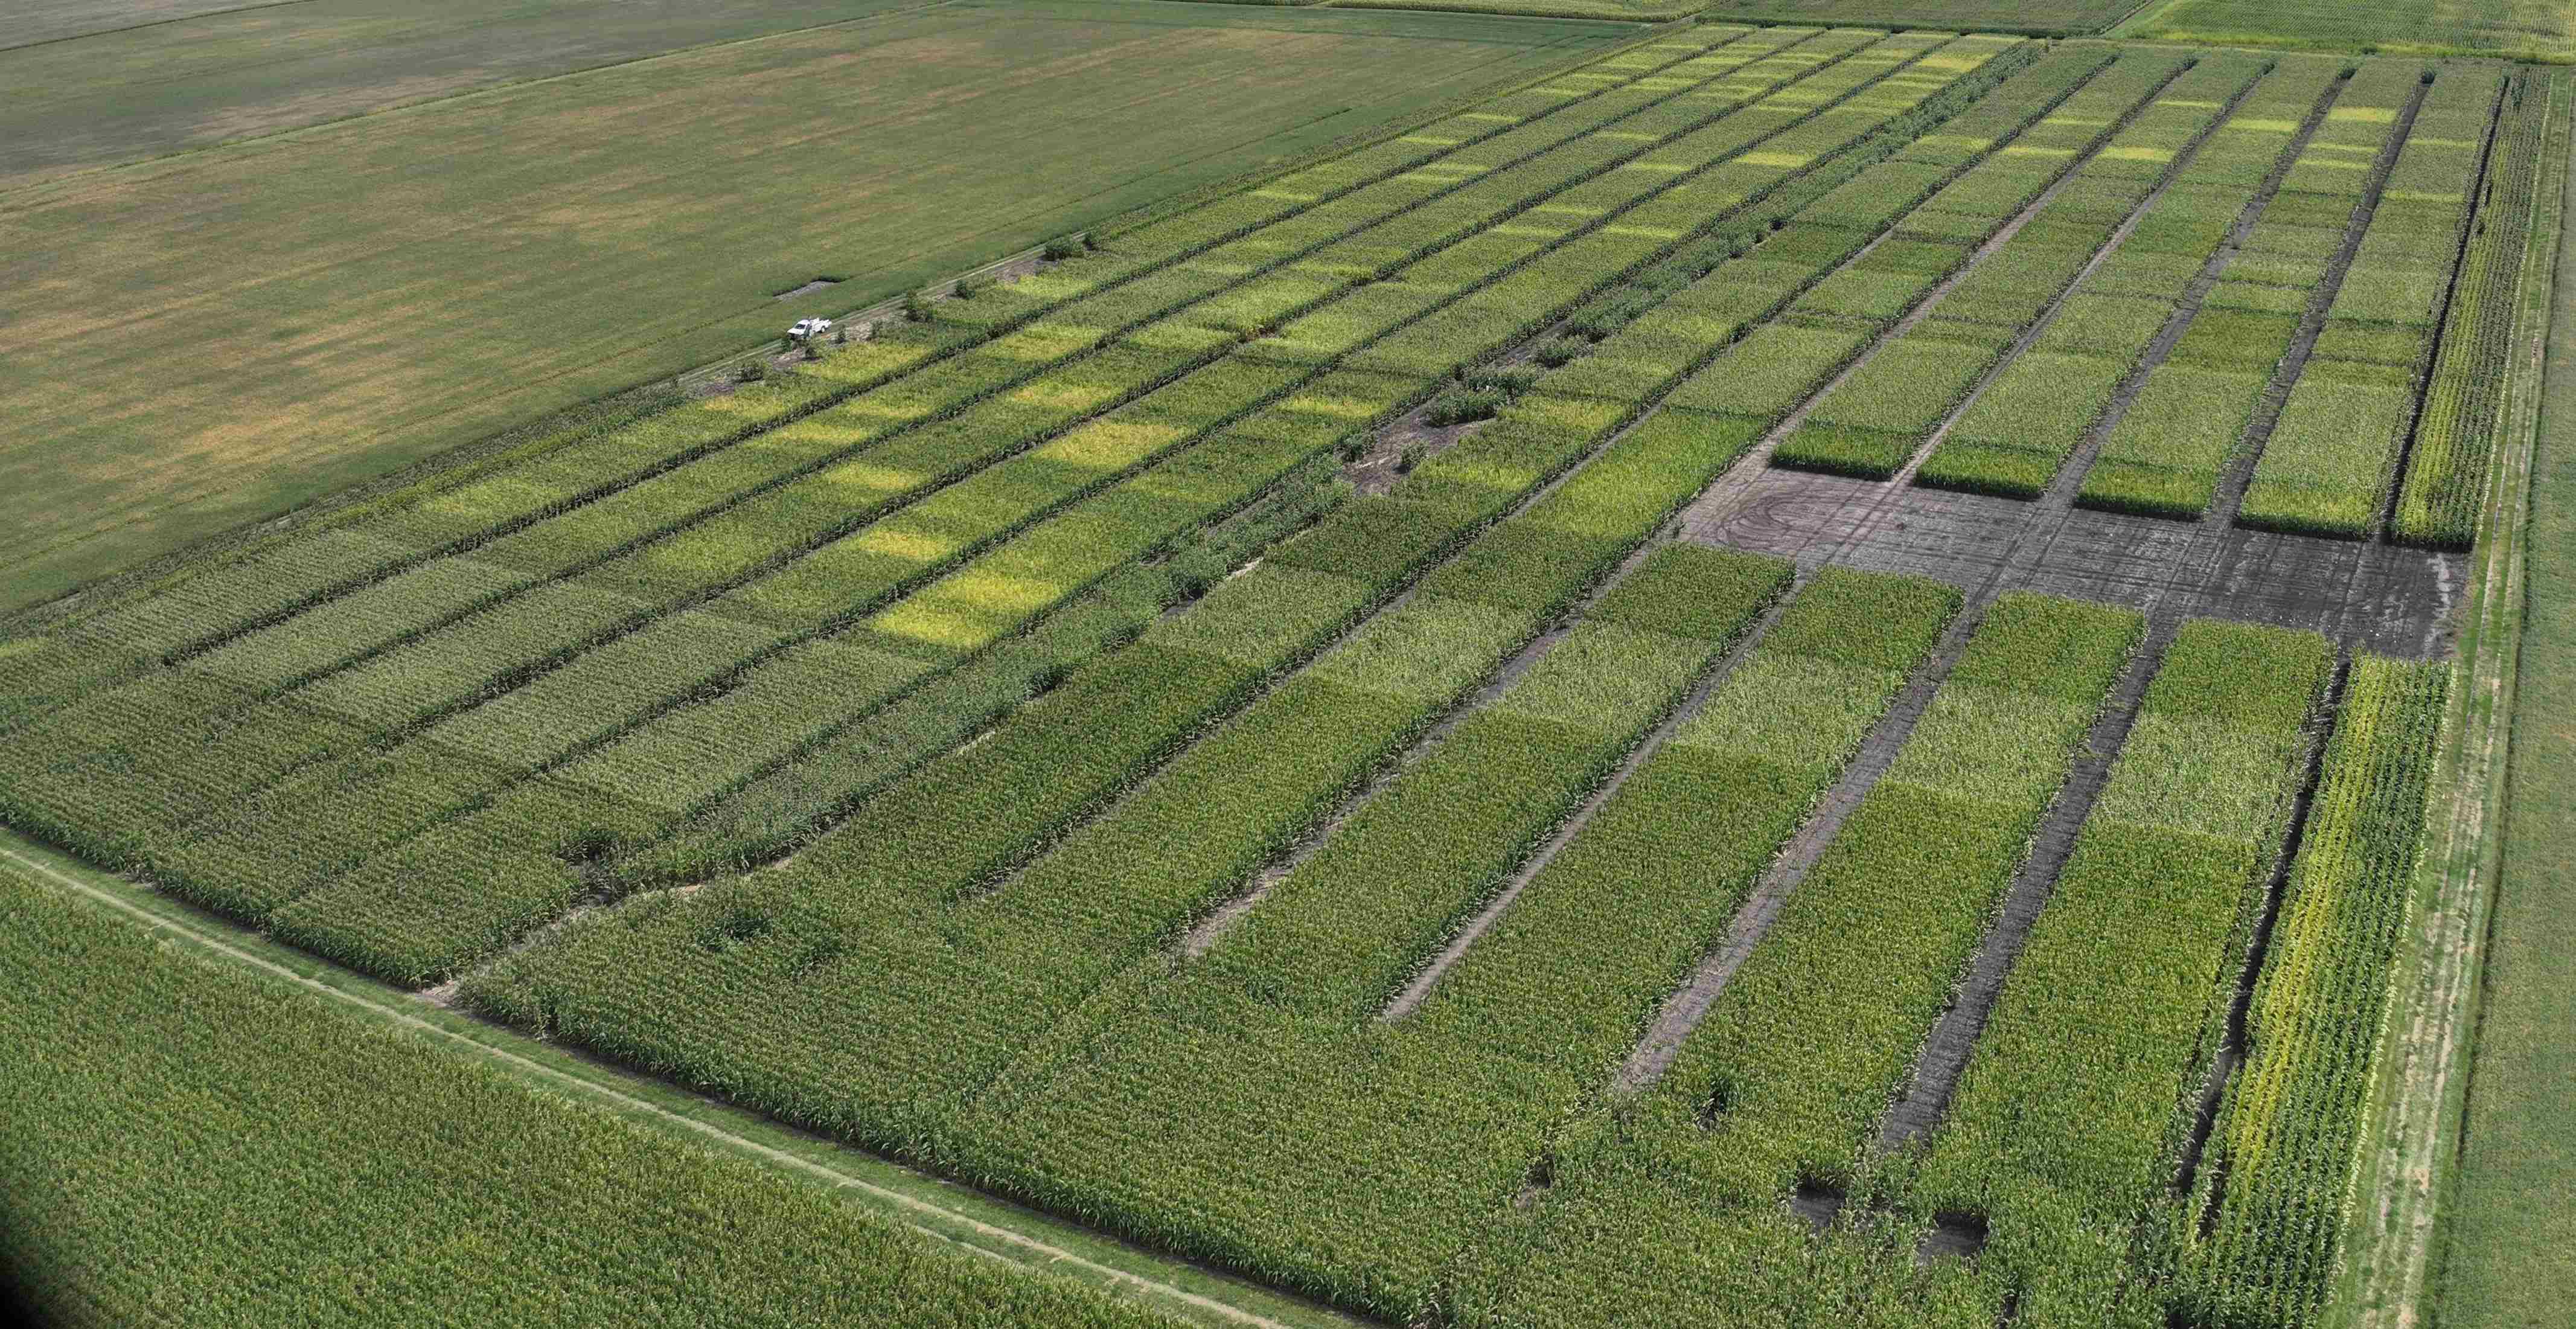
With that in mind, an NRCS-funded research project was conducted during the 2025 growing season at the Purdue Agronomy Center for Research and Education (ACRE) in West Lafayette, Indiana, as part of an NRCS-funded research project (Figure 1). The goal was to better understand how N management affects N2O emissions in corn fields. We focused on two questions:
- How do different N fertilizer rates affect N2O emissions throughout the growing season?
- Do different corn hybrids influence N2O emissions from the soil?

Figure 1. Drone image at the NRCS research trial at ACRE, West Lafayette, IN. Black rectangles represent the whole trial; yellow represents the zero N treatments; purple circles represent installed collars for N2O measurements.
N rate is already known to be a major driver of N2O emissions. However, crop genetics may also play a role. Hybrids can differ in traits such as root architecture, N uptake efficiency, and canopy development. These plant traits influence how N moves through the soil–plant system and how much N remains available for soil microbes. Some studies suggest that crop varieties can influence soil N cycling and greenhouse gas emissions through these plant–soil interactions (Guardia et al., 2016; Venterea et al., 2012). For that reason, we evaluated both N rate and hybrid type in this trial.
All treatments received 40 lb N/ac at planting, except for the zero-N control. N was then applied at the V4 growth stage as a sidedress application using multiple rates. This resulted in total seasonal N rates ranging from 0 to 240 lb N/ac. We evaluated two corn hybrids: PR111 20SSC, a short-stature hybrid; and DKC62-70, a conventional full-stature hybrid.
To measure N2O emissions, soil collars were installed in selected plots (Figure 2, on the left), and gas flux was measured repeatedly throughout the growing season using chamber-based gas measurements (Figure 2, on the right). These measurements allow us to track how emissions change over time and how they respond to management and environmental conditions.

Figure 2. Installed collar for N2O measurements after sidedress application (left) and LICOR Gas analyzer chamber used to measure N2O at the NRCS-funded research trial at ACRE, West Lafayette, IN.
Why N2O Emissions Occur in Corn Fields?
Most N2O emissions in corn systems are produced by soil microbes through two main processes. During nitrification, microbes convert ammonium (NH4+) into nitrate (NO3−). Small amounts of N2O can be released as a byproduct during this process (Firestone & Davidson, 1989). During denitrification, microbes convert nitrate into N gases (N2O and N2). This process occurs when soil becomes wet, and oxygen becomes limited. Under these conditions, microbes use nitrate rather than oxygen during respiration, leading to N2O losses (Butterbach-Bahl et al., 2013).
Both processes depend heavily on three soil factors: available N, moisture, and temperature. Because these conditions change throughout the season, N2O emissions often occur in short but intense bursts, especially after fertilizer applications and rainfall events.
Seasonal Patterns in N2O Emissions
To better understand emission patterns over time, we used generalized additive models (GAMs; Figure 3) to estimate the average daily N2O flux following sidedress N application.

Figure 3. GAMs showing mean daily N2O flux (nmol m-2 s-1) by treatment over time after the N sidedress application at V4 (Day zero in the figure) during the corn growing season at the NRCS-funded research trial at Agronomic Center for Research and Education (ACRE), West Lafayette, IN.
Two clear emission peaks were observed during the monitoring period, occurring around June 15 and June 19, both following rainfall events, suggesting that these were likely triggered by rainfall occurring shortly after sidedress N application. When rainfall increases, soil water content rises, and soil pores fill with water rather than air, reducing oxygen availability. Under these partially anaerobic conditions, denitrifying microbes rapidly convert nitrate (NO3−) into gaseous N2O.
Additionally, at this early stage of the growing season, fertilizer N had been applied recently, and crop N uptake was still relatively low. As a result, a large pool of nitrate was present in the soil. The combination of available nitrate, wet soil conditions, and warm early-summer temperatures created favorable conditions for short-term emission pulses.
This type of rainfall-driven emission spike has been widely observed in corn production systems. In many cases, a large portion of seasonal N2O loss can occur during only a few wet periods following fertilizer application (Parkin & Kaspar, 2006; Venterea et al., 2012).
Statistical Comparison of Peak Emissions
To better understand treatment responses, N2O emissions were analyzed during the two main peaks identified in the GAM analysis: June 15th (Figure 4) and June 19th (Figure 5).

Figure 4. Average N2O emissions statistical differences using Mann-Whitney U. (< 0.1) by N rate and hybrids on June 15th, 2025, at the NRCS trial in West Lafayette, IN.
No statistically significant differences were detected between the short stature hybrid (PR111 20SSC) and the full stature hybrid (DKC62-70). This suggests that, under the conditions of this study, hybrid architecture alone did not strongly influence soil N2O emissions. However, hybrid traits such as root growth, N uptake efficiency, and interactions with soil microbes can influence N cycling in the soil (Guardia et al., 2016). Because of these potential plant–soil interactions, hybrid differences in N losses remain an important area for future research.

Figure 5. Average N2O emissions statistical differences using Mann-Whitney U. (< 0.1) by N rate and hybrids on June 19th, 2025, at the NRCS trial in West Lafayette, IN.
However, higher N rates generally produced greater N2O flux, particularly during rainfall-driven emission events. This relationship between N availability and N2O emissions has been widely reported across agricultural systems (Venterea et al., 2012). Interestingly, although the 240 lb N/ac treatment tended to produce higher emissions than lower rates, there was no statistical difference between the 120 and 240 lb N/ac treatments during the peak emission periods. This suggests that once N availability exceeds crop demand, additional N may not proportionally increase emissions during individual events. However, excess N remains vulnerable to loss through multiple pathways.
Role of Rainfall and Soil Moisture
One of the strongest drivers of N2O emissions observed in this study was rainfall timing.
Rainfall following fertilizer application creates ideal conditions for N2O production. Rain increases soil moisture and reduces oxygen availability in the soil, which stimulates microbial activity and promotes denitrification (Butterbach Bahl et al., 2013).
Previous studies have shown that a large portion of seasonal N2O emissions can occur during just a few rainfall events (Parkin & Kaspar, 2006). Because of this, fertilizer applications followed by heavy rainfall represent one of the highest risk periods for N loss.
Temperature Effects on N2O Emissions
Soil temperature also plays an important role in N2O emissions. As soil temperatures increase in late spring and early summer, microbial activity increases and N transformation processes proceed more quickly (Butterbach-Bahl et al., 2013).
Warm temperatures alone do not necessarily lead to large emissions, but when warm conditions occur alongside wet soils and available N, the conditions are ideal for N2O production. This interaction among fertilizer timing, rainfall, and temperature helps explain why emissions peak often are early in the growing season.
Practical Implications
Nitrous oxide emissions are not only an environmental concern. They also represent lost N fertilizer that could otherwise be used by the crop.
N lost as N2O:
- Cannot be recovered by the crop
- Represents wasted fertilizer investment
- Reduces NUE
Research like this helps identify management strategies that can improve N efficiency while reducing N losses. Potential strategies include:
- Using N rates that match realistic yield goals
- Splitting N applications when possible
- Applying N closer to periods of peak crop uptake
- Paying attention to weather forecasts before fertilizer applications
Improving N management helps protect both farm profitability and environmental sustainability.
Take Home Messages
- N2O emissions often occur in short bursts following rainfall events after N fertilizer applications
- Higher N rates generally increase emissions, especially under wet and hot conditions
- No differences in emissions were detected between the short-stature and full-stature hybrids in this study.
Understanding when N losses occur can help farmers make more informed N management decisions and improve NUE.
References
- Butterbach-Bahl, K., Baggs, E. M., Dannenmann, M., Kiese, R., & Zechmeister-Boltenstern, S. (2013). Nitrous oxide emissions from soils: how well do we understand the processes and their controls? Philosophical Transactions of the Royal Society B: Biological Sciences, 368(1621), 20130122. https://doi.org/10.1098/rstb.2013.0122
- Firestone, M. K., & Davidson, E. A. (1989). Microbiological basis of NO and N2O production and consumption in soil. In M. O. Andreae & D. S. Schimel (Eds.), Exchange of Trace Gases Between Terrestrial Ecosystems and the Atmosphere (pp. 7–21). John Wiley & Sons.
- Guardia, G., Vallejo, A., Cardenas, L. M., Dixon, E. R., & García-Marco, S. (2016). Fate of 15N labelled ammonium nitrate with or without the nitrification inhibitor DMPP in an irrigated maize crop. Agriculture, Ecosystems & Environment, 219, 78–88. https://doi.org/10.1016/j.agee.2015.12.012
- IPCC. (2021). Climate Change 2021: The Physical Science Basis. Contribution of Working Group I to the Sixth Assessment Report of the Intergovernmental Panel on Climate Change. Cambridge University Press. https://doi.org/10.1017/9781009157896
- Parkin, T. B., & Kaspar, T. C. (2006). Nitrous oxide emissions from corn–soybean systems in the Midwest. Journal of Environmental Quality, 35(4), 1496–1506. https://doi.org/10.2134/jeq2005.0183
- Venterea, R. T., Halvorson, A. D., Kitchen, N., Liebig, M. A., Cavigelli, M. A., Del Grosso, S. J., Motavalli, P. P., Nelson, K. A., Spokas, K. A., Singh, B. P., Stewart, C. E., Ranaivoson, A., Strock, J., Collins, H., & Baker, J. (2012). Challenges and opportunities for mitigating nitrous oxide emissions from fertilized cropping systems. Frontiers in Ecology and the Environment, 10(10), 562–570. https://doi.org/10.1890/120062
Acknowledgments
The authors greatly appreciate the feedback and contributions of all growers, county agents, consultants, and corn industry stakeholders.
Proudly Supported by: ![]()
Get the Latest Corn Agronomy Insights
Subscribe to receive research highlights, field insights, and management updates from Purdue’s Corn Agronomy program.
SUBSCRIBEPurdue
Corn Agronomy
Related News
Indiana corn progress, mycotoxins & weather
Indiana corn planting progress, & weather
Indiana corn planting progress, Late Planted Corn Hybrid Decisions, mycotoxins & weather
Indiana corn planting progress, flooding stresses, and corn ear rot & mycotoxins
Early weed control, planting conditions, and nitrogen–sulfur management influence corn...
One of the more unusual issues showing up in Indiana corn fields this summer is “tassel...