Dashboards make our food system more understandable by consumers and by the people working throughout the food system.
This dashboard shows price changes and trends (since 2010) of various food items.
This dashboard reports average food prices and their trends over time for various food items across three perspectives.
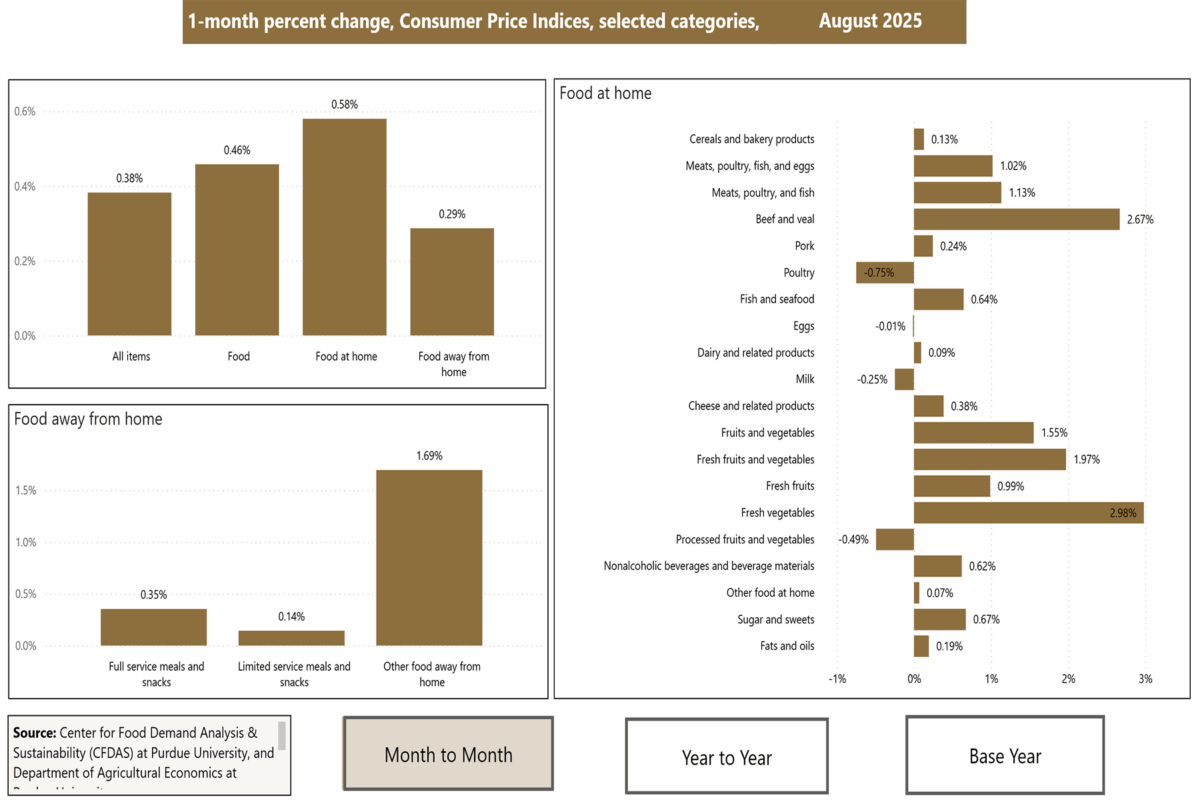
This dashboard shows the latest changes in the U.S. Bureau of Labor Statistics’ Consumer Price Index (CPI) for various food items with options to view changes month to month, year to year, and base period for easy comparison.
This dashboard provides the average cost of a cheeseburger over time, the cost of each ingredient of the cheeseburger over time and the inflation-adjusted cost of a cheeseburger over time, based on data from the U.S. Bureau of Labor Statistics.
This assessment tool estimates diet quality based on a short survey that elicits consumption frequency for nine food types: fruits, vegetables, whole grains, refined grains, fish or seafood, legumes/nuts/seeds, low‐fat dairy, high‐fat dairy, and sweets.
This dashboard shows common shopping and eating habits across a variety of demographic factors.
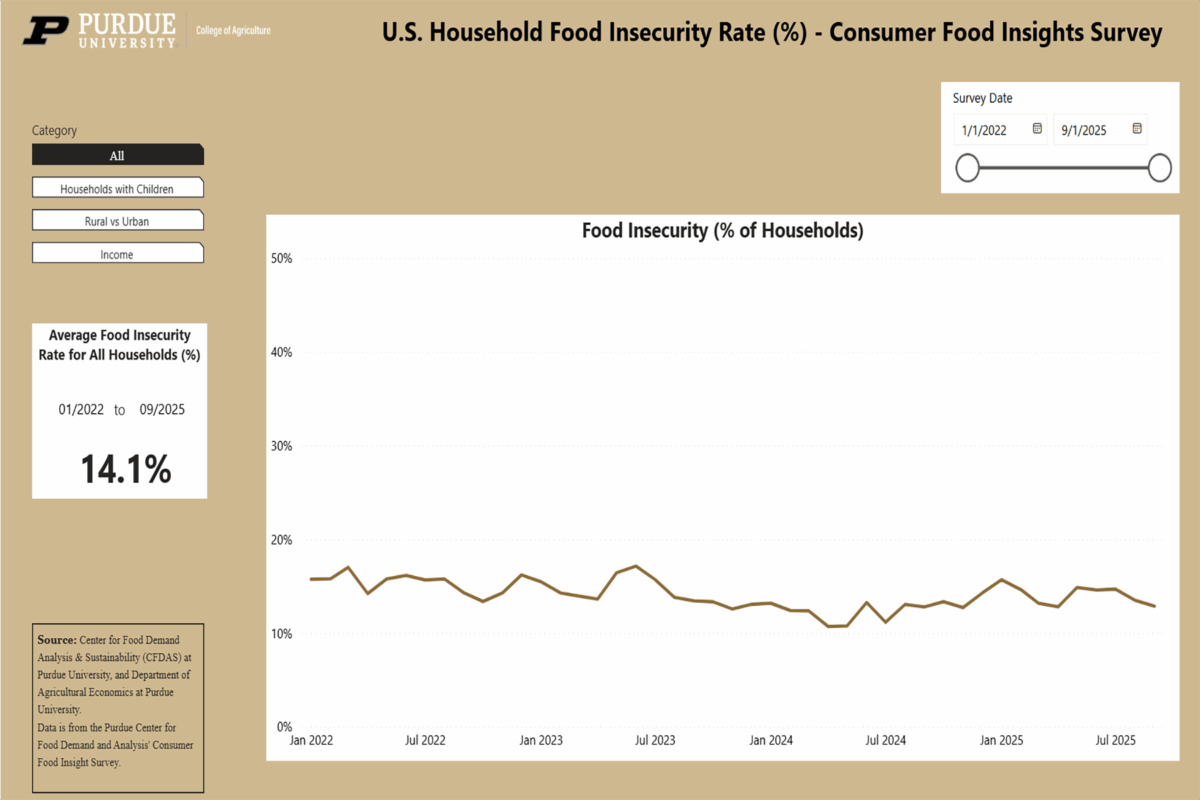
The U.S. Food Insecurity dashboard tracks the national rate of food insecurity by aggregating academic, governmental and nonprofit survey data.
This dashboard summarizes U.S. household food insecurity as estimated in the Consumer Food Insights survey, our monthly survey of 1,200 consumers from across the country.
This dashboard explores the sentiment and volume of #Meat mentions across three sources – social, news and other.
This dashboard provides insight into consumer food expenditures by year and by household income.
The Food Sector Wages and Hours Worked dashboard tracks trends from January 2006 to the latest CPI publish date. Featured sectors include food wholesalers, food processing, grocery and other food retailers.
The Changes in Food Sector Wages and Hours Worked dashboard tracks trends in percentage changes from January 2006 to the latest CPI publish date. Featured sectors include food wholesalers and food processing, among others.
This dashboard explores the economic profile of all U.S. states for three selected food service industries – “Restaurants and Other Food Industry”, “Food Services Industry” and “Drinking Places Industry.”
This dashboard shows the estimated number of agricultural workers with COVID-19. The map and table show the total number of COVID cases in each state.
The U.S. food and beverage industries are the connection between the agriculture and grocery retail sectors.
This dashboard presents the estimated production value that could be lost due to COVID-19 illness among industry workers.
This dashboard characterizes the vulnerability of input purchases for each food industry within each U.S. state.
This dashboard provides the average cost of a cheeseburger for different categories across the U.S.
The Egg Prices dashboard tracks daily prices and trends across the U.S. for different types of eggs, including Cage-Free, Conventional, Free-Range, Organic and Pasture-Raised.
The dashboard provides the National Average Price, Price per Meal item, Price Point and Price Ranking by State for a 12-person Thanksgiving meal.
The Casual Dining Sales dashboard tracks trends in dining sales based on sample debit and credit card transactions.
The Food Delivery Sales dashboard tracks trends in dining sales based on sample debit and credit card transactions.
The Trends in Convenience Store Sales dashboard tracks sales at convenience stores based on a sample of debit and credit card transactions. The location of the debit/credit cardholder is based on the cardholder’s address in the financial institution’s records.
The Trends in Dollar Stores Sales dashboard tracks sales at dollar stores based on a sample of debit and credit card transactions. The location of the debit/credit cardholder is based on the cardholder’s address in the financial institution’s records.
The Trends in Food and Beverage Sales dashboard tracks sales for food and beverages based on a sample of debit and credit card transactions. The location of the debit/credit cardholder is based on the cardholder’s address in the financial institution’s records.
The Trends in Food Services Sales dashboard tracks sales for food services based on a sample of debit and credit card transactions. The location of the debit/credit cardholder is based on the cardholder’s address in the financial institution’s records.
The Trends in General Retail Sales dashboard tracks retails sales based on a sample of debit and credit card transactions. The location of the debit/credit cardholder is based on the cardholder’s address in the financial institution’s records.
The Trends in Grocery Delivery Sales dashboard tracks sales for grocery delivery based on a sample of debit and credit card transactions. The location of the debit/credit cardholder is based on the cardholder’s address in the financial institution’s records.
The Trends in Grocery Sales dashboard tracks grocery sales based on a sample of debit and credit card transactions. The location of the debit/credit cardholder is based on the cardholder’s address in the financial institution’s records.
Accessibility Tools