
Only 37% of surveyed individuals selected taste preferences as the most important factor they consider when shopping for groceries online, which sharply contrasts with long-reported food purchasing values, where taste typically ranks first when shopping in person, according to the February Consumer Food Insight Report (CFI).
While Thanksgiving traditions may remain constant—the perfectly roasted turkey, creamy mashed potatoes, warm dinner rolls—the price tags attached to these holiday staples tell a story of market shifts and ongoing challenges in the poultry industry.
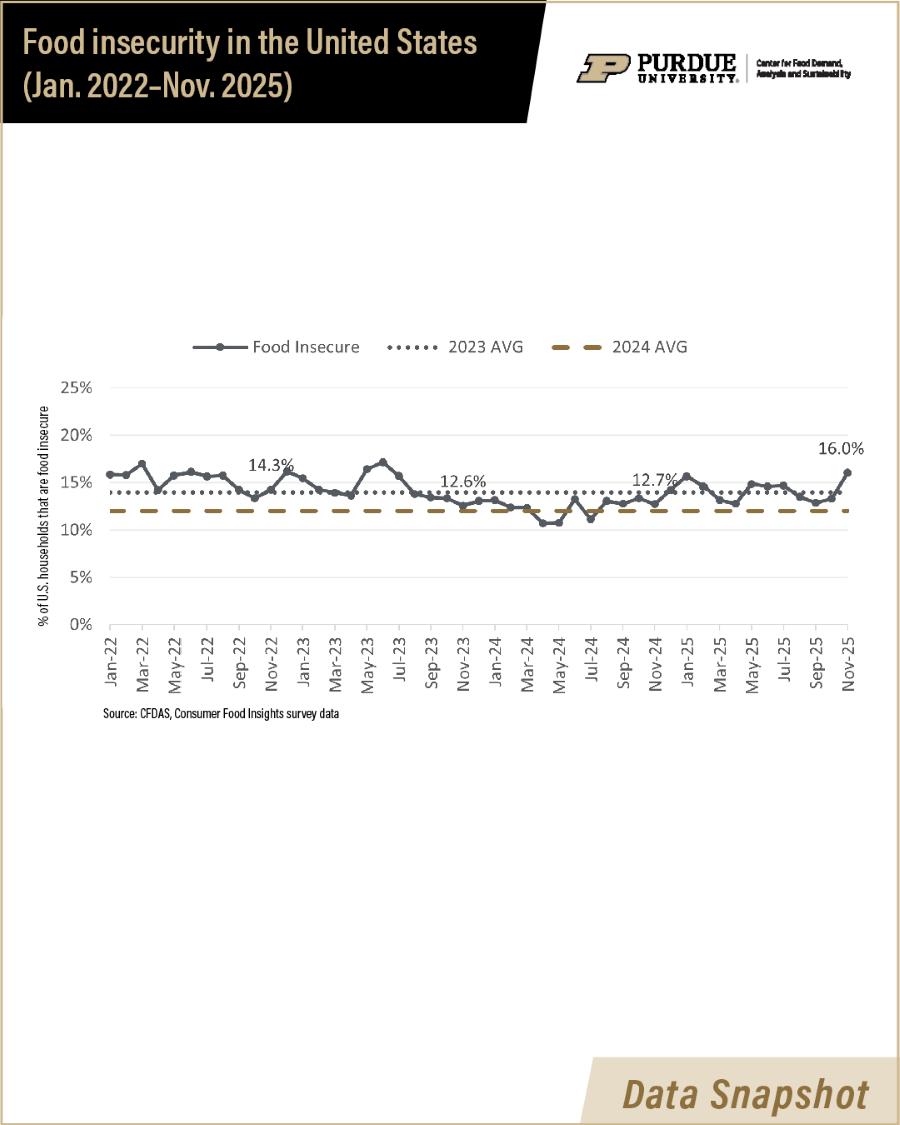
This dashboard summarizes U.S. household food insecurity as estimated in the Consumer Food Insights survey, our monthly survey of 1,200 consumers from across the country.
Looking for something?
Search timely insights, reports, stories and other data related to food markets, consumer spending and preferences.
Consumer Food Insights is a monthly survey of 1,200 households from across the United States, which is produced and run by the Center for Food Demand Analysis and Sustainability at Purdue University to track trends and changes in consumer food demand and other food sustainability behaviors.


Recent Data & Publications
Only 37% of surveyed individuals selected taste preferences as the most important factor they consider when shopping for groceries online, which sharply contrasts with long-reported food purchasing values, where taste typically ranks first when shopping in person, according to the February Consumer Food Insights Report (CFI).
The January Consumer Food Insights Report (CFI) sought to determine whether those classified as overweight are more or less satisfied with their diets than those who are not classified as overweight.
In October 2025, Purdue University and Flinders University conducted the Australian Consumer Food Insights (CFI) Survey with a nationally representative sample of 1,704 participants. This report examines two key measures of food hardship—food stress and food insecurity — in the context of Australia’s escalating cost of living pressures.