
Click to enlarge.
The Center for Demand Analysis and Sustainability’s (CFDAS) new dashboard, Changes in the Consumer Price Index for Food, displays up-to-date changes in the U.S. Bureau of Labor Statistics’ Consumer Price Indexes (CPI) for food. The CPI is used to calculate official measures of inflation. As such, it is used to inform policymakers, businesses and consumers about price trends in the economy.
The CFDAS dashboard displays changes in the CPI for all items (including non-food items), all food, food at home (FAH), food away from home (FAH), and subcomponents of FAH and FAFH. Dashboard users can choose to view month-to-month changes, year-to-year changes, or changes from a base period chosen by the user. CFDAS updates the dashboard every month upon release of new CPI data.
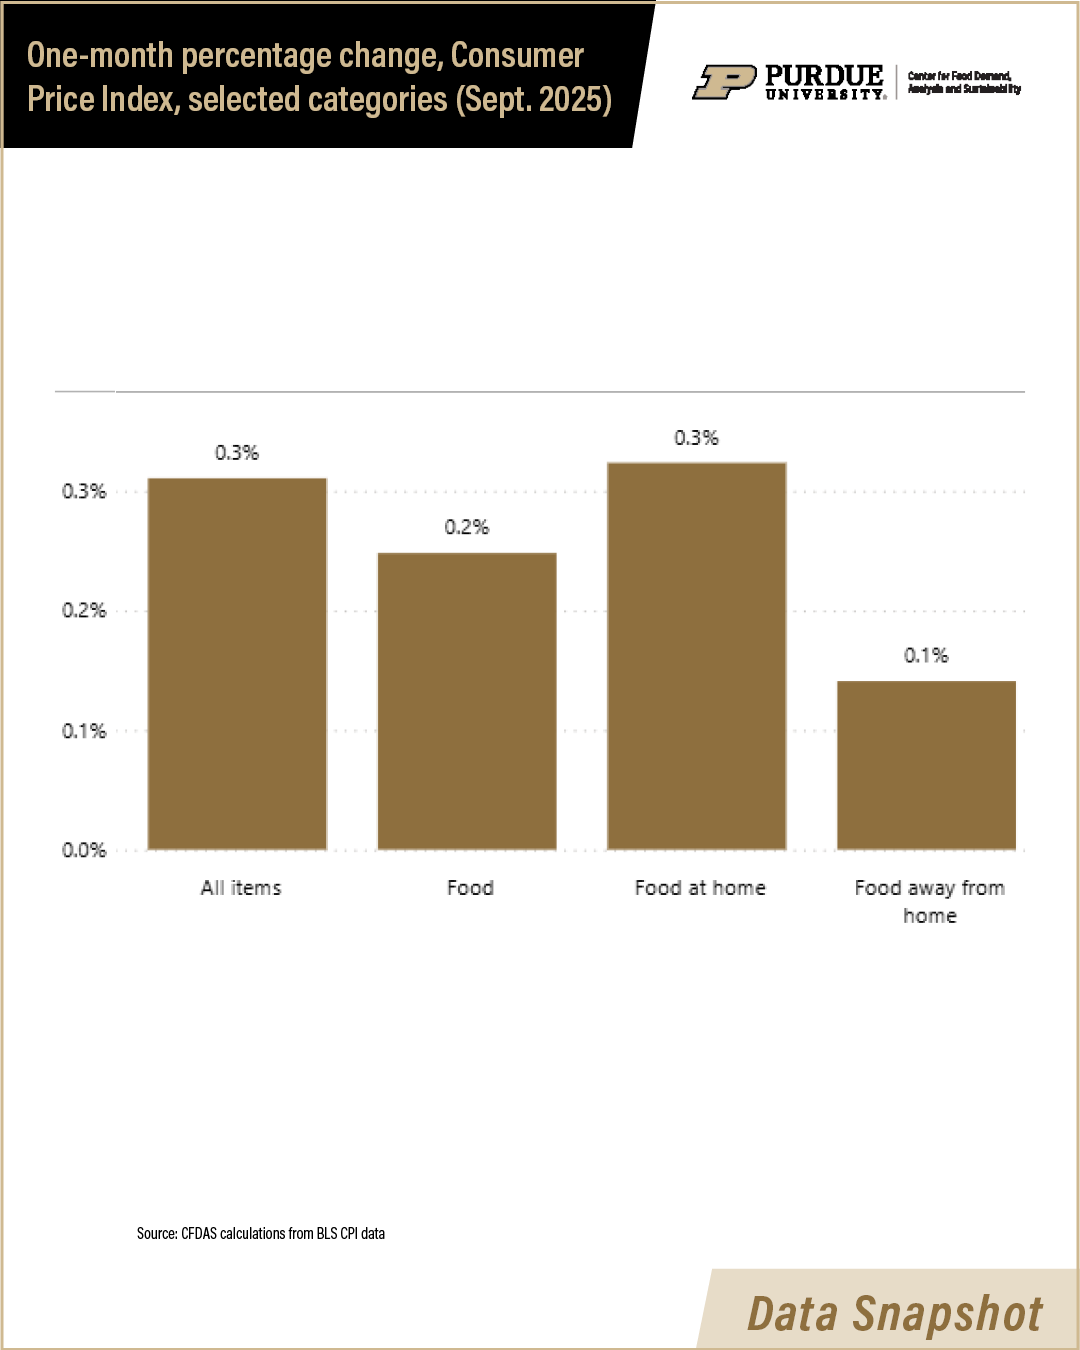
The September 2025 CPI data, released on October 24, reveal several patterns/changes:
- Food prices rose 0.2% in the in the past month and 3.1% over the past 12 months. The 12-month change is slightly lower than observed last month (3.2%) but higher than last year (2.3%).
- FAFH prices rose 0.1% in the past month, the lowest monthly increase since February 2024. FAFH prices rose 3.7% over the past 12 months.
- FAH prices rose by 0.3% in the past month and 2.7% in the past year. The index for “Meats, poultry, fish, and eggs” rose by 0.3% in September, after a 1.0% increase in August. The index for “Meats, poultry, fish, and eggs” rose 5.2% over the past 12 months.
See more on our CPI food dashboard, with monthly updates that follow the CPI Release Calendar.
October 24, 2025