Skip to Main Content
  • Find Info For
    Academics Admissions Current Students Athletics About Careers Prospective Students Research and Partnerships Entrepreneurship and Commercialization
  • Apply
  • News
  • President
  • Shop
  • Visit
  • Give
  • Emergency
  • Search

Center for Food Demand Analysis & Sustainability

Purdue Logo
  • About
    • About the Center
    • Our Team
    • Partners & Affiliates
    • Next Moves
    • Contact
  • Consumer Food Insights
    • Current Report
    • Search All Consumer Food Insights
    • About Consumer Food Insights
  • Data
    • Data Library
    • Dashboards
    • Data Snapshots
    • Infographics
  • Publications
    • Publication Library
    • Chew On This! Blog
    • Research
  • News & Stories

Data

Search Results

Line graphs showing U.S. food insecurity rates from January 2022 through November 2025
Food insecurity in the United States increased in 2025
Data Snapshot
Topic: Food Insecurity

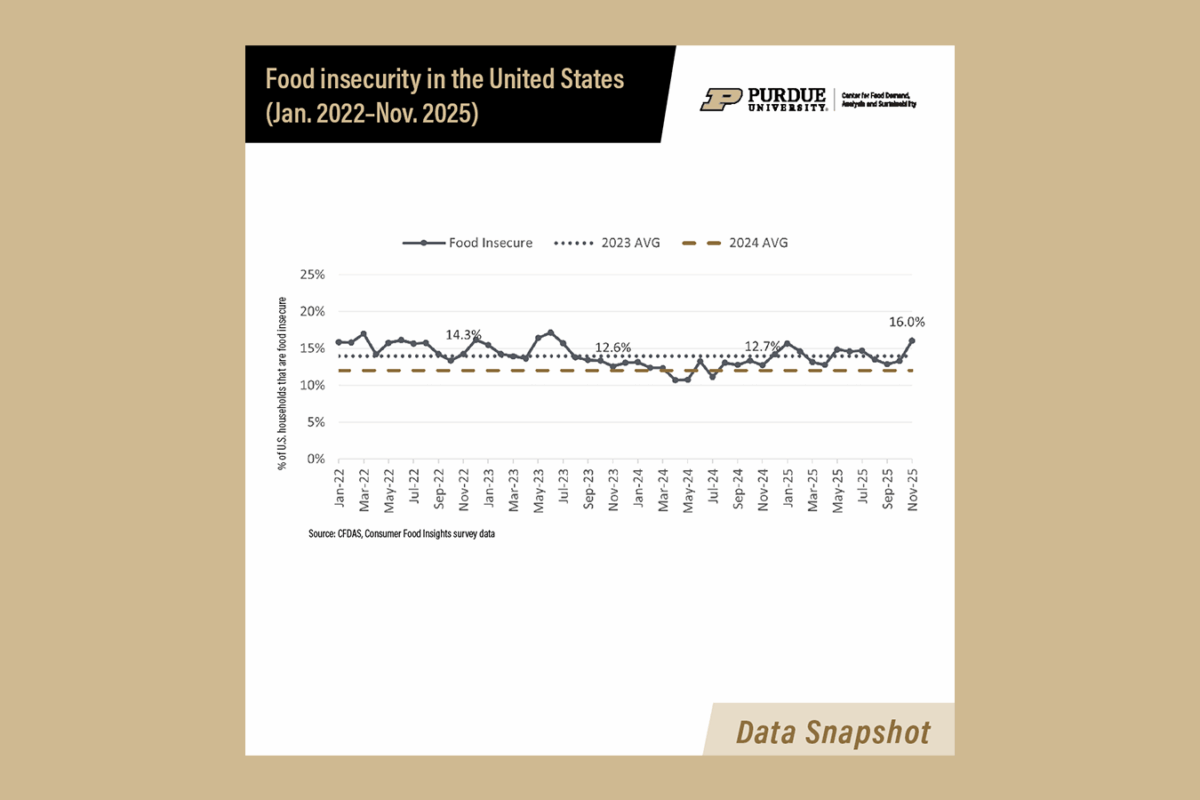
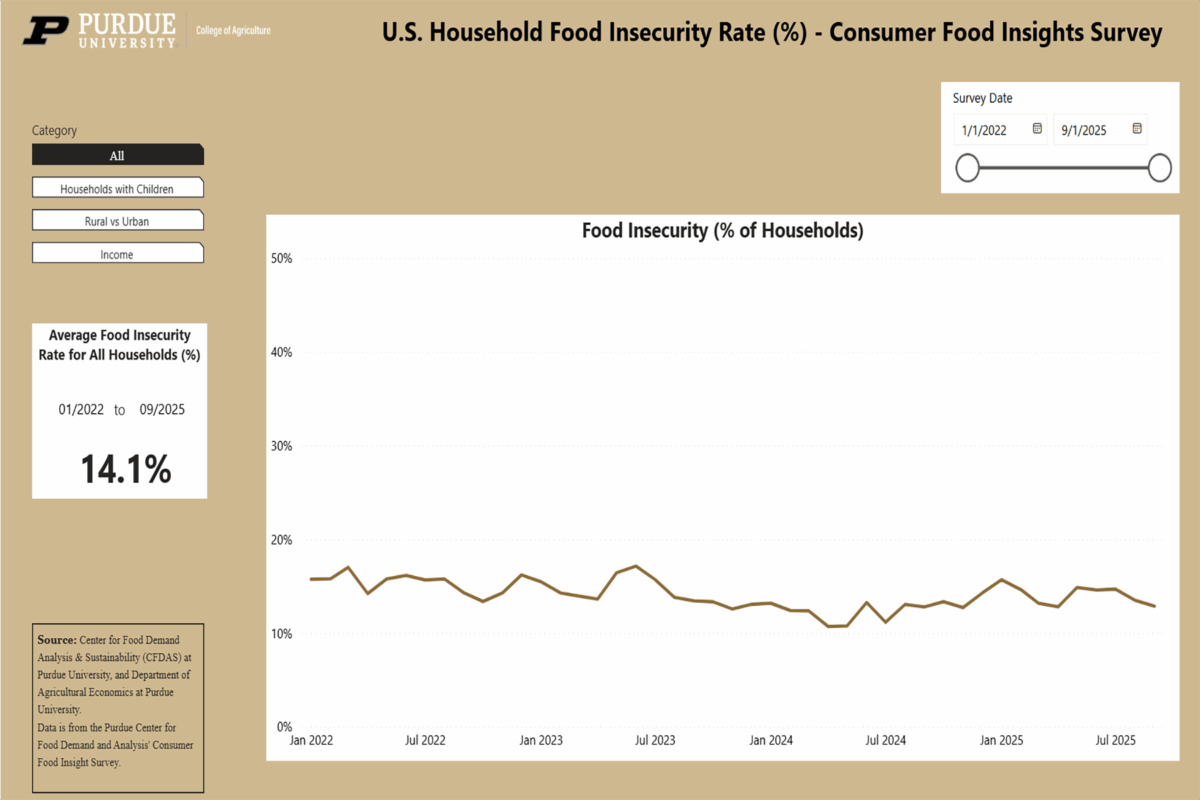
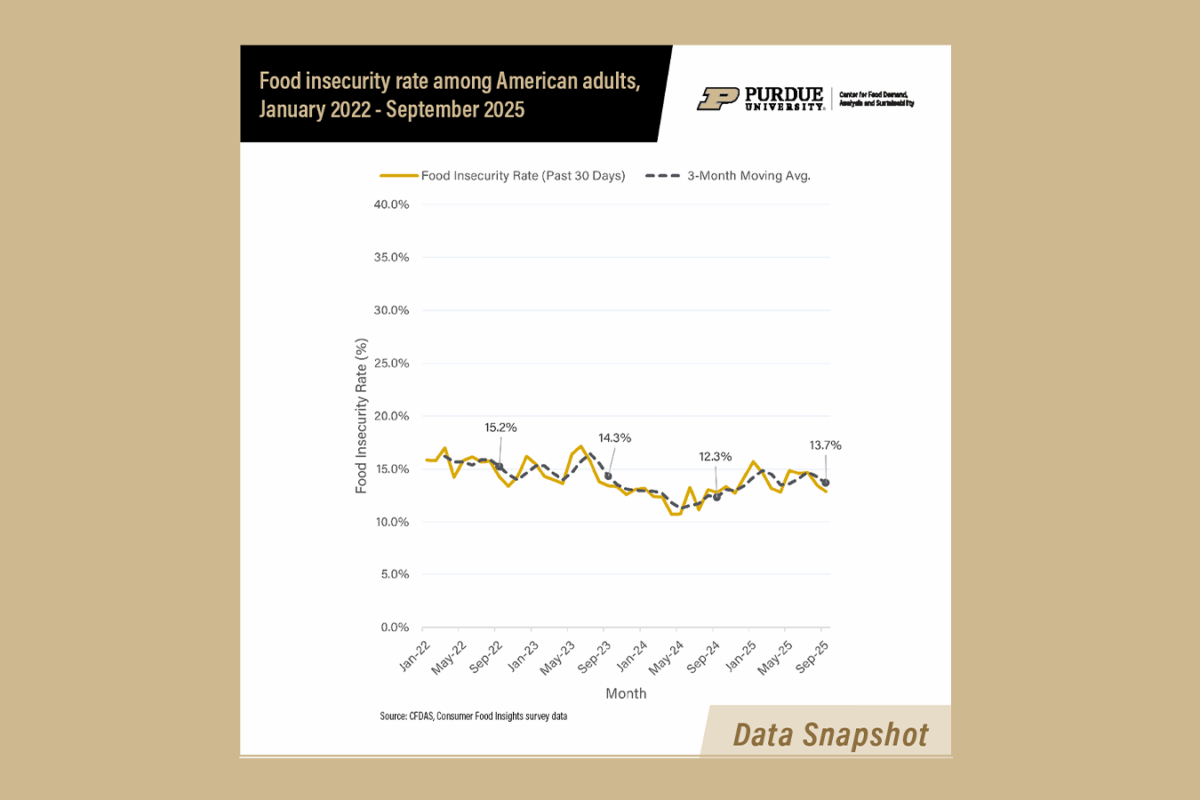
This Data Snapshot charts household food insecurity from January 2022 through November 2025.

Thumbnail image of bar graph comparing at-home food sustainability behaviors in U.S. and Australia
How do Americans and Australians compare on sustainable food behaviors?
Data Snapshot
Topic: Consumer Behaviors

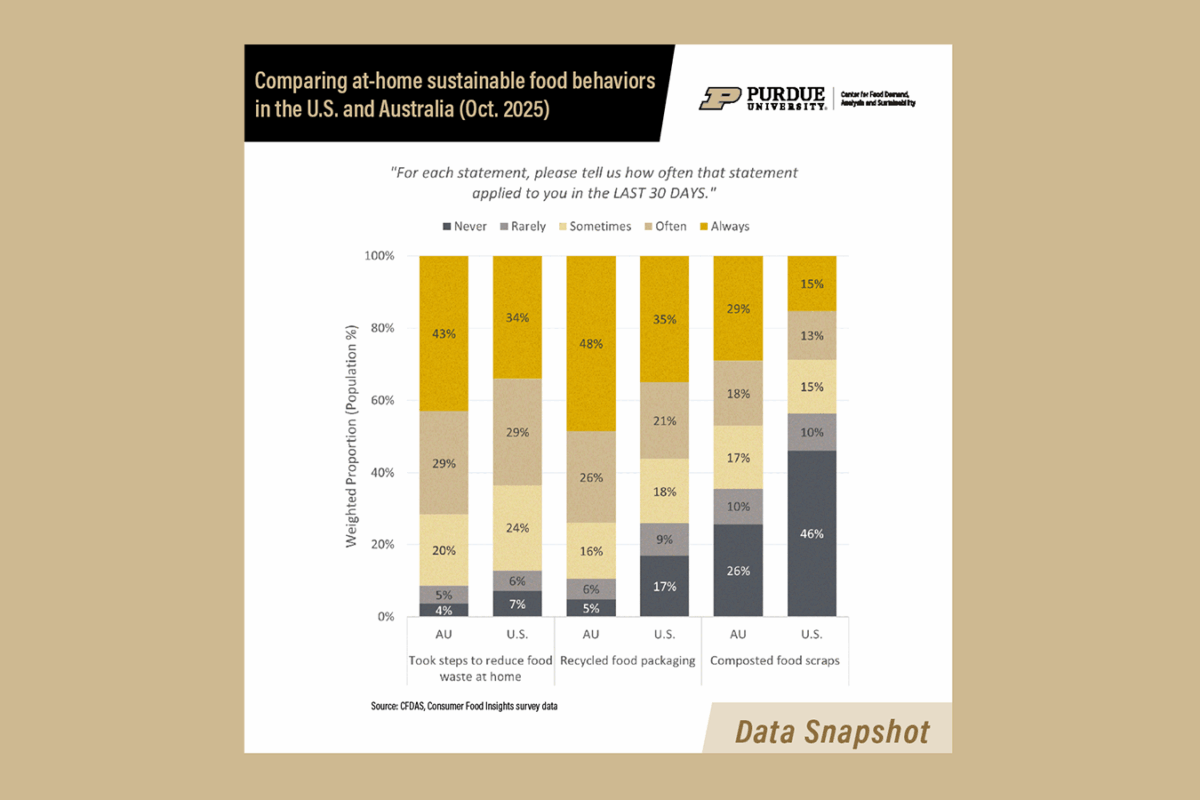
This Data Snapshot delves deeper into our cross-country comparison between the U.S. and Australia and explores how often survey respondents engaged in three key sustainability behaviors over the past 30 days: reducing food waste, recycling food packaging and composting food scraps. 

thumbnail image of Nov. 6, 2025 data snapshot
Households with children eat out more frequently
Data Snapshot
Topic: Consumer Spending

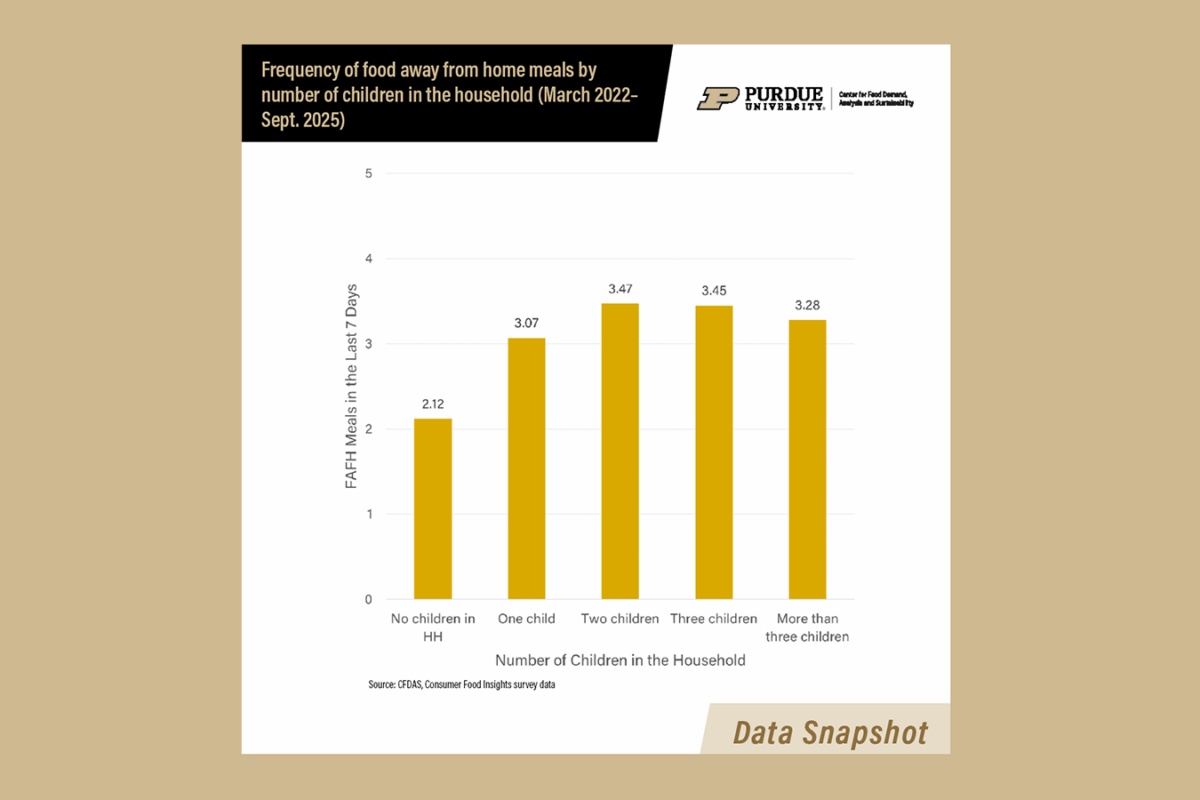
Three years of data from the Consumer Food Insights survey reveals a clear pattern: households with children eat out more frequently. These data highlight one way in which households with children engage with the food system differently than households without children.

thumbnail of data snapshot
Dashboard tracks monthly updates of the Consumer Price Indexes for food
Data Snapshot
Topic: Prices

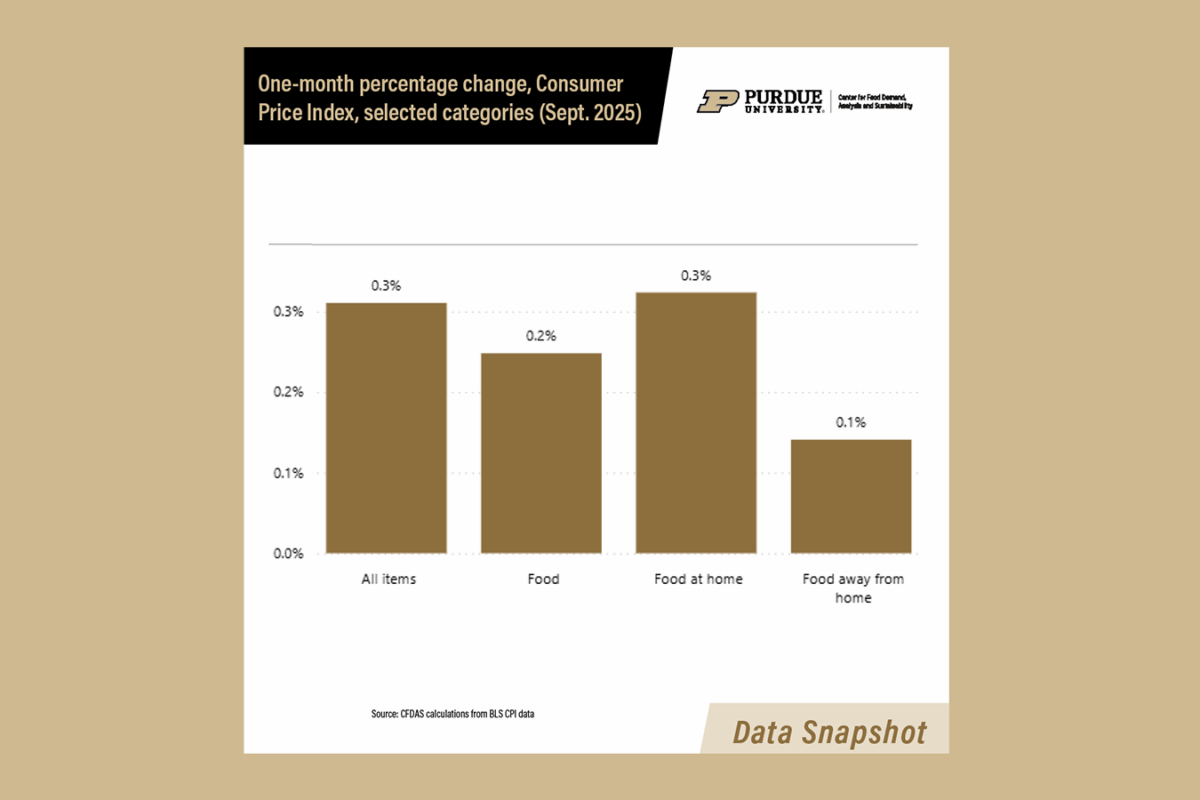
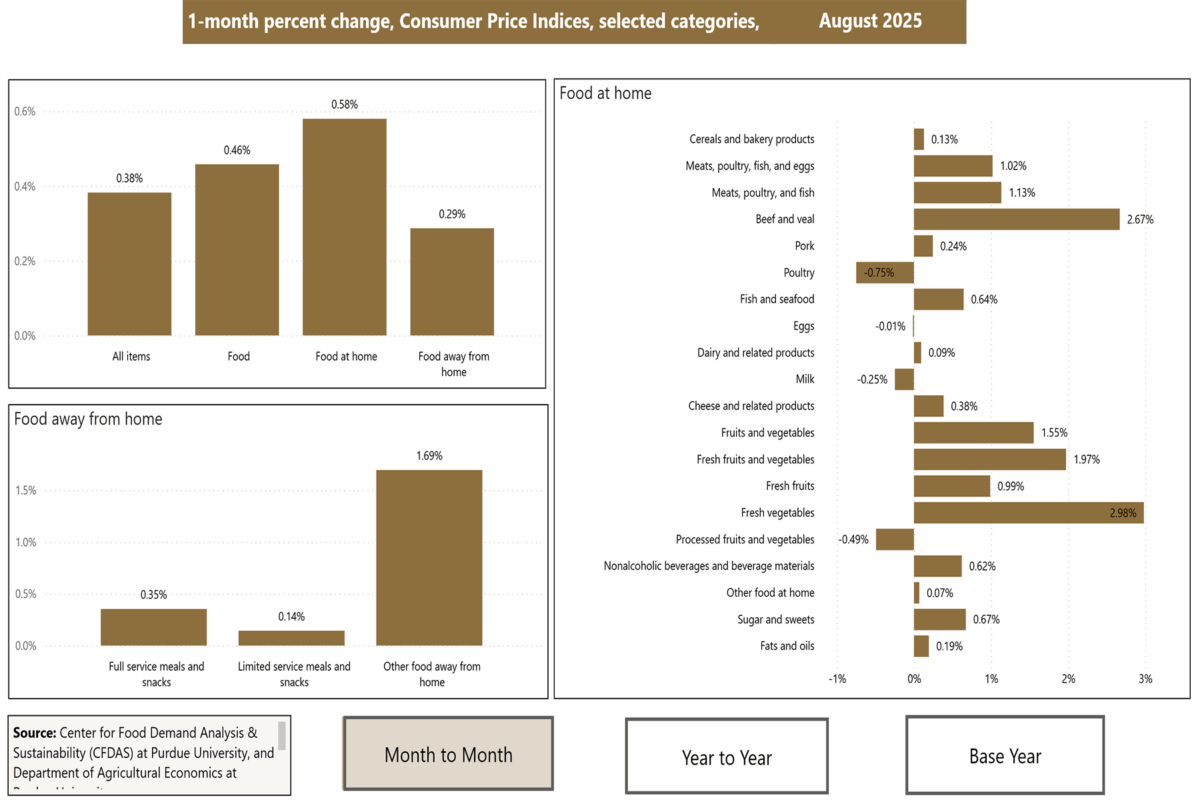
The Changes in the Consumer Price Index for Food dashboard tracks changes in the CPI for food and its various subcomponents. Users can toggle between 1-month and 12-month changes, or a base period period chosen by the user. The dashboard is updated every month as CPI releases new data.

thumbnail image of food insecurity rate dashboard
U.S. Household Food Insecurity Rate – Consumer Food Insights Survey
Current Dashboard
Topic: Consumer Preferences, Consumer Spending, Prices

This dashboard summarizes U.S. household food insecurity as estimated in the Consumer Food Insights survey, our monthly survey of 1,200 consumers from across the country. 

thumbnail of bar graph showing diet quality by household income
Higher income, better diets—but not always healthy ones
Data Snapshot
Topic: Nutrition

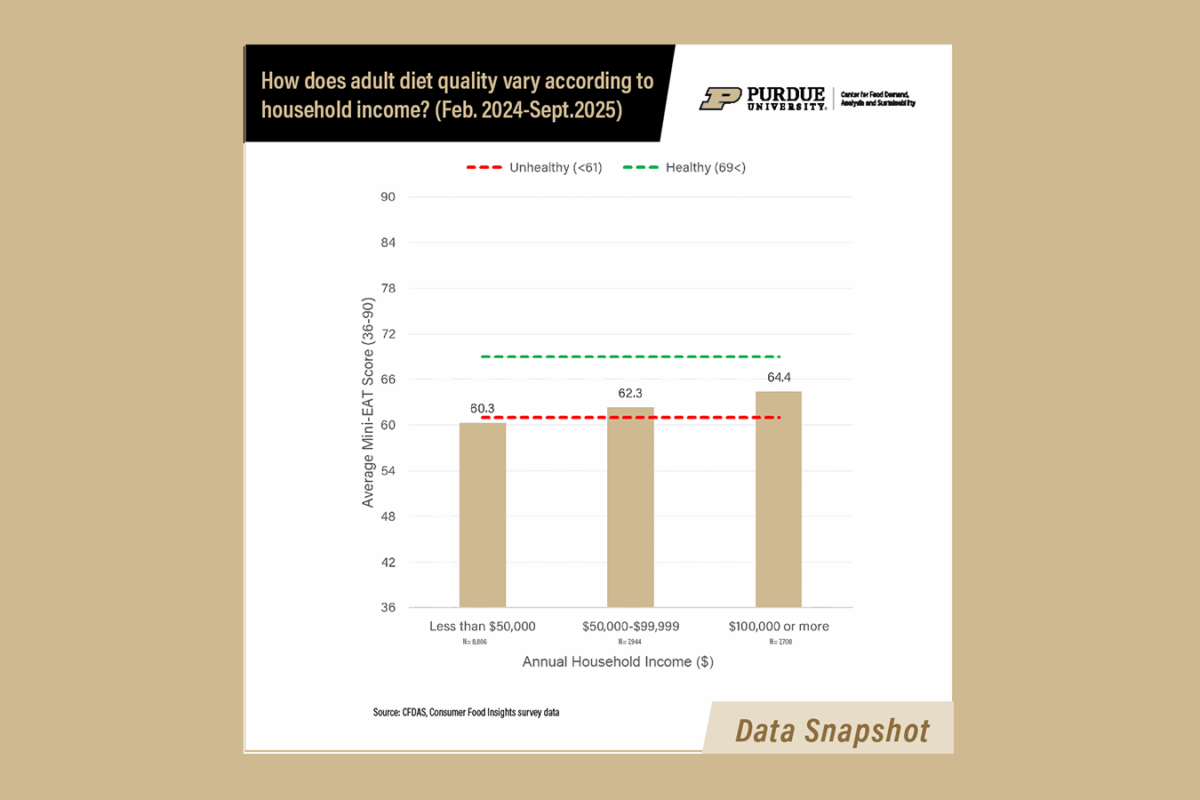
While household income does influence dietary choices, CFDAS data shows that even the highest earners fail to meet expert-defined benchmarks for a healthy diet, on average.

dashboard thumbnail image
Changes in the Consumer Price Index for Food
Current Dashboard
Topic: Consumer Spending, Prices

This dashboard shows the latest changes in the U.S. Bureau of Labor Statistics’ Consumer Price Index (CPI) for various food items with options to view changes month to month, year to year, and base period for easy comparison.

thumbnail image of featured chart
Younger consumers are more open to healthy food claims
Data Snapshot
Topic: Consumer Beliefs

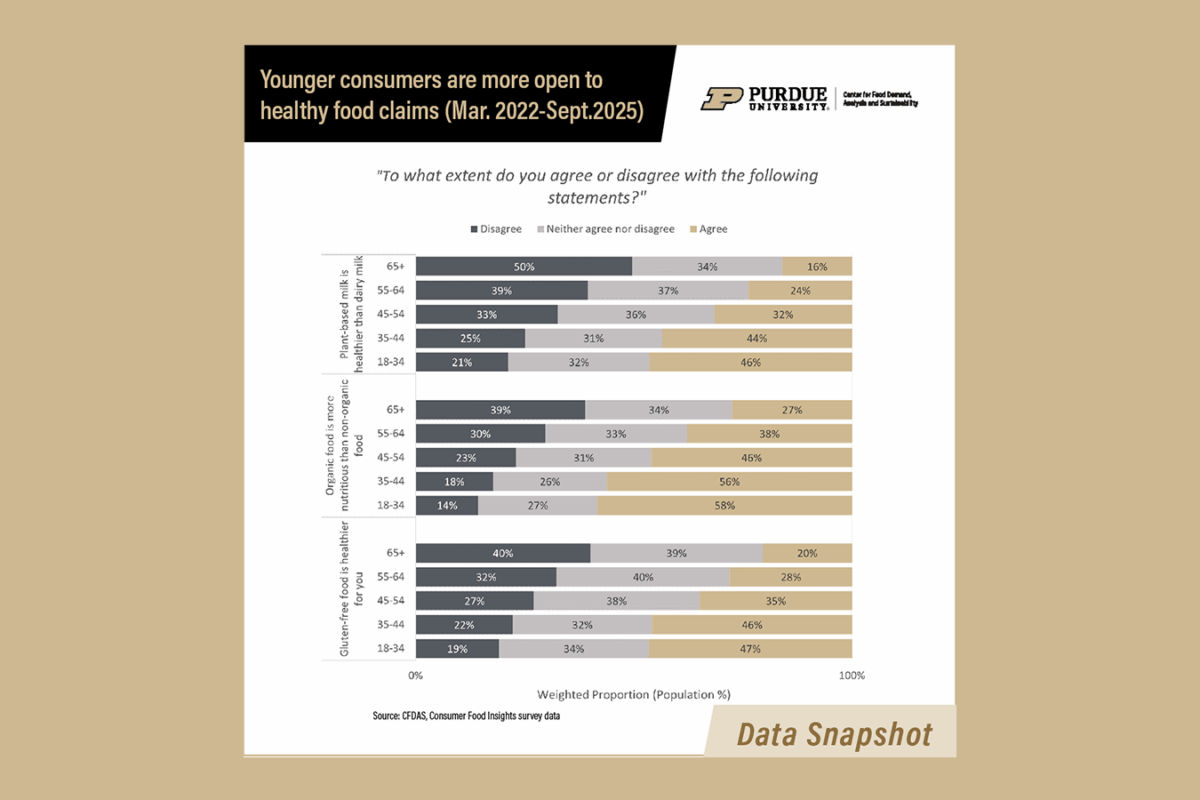
This week, we explore consumer beliefs about the healthfulness of certain foods compared to their conventional counterparts: plant-based milk, gluten-free foods, and organic foods. Turns out that age plays a role.

Thumbnail of graph showing rate of US household food insecurity Jan. 2022-Sept. 2025
Food insecurity rate among American adults, January 2022-September 2025
Data Snapshot
Topic: Food Insecurity

CFDAS has been estimating food insecurity every month since January 2022. Monitoring this data provides insight into Americans’ ability to access nutritional and affordable food and how that changes over time.

Older Data
  • Employee Portal
  • Blackboard
  • Purdue Today
  • Office 365
  • Outlook
  • myPurdue
  • Faculty & Staff
  • Careers
  • Physical Facilities
  • Directory
  • Campus Map
  • Construction
  • Faculty & Staff
  • In Focus
  • Information Technology
  • Directory
  • Agricultural Communication
  • Request an AgComm Project
  • Envision Magazine
  • Media Outreach
  • Destination Purdue
  • Calendar
  • The Education Store
  • Contact/Maps
Purdue Logo
  • facebook-f
  • twitter
  • linkedin-in
  • youtube
  • instagram
  • snapchat-ghost
Last modified: Feb 16, 2026

Purdue Agriculture, 615 Mitch Daniels Blvd., West Lafayette, IN 47907-2053 USA, (765) 494-8392

© 2025 Purdue University | An equal access/equal opportunity university | Integrity Statement | Copyright Complaints | Maintained by Purdue Agricultural Communication

Trouble with this page? Disability-related accessibility issue? Please contact us at agweb@purdue.edu so we can help.

Skip to content
Open toolbar Accessibility Tools

Accessibility Tools

  • Increase TextIncrease Text
  • Decrease TextDecrease Text
  • GrayscaleGrayscale
  • High ContrastHigh Contrast
  • Negative ContrastNegative Contrast
  • Light BackgroundLight Background
  • Links UnderlineLinks Underline
  • Readable FontReadable Font
  • Reset Reset