Search Results
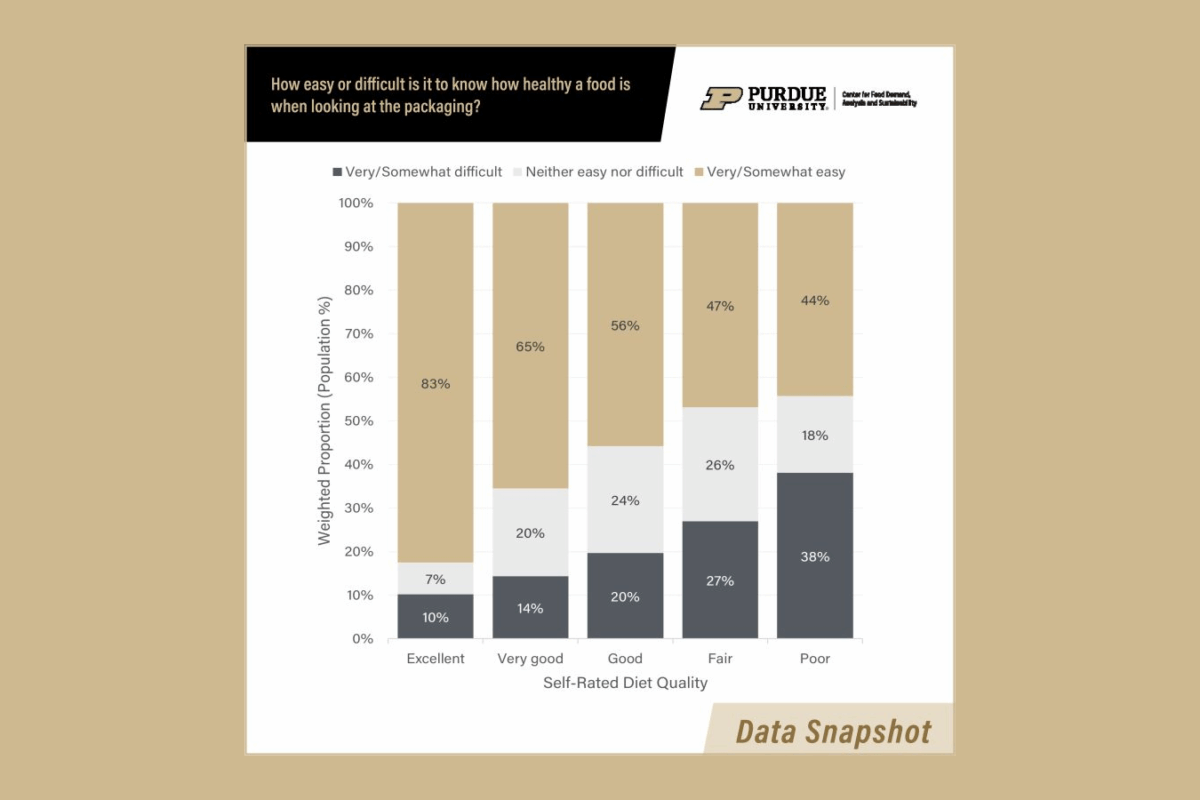
How easy or difficult is it for consumers to know how healthy a food is when looking at the packaging? Diet quality plays a role.
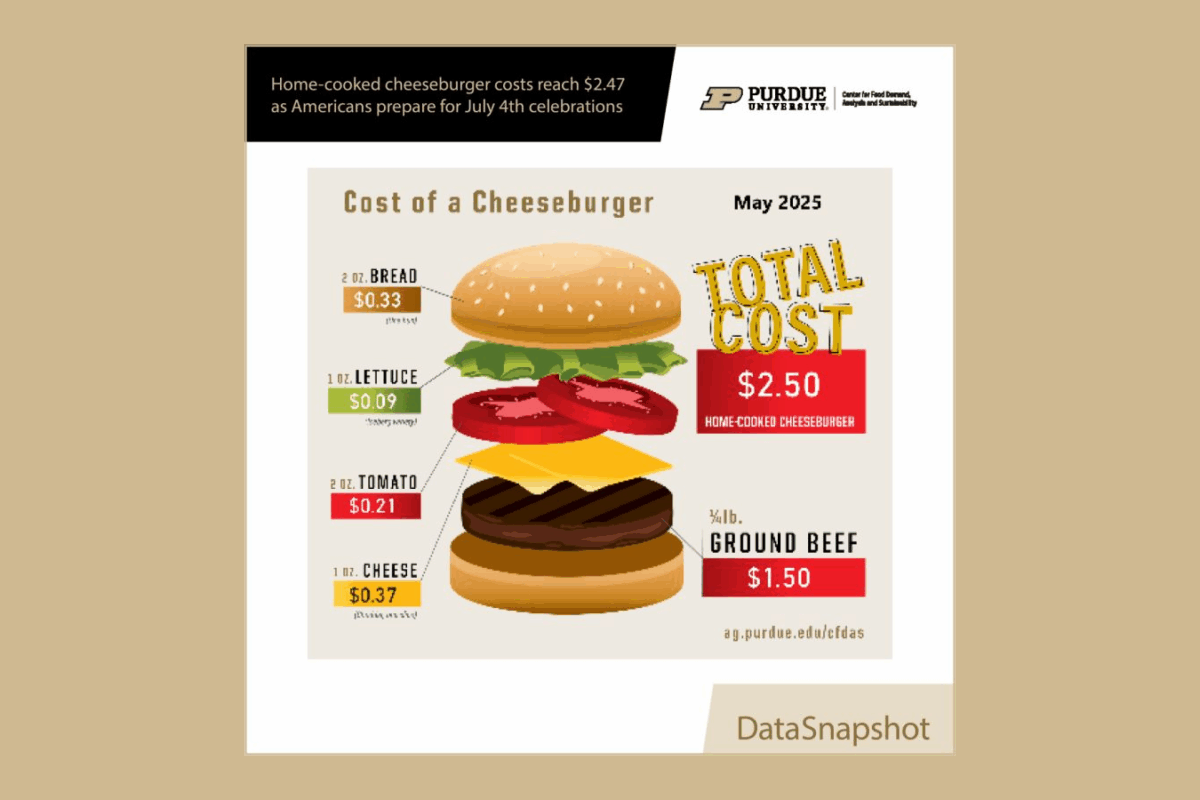
As American fire up their backyard grills, the cost of a home-cooked cheeseburger reaches $2.50.
This dashboard provides the average cost of a cheeseburger over time, the cost of each ingredient of the cheeseburger over time and the inflation-adjusted cost of a cheeseburger over time, based on data from the U.S. Bureau of Labor Statistics.
This assessment tool estimates diet quality based on a short survey that elicits consumption frequency for nine food types: fruits, vegetables, whole grains, refined grains, fish or seafood, legumes/nuts/seeds, low‐fat dairy, high‐fat dairy, and sweets.
The Egg Prices dashboard tracks daily prices and trends across the U.S. for different types of eggs, including Cage-Free, Conventional, Free-Range, Organic and Pasture-Raised.
The Trends in Grocery Delivery Sales dashboard tracks sales for grocery delivery based on a sample of debit and credit card transactions. The location of the debit/credit cardholder is based on the cardholder’s address in the financial institution’s records.
The Trends in Food and Beverage Sales dashboard tracks sales for food and beverages based on a sample of debit and credit card transactions. The location of the debit/credit cardholder is based on the cardholder’s address in the financial institution’s records.
The Trends in Food Services Sales dashboard tracks sales for food services based on a sample of debit and credit card transactions. The location of the debit/credit cardholder is based on the cardholder’s address in the financial institution’s records.
The Trends in Convenience Store Sales dashboard tracks sales at convenience stores based on a sample of debit and credit card transactions. The location of the debit/credit cardholder is based on the cardholder’s address in the financial institution’s records.
Accessibility Tools