

Interactive Maps
Interactive Maps
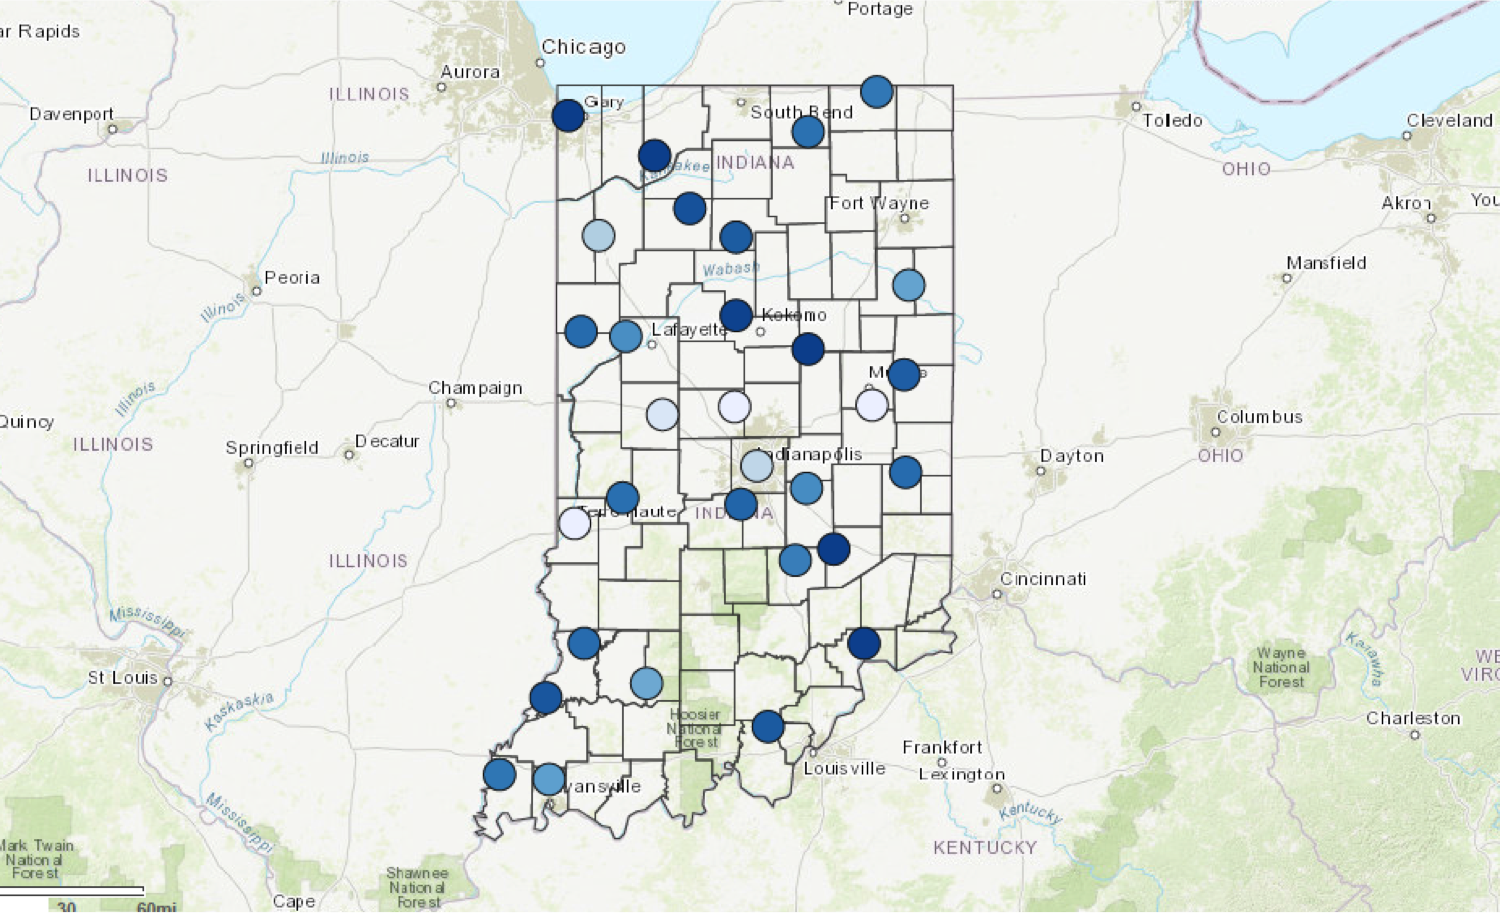
Groundwater - Current State
The Groundwater Current State webmap (link below) displays groundwater metrics based on monitoring wells within the state of Indiana with at least 30 years of observations. Several water level metrics are available for display to provide a visual representation of the current state of Indiana groundwater resources. These metrics include depth to the water table for the most recent water year as well as percentiles to convey how the most recent water year compares to the 29 previous water years at each of the sites. Descriptions of the various layers present in the webmap can be seen at the bottom of this page. Methodology details can be found here.
Map will open in new tab
Mean Water Table [Depth below surface (ft)] - Average water table depth in the well over the most recent (current) water year.
End of Year Water Table [Depth below surface (ft)] - Water table depth on the last day of the most recent water year (September 30)
Percentile of Mean Water Table - Non-exceedance probability of the mean water table depth from the most recent (current) water year as compared to the previous 29 water years. [100% = highest water table]
Percentile of End of Year Water Table - Non-exceedance probability of the water table depth on the last day of the water year (September 30) as compared to the previous 29 water years. [100% = highest water table]
Percentile of Maximum Water Table - Non-exceedance probability of the maximum water table depth from the most recent (current) water year as compared to the previous 29 water years. [100% = highest water table]
Percentile of Minimum Water Table - Non-exceedance probability of the minimum water table depth from the most recent (current) water year as compared to the previous 29 water years. [100% = highest water table]
Percentile of Water Table Range - Non-exceedance probability of the water table range from the most recent (current) water year as compared to the previous 29 water years. [100% = greatest range]
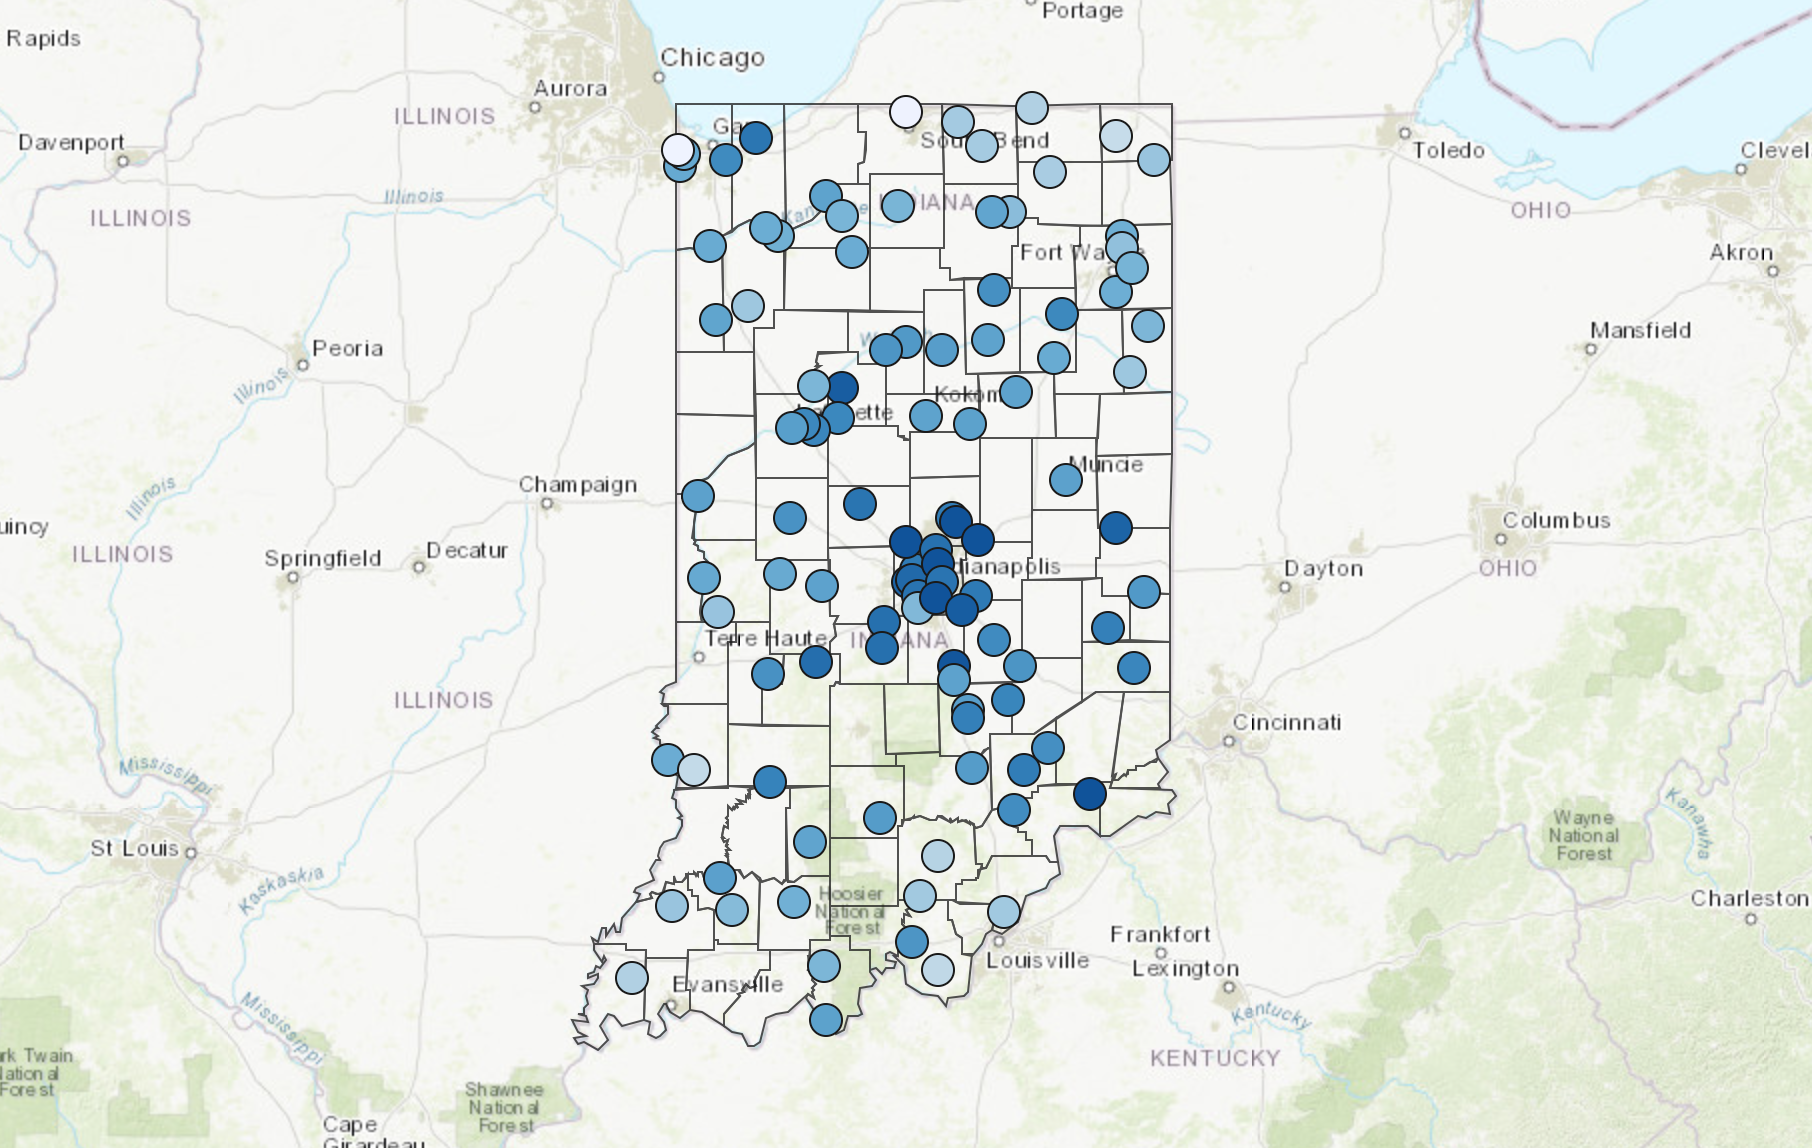
Surface Water - Current State
The Surface Water Current State webmap (link below) displays surface water metrics based on streamflow gauges within the state of Indiana with at least 30 years of observations. Several water level metrics are available for display to represent the current state of Indiana surface water resources. These metrics include flow rate normalized by watershed area for the most recent water year as well as percentiles to convey how the most recent water year compares to the previous 29 water years at each of the sites. Descriptions of the various layers present in the webmap can be seen at the bottom of this page. Methodology can be found here.
Map will open in new tab
Mean Flow Rate [in] - Average runoff over the most recent (current) water year. The streamflow rates were normalized based on the drainage area of each station's corresponding watershed.
End of Year Flow Rate [in] - Runoff rate on September 30th of the most recent (current) water year. The flow rates were normalized based on the drainage area of each station's corresponding watershed.
Percentile of Mean Flow Rate - Non-exceedance probability of the mean runoff from the most recent (current) water year as compared to the previous 29 water years. [100% = greatest flow rate]
Percentile of End of Year Flow Rate - Non-exceedance probability of the end of year (September 30) runoff from the most recent (current) water year as compared to the previous 29 water years. [100% = greatest flow rate]
Percentile of Maximum Flow Rate - Non-exceedance probability of the maximum runoff rate from the most recent (current) water year as compared to the previous 29 water years. [100% = greatest flow rate]
Percentile of 7-Day Minimum Flow Rate - Non-exceedance probability of the minimum runoff rate from the most recent (current) water year as compared to the previous 29 water years. [100% = greatest flow rate]
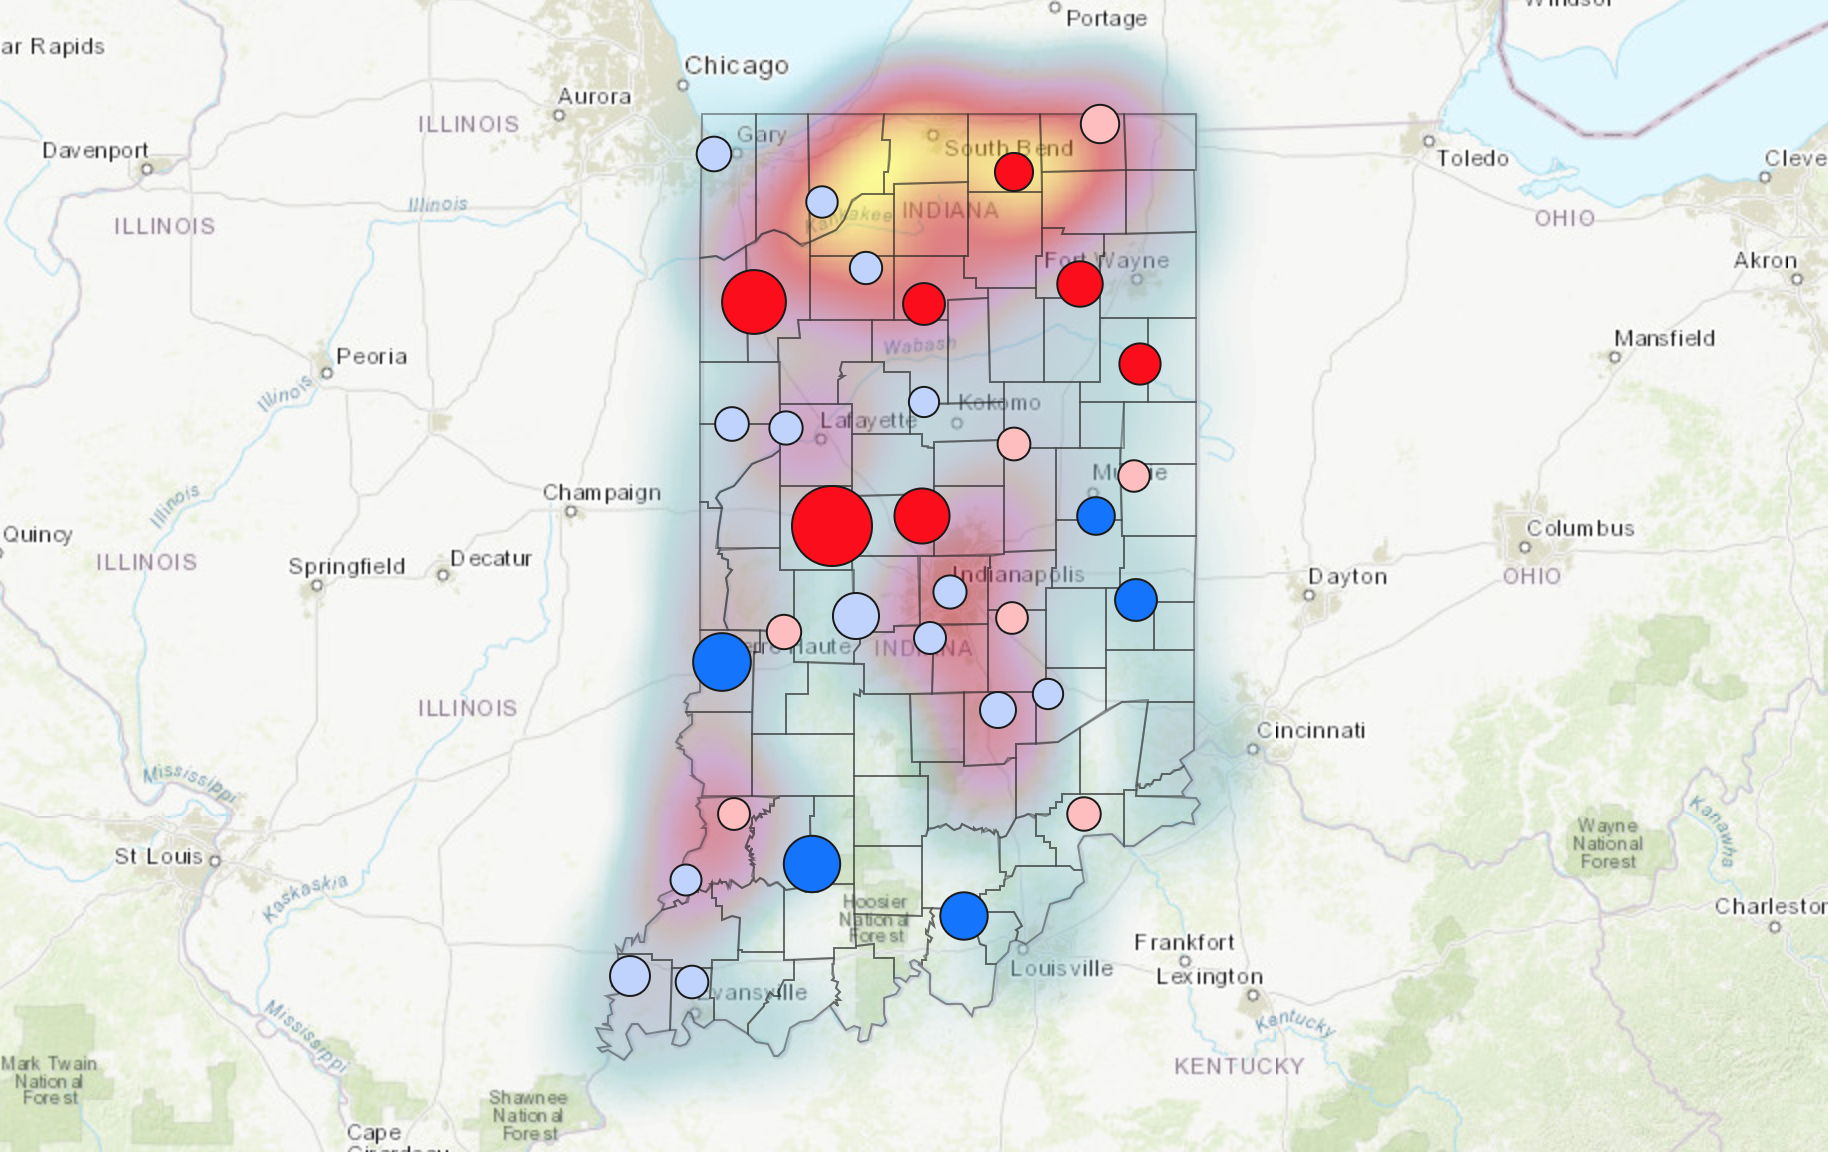
Groundwater - Trends
The Groundwater Trends webmap (link below) displays the results of statistical trend analysis over the last 30 years of groundwater measurements from groundwater monitoring sites within the state of Indiana. Trends for several water level metrics are available for viewing through the interactive map. Descriptions of the various metrics presented in the webmap can be found at the bottom of this page. More information on the analysis methodology can be found here.
Map will open in new tab
Rate of Change of Mean Water Table [in/yr] - The rate of change of the annual mean water level over the last 30 years based on the Theil-Sen trend slope estimator. An increasing trend indicates a rising water table although the depth to the water table is decreasing. Statistically significant trends were identified based on a 10% significance level using the Mann-Kendall statistical test.
Rate of Change of Maximum Water Table [in/yr] - The rate of change of the annual maximum water level over the last 30 years based on the Theil-Sen trend slope estimator. An increasing trend indicates a rising water table although the depth to the water table is decreasing. Statistically significant trends were identified based on a 10% significance level using the Mann-Kendall statistical test.
Rate of Change of Minimum Water Table [in/yr] - The rate of change of the annual minimum water level over the last 30 years based on the Theil-Sen trend slope estimator. An increasing trend indicates a rising water table although the depth to the water table is decreasing. Statistically significant trends were identified based on a 10% significance level using the Mann-Kendall statistical test.
Rate of Change of Water Table Range [in/yr] - The rate of change of the annual water level range over the last 30 years based on the Theil-Sen trend slope estimator. An increasing trend indicates a rising water table although the depth to the water table is decreasing. Statistically significant trends were identified based on a 10% significance level using the Mann-Kendall statistical test.
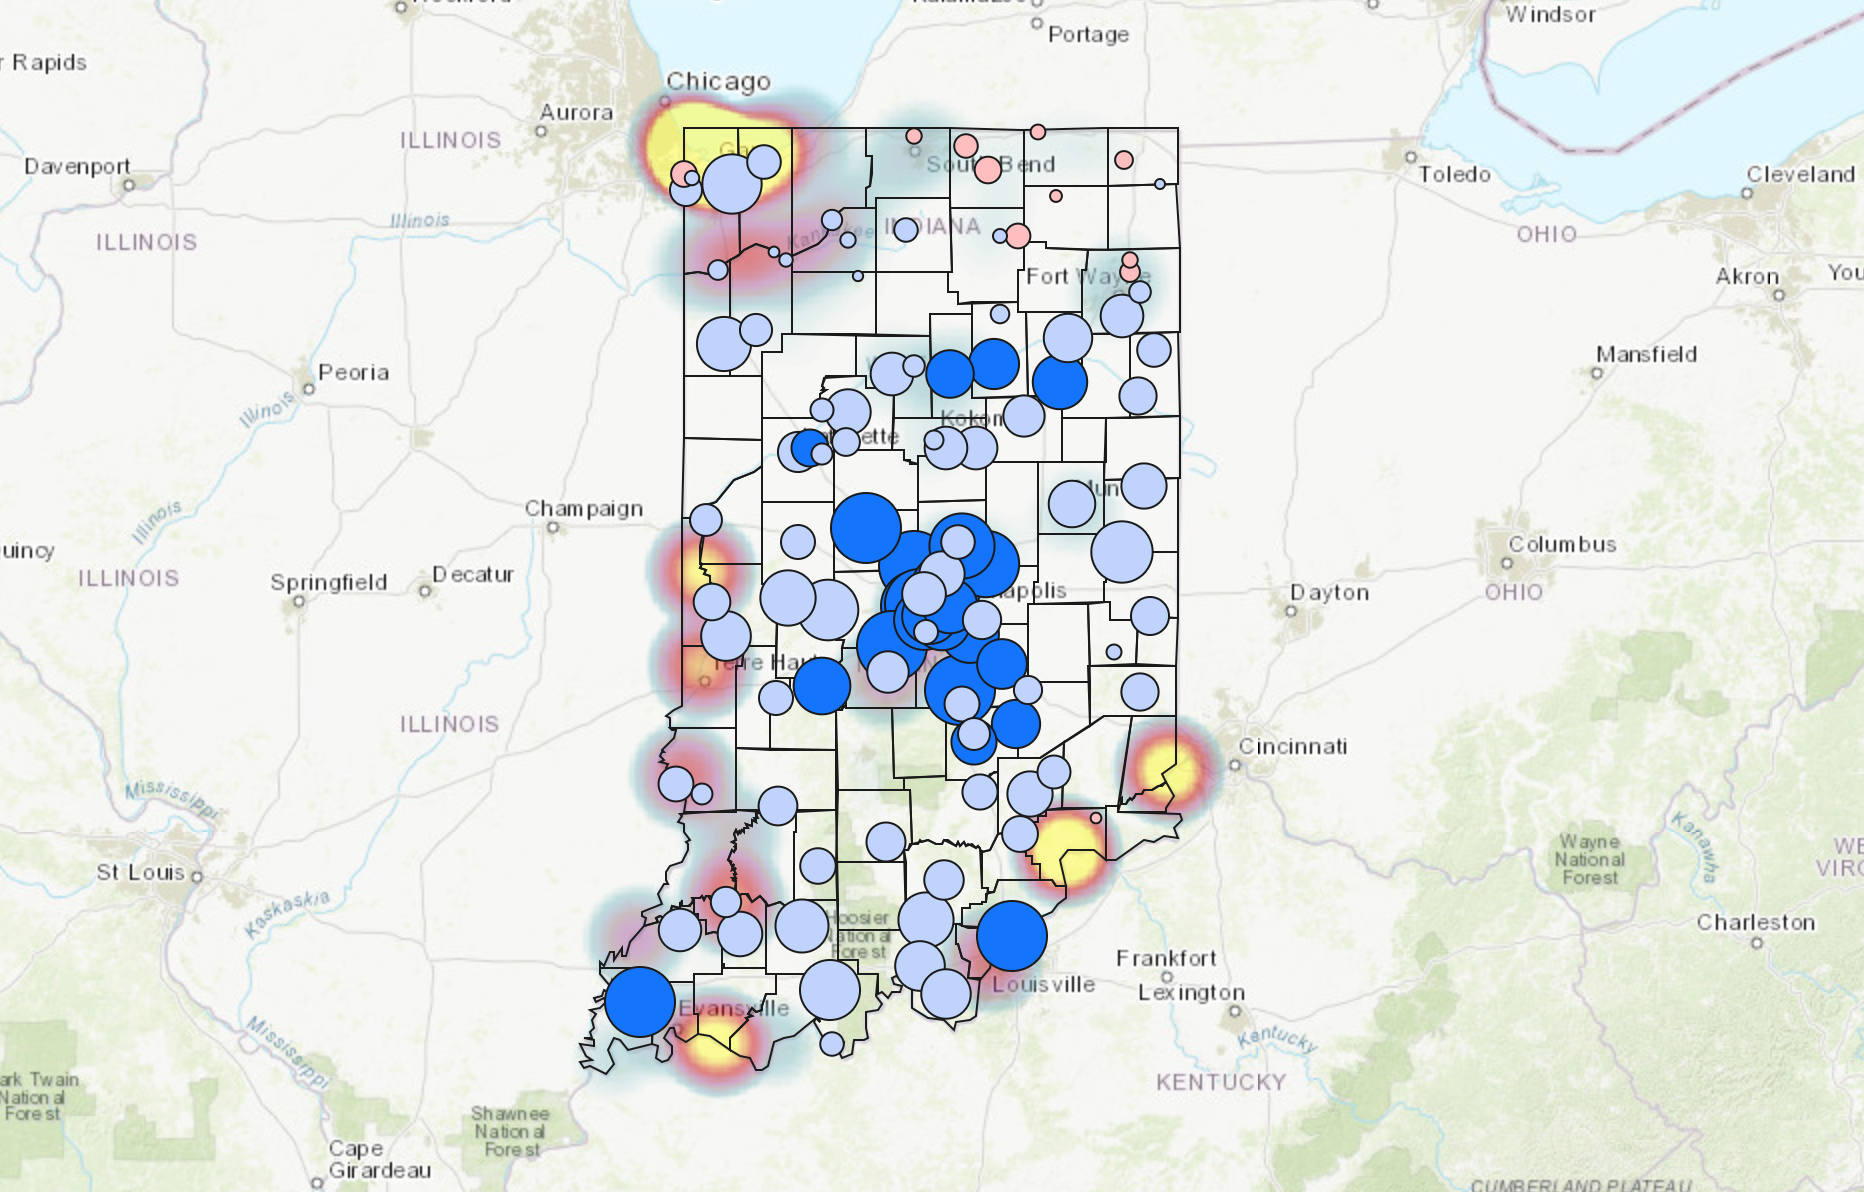
Surface Water - Trends
The Surface Water Trends webmap (link below) displays the results of statistical trend analysis over the last 30 years of streamflow measurements from surface water monitoring sites within the state of Indiana. Trends for several streamflow metrics are available for viewing through the interactive map. Descriptions of the various metrics presented in the webmap can be found at the bottom of this page. More information on the analysis methodology can be found here.
Map will open in new tab
Rate of Change of Mean Flow Rate [in/yr] - The rate of change of the annual mean flow rate over the last 30 years based on the Theil-Sen trend slope estimator. The flow rates were normalized based on the drainage area of each station's corresponding watershed. Statistically significant trends were defined based on a 10% significance level using the Mann-Kendall statistical test.
Rate of Change of Maximum Flow Rate [in/yr] - The rate of change of the annual maximum flow rate over the last 30 years based on the Theil-Sen trend slope estimator. The flow rates were normalized based on the drainage area of each station's corresponding watershed. Statistically significant trends were defined based on a 10% significance level using the Mann-Kendall statistical test.
Rate of Change of Minimum Flow Rate [in/yr] - The rate of change of the annual minimum (7 day moving average minimum) flow rate over the last 30 years based on the Theil-Sen trend slope estimator. The flow rates were normalized based on the drainage area of each station's corresponding watershed. Statistically significant trends were defined based on a 10% significance level using the Mann-Kendall statistical test.
Note: Discharge flow rates for trend analysis are normalized by the watershed area and presented as inches per unit area. This makes the trend magnitudes comparable between watersheds; however, those small magnitude trends can still represent substantial changes in annual water volume, especially in larger watersheds, such as along the Wabash River.