Surface Water Snapshots
RIVERS
SNAPSHOTS OF INDIANA SURFACE WATER RESOURCES
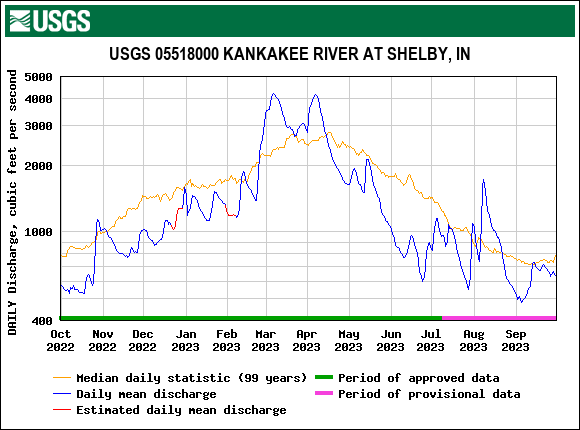
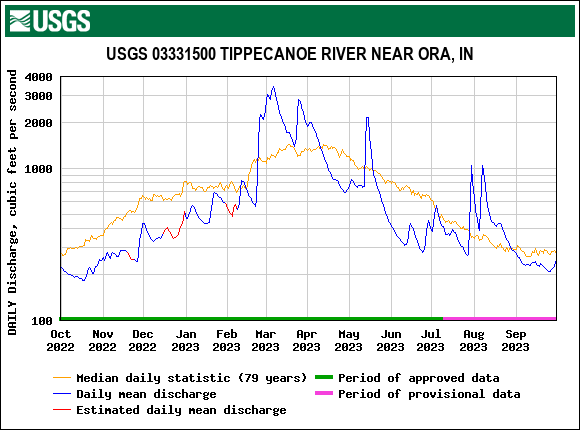
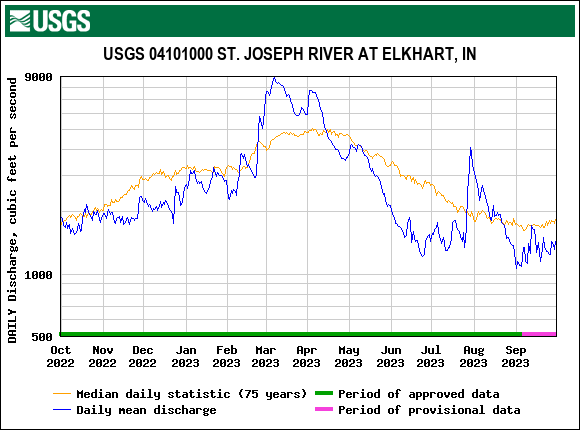
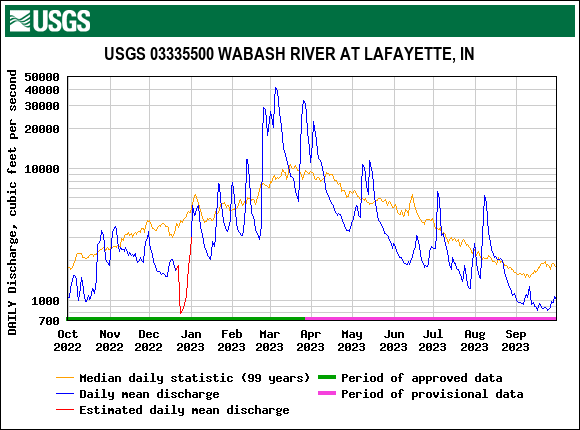
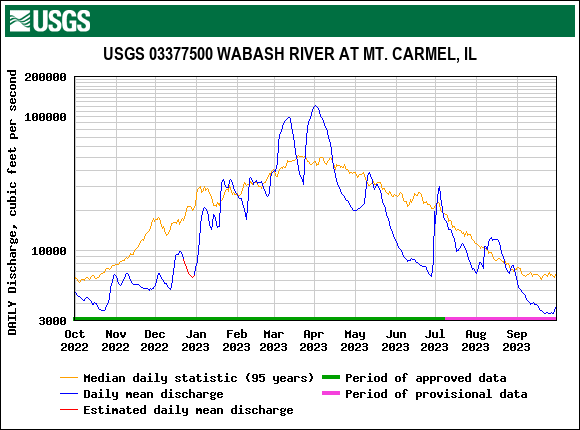
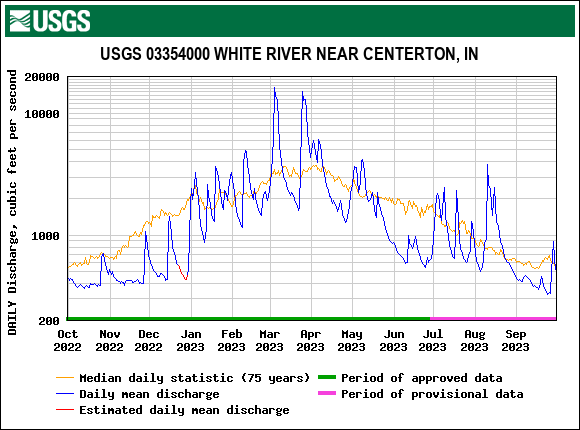
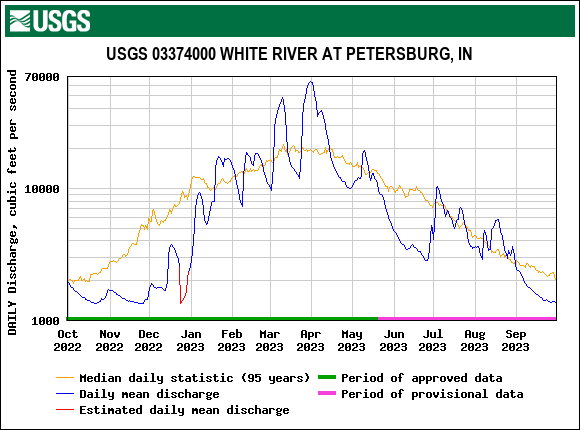
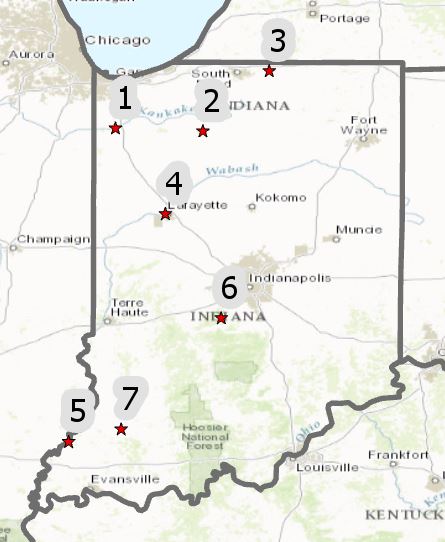
All of the rivers shown started WY 2024 with below average discharge. Rivers in the northern part of the state [1,2,3,4] recovered briefly, staying about average through November, before staying well below average into January. Discharge in southern rivers [5,6,7] was well below average until mid-January. Mid-January is when drought conditions began to break in Indiana, and all rivers were experiencing above average flow by February and again in April. The Wabash River at Mt. Carmel [5] and White River [6,7] were all at or well below normal from late-February through March. Discharge in the second half of the year was about normal on all rivers. The northern rivers [1,2,3,4] experienced peak flows in July following mid-summer storms, but those storms did not help flows in the southern part of the state. The White River near Centerton [6] experienced a substantial increase in flows right at the end of the year, while most of the other rivers finished the year right around their long-term average.
The following figures are daily observed streamflow discharge for the previous water year.
Source: USGS Surface Water