

Indiana Corn Update - Issue #30
From South to North: Tracking Indiana’s Corn Progress
(Jeferson Pimentel and Daniel Quinn)
Planting
Indiana corn planting reached 51% as of May 10, up from 42% the previous week. The crop is running well ahead of both last year (42%) and the 5-year average (37%) at this same point.
The season started slowly in early April but picked up quickly once the fields turned fit. Most of the planting progress occurred within a tight window - from 14% to 51% in just three weeks. That kind of compressed planting window is common in Indiana, and it's why being ready when conditions align matters.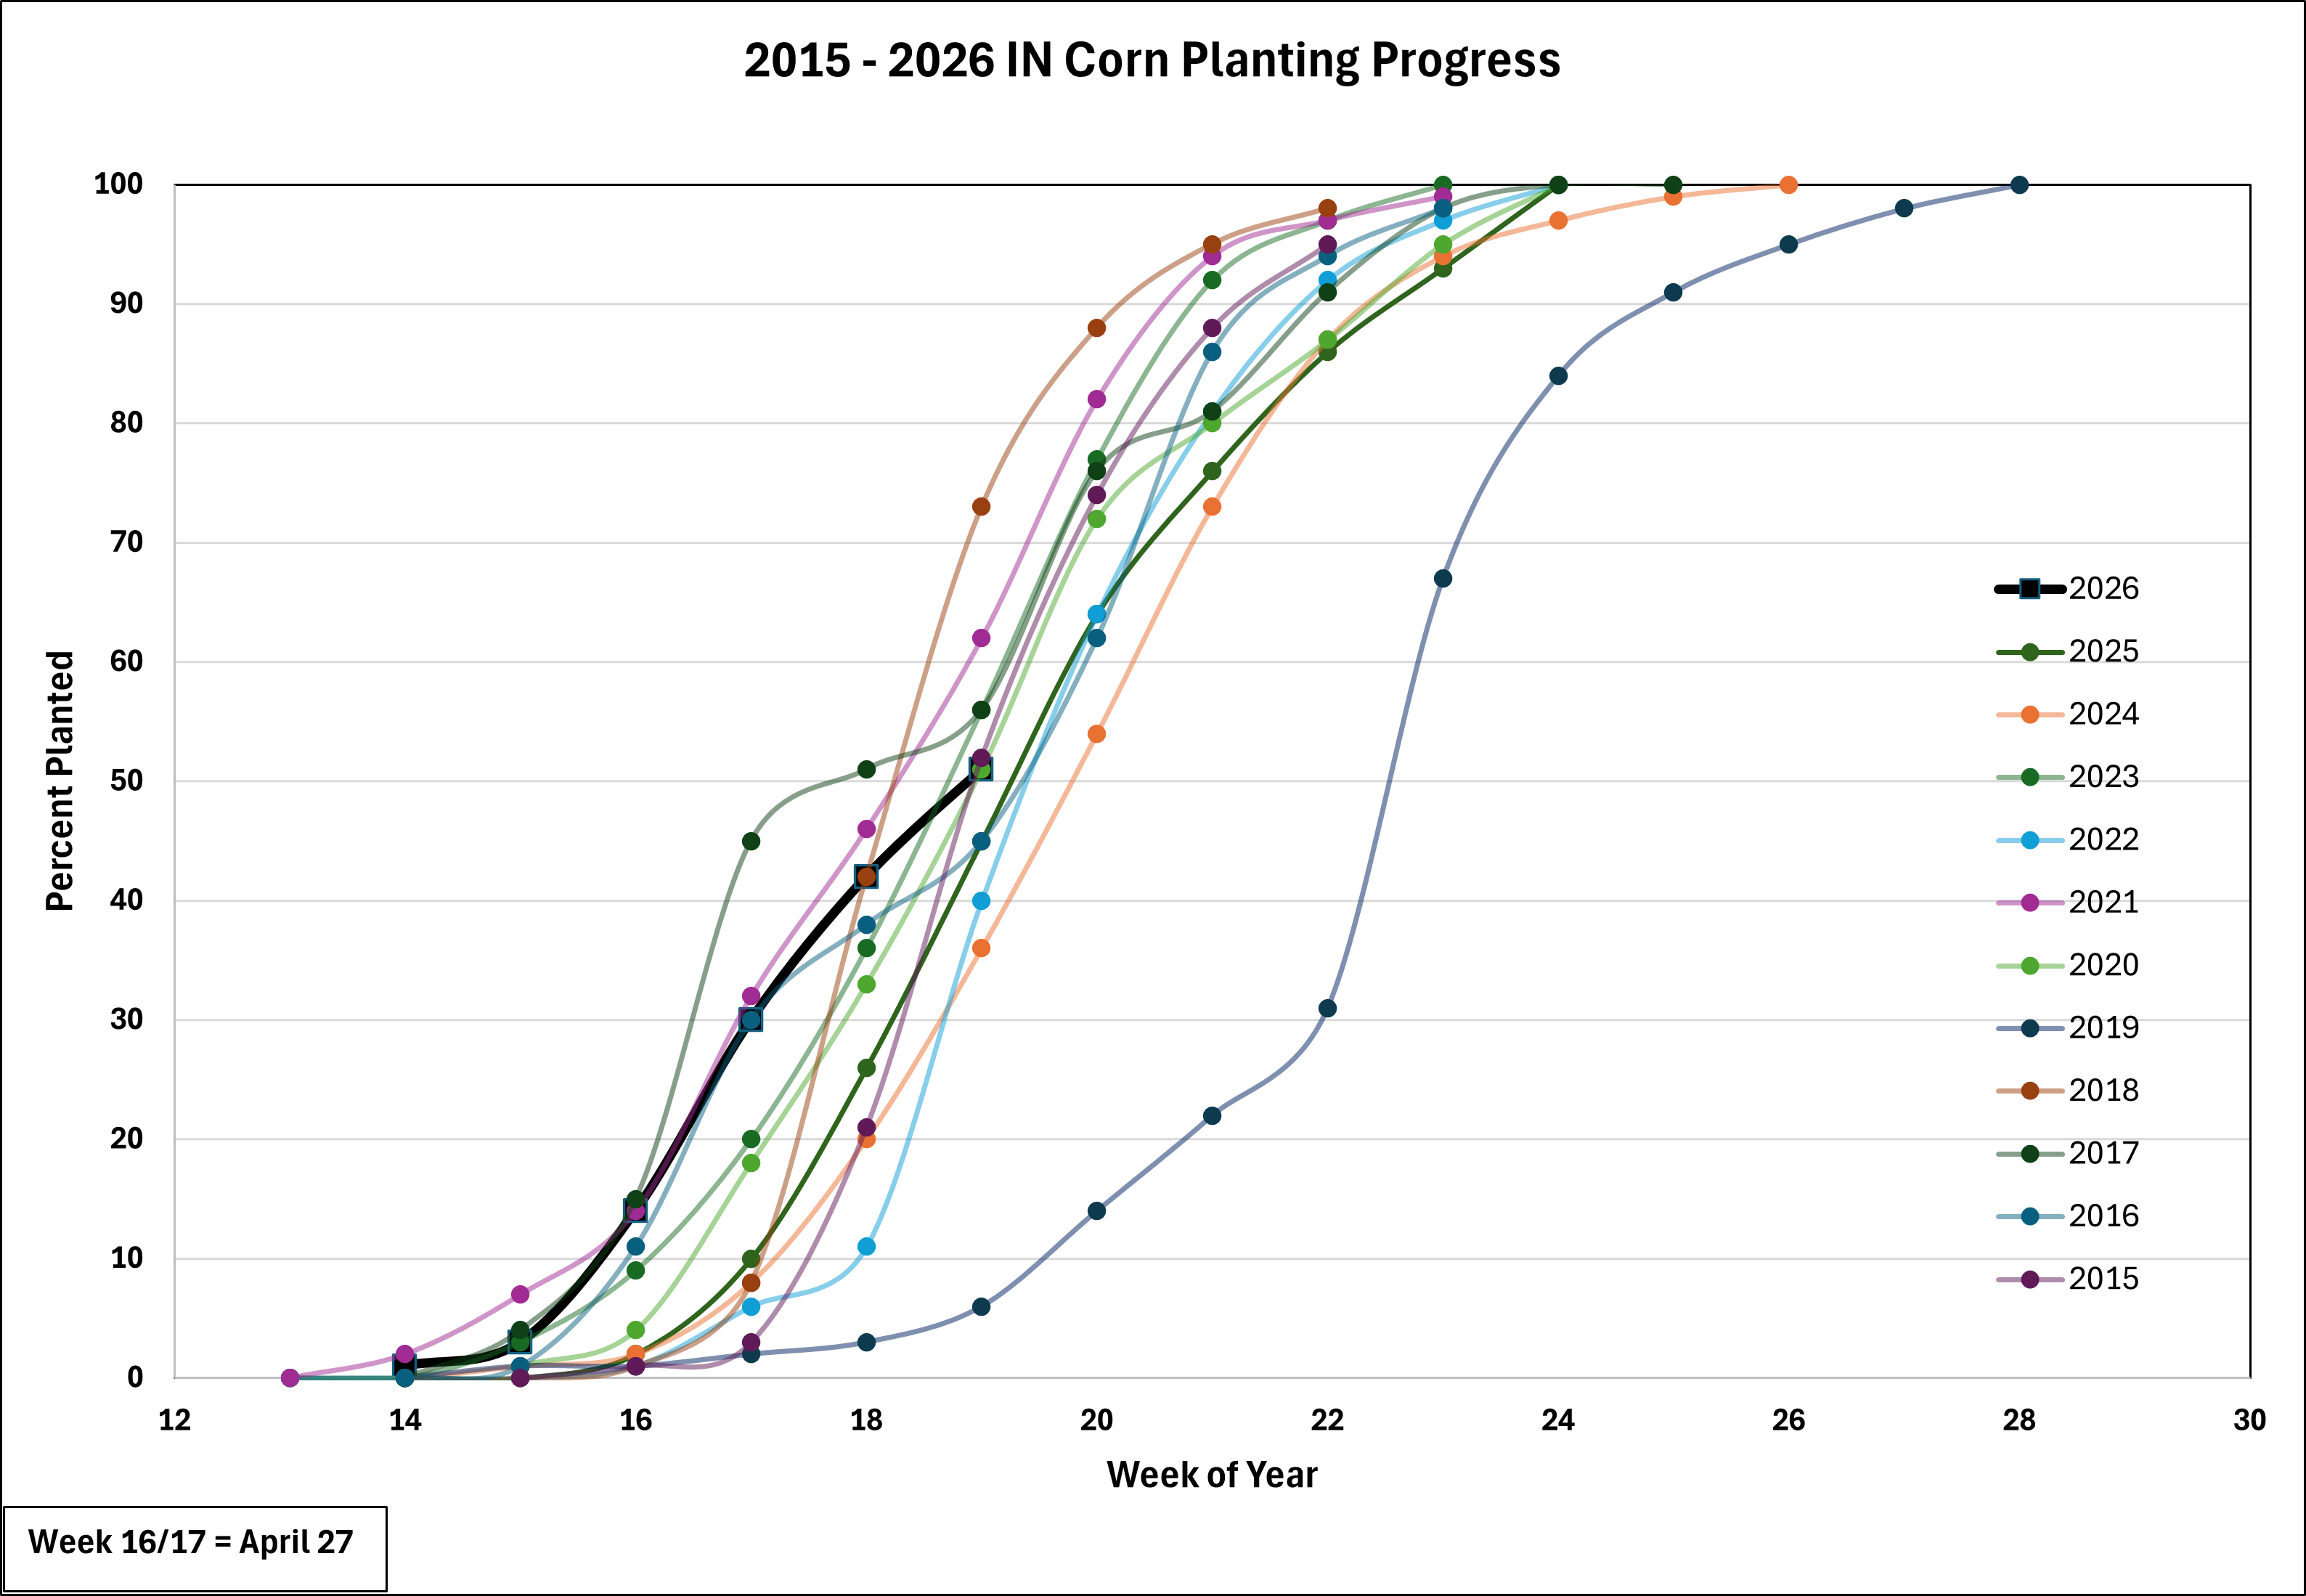
Figure 1. 2015-2026 Indiana corn planting progress by week (USDA-NASS)
Emergence
Twenty-eight percent of Indiana's corn has emerged as of May 10, compared to 17% last year and a 5-year average of 13%. That's a solid lead, but emergence numbers alone don't tell the whole story.
What matters now is how uniform that emergence is. Fields planted in early to mid-April have been in the ground for two to three weeks. Some of those fields are likely at V1–V2, while others planted into marginal conditions may be lagging. A three- to four-day spread in emergence within a field can meaningfully reduce yield potential, so it's worth walking fields and noting stand uniformity before moving on.
What to Scout For Right Now
- Stand counts and uniformity: Are plants emerging evenly, or are there skips and uneven spacing?
- Soil crusting: Recent rainfall on certain soils can form a crust that slows or prevents emergence
- Nodal root development: Early-planted corn can be vulnerable to cold, wet soils that delay root development even after emergence
Understanding Corn Germination: What to Look For
(Jeferson Pimentel and Daniel Quinn)
There's a lot going on between planting day and when those first green spikes break the surface. Knowing what's happening underground, and in what order, can help you spot problems early and make better decisions.
It Starts with Water
A corn kernel won't germinate until it soaks up about 30% of its own weight in water. If the seedbed dries out before that happens, germination stalls. If the soil keeps wetting and drying repeatedly, it can kill the seed altogether. This is why planting into good soil moisture isn't just a preference; it's what gets germination moving in the first place.
Temperature Sets the Pace
Once the seed has enough moisture, soil temperature controls everything else. Corn needs to accumulate 115–120 Growing Degree Days (GDDs) from planting to emergence (Nielsen, 2019). In plain terms, warm soil means fast emergence, cold soil means slow emergence.
- At 75°F average soil temps, corn can emerge in as few as 4 days
- At 50°F average soil temps, it can take up to 35 days
That 35-day number matters. We use 50°F as the minimum threshold for planting, and corn will germinate at that temp, but barely (Nielsen, 2019). Every extra day that seed sits in cold, wet ground is another day it's exposed to disease, insects, and herbicide residue. Warmer soils mean less risk.
The Three Steps of Germination
Germination follows the same sequence every time:
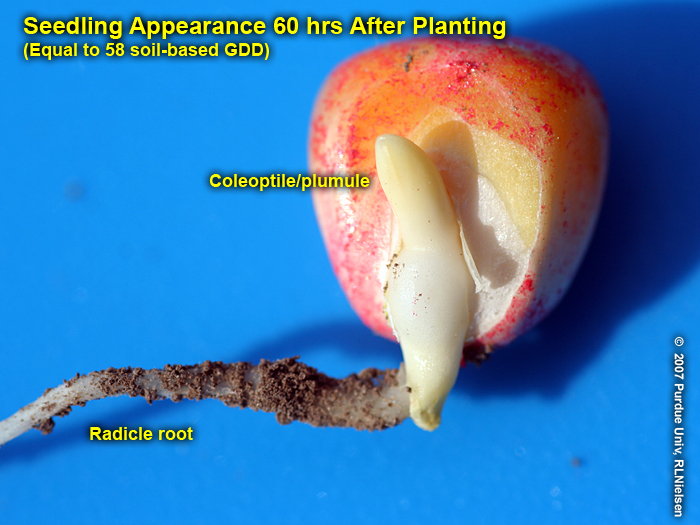
- The Radicle Root: This is the first thing to emerge, poking out near the tip of the kernel. In warm soils, it appears within 2–3 days. In cold or dry soils, it may take 1–2 weeks.
- The Coleoptile (the "spike"): Next comes the protective sheath that surrounds the embryonic leaves. It pushes upward through the soil until the leaves inside split it open at the surface. Planting depth matters here; the coleoptile has limited energy to reach the surface.
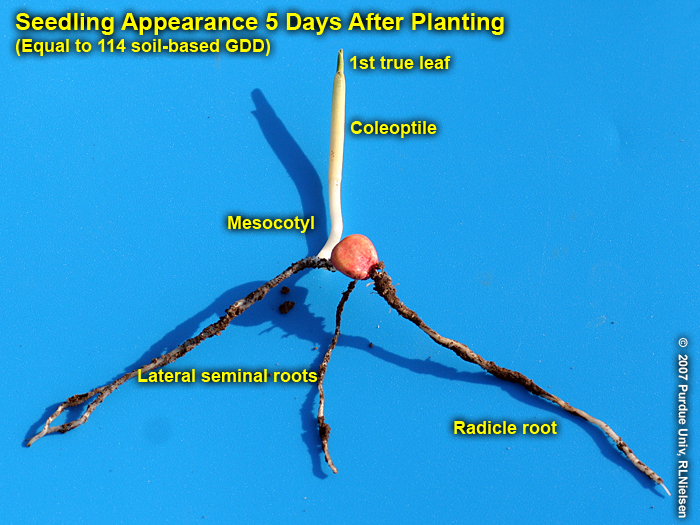
- The Lateral Seminal Roots: These are the last to appear and serve as the seedling's temporary root system until the permanent nodal roots kick in around the V1–V2 stage.
 How to Use This When Scouting
In warm soils, all three of these can appear almost the same day. In cold soils, you might see the radicle first, then wait another week or more before the coleoptile appears.
If you're two weeks out from planting and nothing has emerged, don't just stare at the field - dig. If you find kernels with a short radicle but no coleoptile yet, germination has started; it's just slow. If you find nothing at all, you may have a moisture or seed quality problem worth investigating further.
Reference
Nielsen, RL (Bob). 2019. Visual Indicators of Germination in Corn. Corny News Network, Purdue Univ. http://www.kingcorn.org/news/timeless/GerminationEvents.html.
Corn Success – Late Planted Corn Hybrid Decisions and Growing Degree Day (GDD) Compression
(Daniel Quinn - Extension Corn Specialist, Purdue University)
Depending on the year and specific location across Indiana, spring weather conditions are often unpredictable, and planting delays can extend into late May or even early June. When this occurs, one of the most common questions becomes whether to switch from a full-season to a shorter-season hybrid, and if so, what maturity selection is most appropriate. While this decision can feel challenging under time pressure, it does not need to be overwhelming. By leveraging key decision tools and accounting for factors such as date of planting and growing degree day compression, producers can make informed hybrid selection decisions in late-planted scenarios while minimizing unnecessary hybrid switches and potential yield loss.
One of the first concepts to understand is that corn relative maturity (e.g., 113-day corn) is more accurately defined by the total number of growing degree days (GDDs) required for a hybrid to progress from planting to physiological maturity (black layer). This can be confusing because a “113-day” hybrid does not require 113 calendar days to reach maturity. Instead, corn development is driven by the cumulative accumulation of thermal heat units, measured as GDDs (or GDUs). Each hybrid requires a specific number of GDDs to reach maturity, and most seed companies publish these values for reference. The practical goal, then, is to select a hybrid with enough maturity to maximize yield potential for a given location while still ensuring it can reach physiological maturity before the first killing frost in the fall. Tools such as the U2U Corn GDD decision support tool from the Midwest Regional Climate Center (https://mrcc.purdue.edu/tools/corngdd) are valuable for estimating silking and maturity dates based on planting date, hybrid selection, and location. This tool also provides projected first fall freeze dates, helping assess the risk of a killing frost before maturity. However, a key limitation is that this tool does not account for growing degree day compression when planting is delayed, which can sometimes lead to unnecessary switches to shorter-season hybrids.
A critical, and often overlooked, factor in late-planted corn is that hybrids generally require fewer GDDs to reach maturity when planting is delayed, a phenomenon often referred to as growing degree day compression. Previous research from Indiana (Nielsen, 2022) and more recent work from Michigan (Agyei and Singh, 2026) indicate that after May 1, hybrids may require approximately 6.8 to 6.4 fewer GDDs per day of planting delay. For example, a hybrid that typically requires 2800 GDDs to reach maturity when planted on May 1 would only require approximately 2600 GDDs if planting is delayed until May 30 (6.8 x 29 calendar days = 197), representing a reduction of nearly 200 GDDs. Therefore, a hybrid which requires 2800 GDDs to reach maturity when planted on May 1 in West Central Indiana has a projected maturity date of September 24, but that same hybrid planted on May 30 has a projected maturity date of only October 9 when accounting for the GDD compression. This adjustment is important because it means that full-season hybrids often remain a viable option later into the planting window than many assume, reducing the need to switch prematurely to shorter-season hybrids which may limit yield potential.
In summary, delayed planting does not automatically require an aggressive shift to shorter-season hybrids. By understanding how corn development is driven by GDD accumulation (and how GDD requirements are reduced with a later planting date via compression), producers can make more informed and confident hybrid decisions. Combining this knowledge with decision support tools and local frost risk helps ensure hybrids are appropriately matched to the growing season. Ultimately, maintaining fuller-season hybrids longer into the planting window, when conditions allow, can help preserve yield potential while still managing risk in delayed planting scenarios.
Additional References:
Agyei, B., and M. Singh. 2026. Using growing degree days in making corn hybrid maturity selections. Michigan State Univ. Ext. https://www.canr.msu.edu/news/using-growing-degree-days-in-making-corn-hybrid-maturity-selections
Nielsen, R.L. 2022. Hybrid Maturity Decisions for Delayed Planting. Corny News Network. Purdue Univ. Ext. https://www.agry.purdue.edu/ext/corn/news/timeless/hybridmaturitydelayedplant.html
When and Where Are Mycotoxins Produced in Corn?
(Aline Fachin Martíni, Postdoctoral Research Assistant & Camila Nicolli, Research Assistant Professor, Mycotoxin Fungal Biology at Purdue)
When and Where Are Mycotoxins Produced in Corn?
Most people know that ear rots are associated with mycotoxins, but what is often less understood is when those toxins are produced. The reason this is less understood is that mycotoxin production is not a single event; it is a process that unfolds throughout the growing season and can even continue after harvesting. Another reason is that mycotoxins may or may not be produced, depending on multiple factors such as environmental conditions, host susceptibility, pathogen pressure, and stress events in the field. This is why understanding the timeline of mycotoxin development is key to managing the risk of contamination in corn. Check below the stages when mycotoxins may be produced.
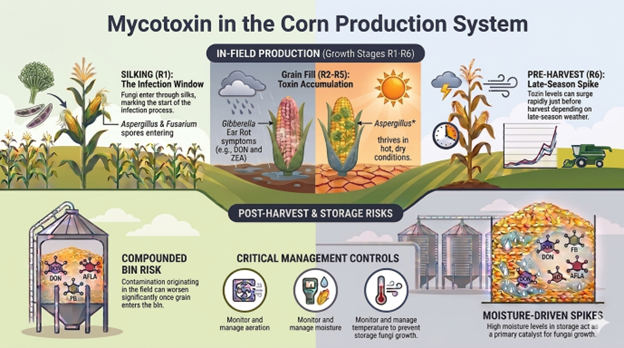
Silking: infection begins at silking, which serves as the primary entry point for fungi such as Fusarium graminearum, Fusarium verticillioides and Aspergillus flavus.
- Spores enter through the silks
- Insect damage increases susceptibility
- Heat and drought stress weaken plant defenses
Important: infection often begins at silking, and the mycotoxin production often time remains low due to early fungal colonization.
2. Grain fill: when mycotoxin accumulation may begin. As kernels develop, fungi already present in the ear can start producing mycotoxins under favorable environmental conditions.
- Warm temperatures and plant stress accelerate fungal activity
- Drought-stressed plants are especially vulnerable
- Mycotoxins like deoxynivalenol (DON), zearalenone (ZEA), fumonisins and aflatoxins may begin to increase
Note: Even in the absence of ear rot visual symptoms, mycotoxin contamination can still be accumulating.
3. Pre-harvest: a critical and sometimes underestimated window.
Late-season weather plays a major role in determining final toxin levels. It’s not uncommon for mycotoxin levels to increase right before harvesting, even when infection occurred much earlier.
- Hot, dry conditions favor aflatoxin (Aspergillus)
- Cool, wet conditions favor DON and ZEA (Gibberella)
- Delayed harvest allows continued fungal growth, and mycotoxin production
4. Post-harvest and storage: continued risk in the grain handling system
One of the most overlooked stages is grain storage and post-harvest handling. The conditions listed below can keep fungi active and, in some cases, allow mycotoxin levels to increase after harvesting.
- High grain moisture
- Warm temperatures
- Poor aeration
In practical terms, problems that begin in the field can continue, or even intensify, once grain is in storage.
Take-home message: Why this matters for management
Mycotoxins are not produced at a single moment. They result from continuous and dynamic interaction among infection, environmental conditions, and crop stress from silking through storage. Because of this, effective management requires monitoring and intervention across the entire production system, not only at harvest, but throughout the season and even after grain is stored. Understanding when and where mycotoxins are produced directly helps growers and the industry make more informed management decisions, including:
- Scouting at the right growth stage to improve risk assessment
- Timely harvest to reduce late-season exposure
- Proper drying and storage to prevent further contamination
- Testing strategies that account for weather patterns and crop history
Diagram summary:
May’s Cold Start And A Pattern Change
(Jacob Dolinger, Climatologist, Indiana State Climate Office)
The first week of May certainly didn’t feel like May as temperatures ended up 5-10°F below normal across the state (Figure 1). Daytime maximum temperatures struggled to reach 60°F across the northern half of the state, while southern areas only saw low 60s for much of the week. Using Indianapolis as a reference point given its location near the state’s geographic center, normal maximum temperatures should be near 70°F by May 7. Minimum temperatures ranged from 30s in the far north to low 40s across much of the rest of the state. The normal low temperature for Indianapolis by May 7 is 50°F. While some frost may have occurred across far northern parts of the state, minimum temperatures were still slightly too high to see widespread frost concerns, which is good news for gardeners.
There was a gradient in precipitation across the state. Much of the state from the Hoosier Heartland Highway southward observed normal to above normal precipitation. Some pockets observed over 200 percent of normal precipitation for the week (Figure 2). Despite this, precipitation was below normal across Northwest Indiana and the southwestern corner of the state in Posey County. Locations near Indianapolis and southward received 2-3 inches of precipitation during the week, while Northwest Indiana observed a maximum of 0.5-0.75 inches of precipitation for the week (Figure 3). Certain river gauges along the White River and Wabash River peaked at minor flood stage during the first few days of the month, though most have since returned to lower levels.
Precipitation in April did a good job at alleviating drought conditions. By May 5, there was only small areas of D0 (abnormally dry) and D1 (moderate drought) across the southern parts of the state along the Ohio River (Figure 4). Drought does not seem to be a concern heading through the rest of spring, as the National Weather Service’s Climate Prediction Center anticipates a likely chance of above normal precipitation through at least the rest of May. This is coupled with a pattern shift that has temperatures trending above normal through Memorial Day Weekend as well.
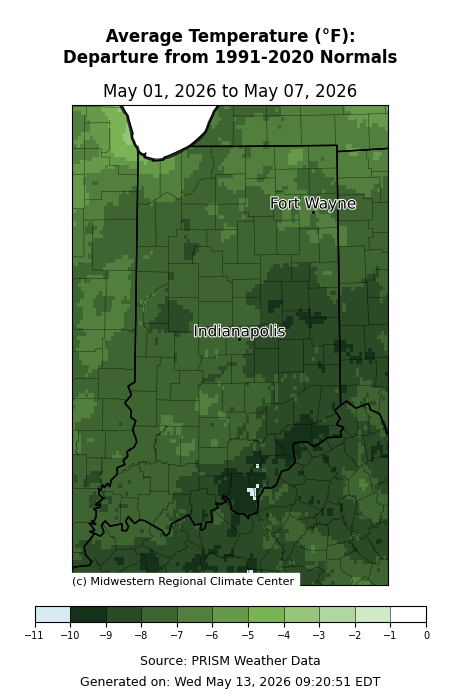
Figure 1. Departure from normal for average temperatures across Indiana. Southern and eastern parts of the state were nearly 10°F below normal for average temperatures for the first week of May.
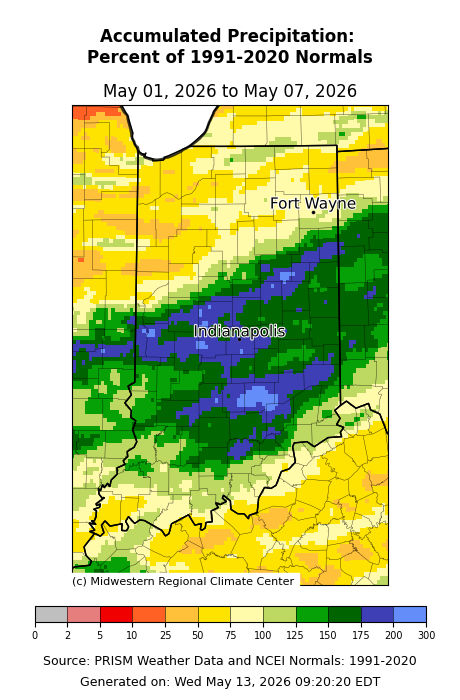
Figure 2. Percent of normal accumulated precipitation for Indiana for May 1-7. Precipitation was above normal across central and southern Indiana, and below normal to the north.
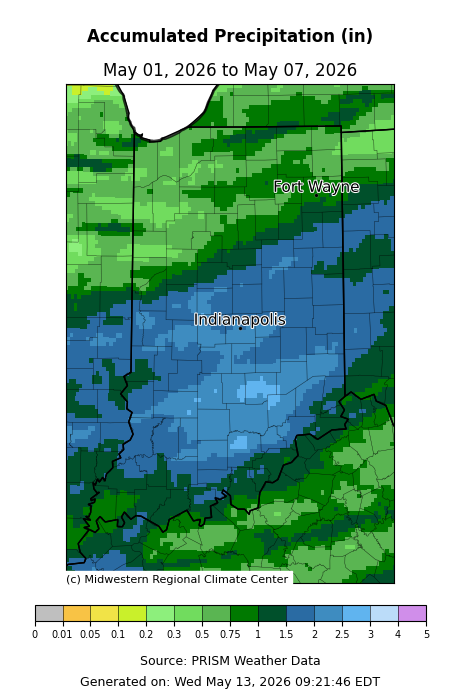
Figure 3. Accumulated precipitation for Indiana for May 1-7. Totals were highest from Indianapolis southward.
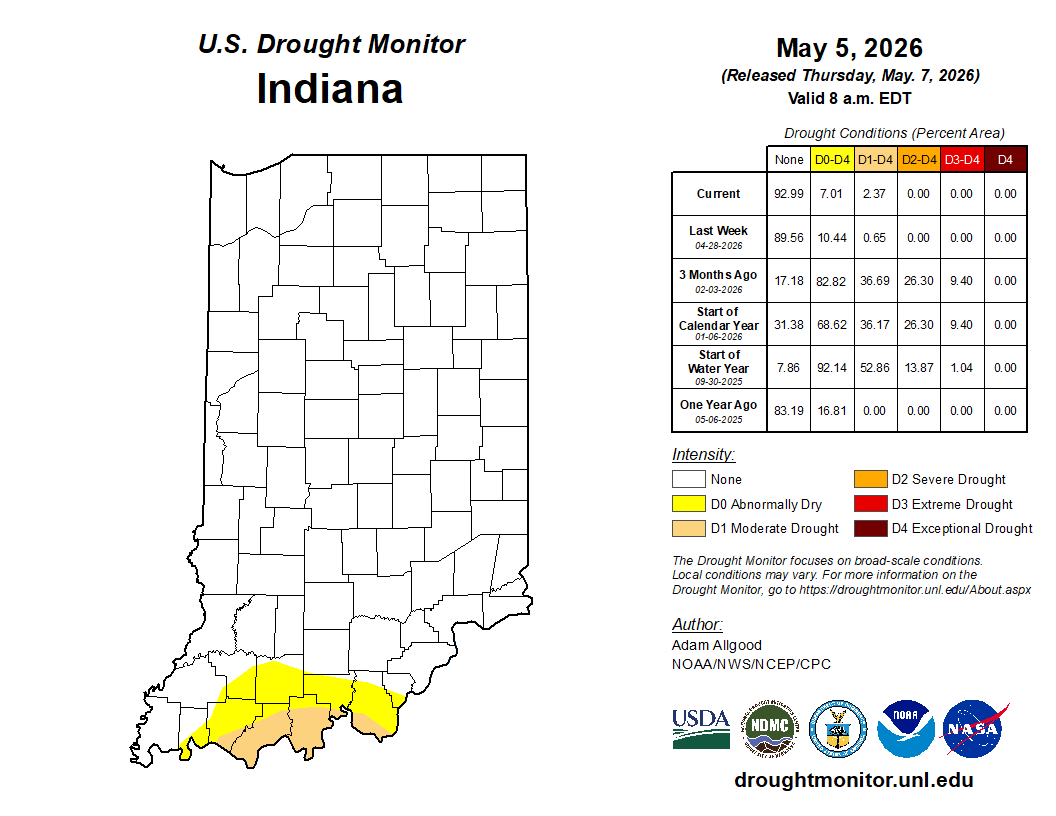
Figure 4. Drought monitor for Indiana as of May 5. Drought has improved greatly through the Spring, with the only drought conditions left in southern Indiana.
Acknowledgments
The authors greatly appreciate the feedback and contributions of all growers, county agents, consultants, and corn industry stakeholders.
Proudly Supported by: ![]()
Get the Latest Corn Agronomy Insights
Subscribe to receive research highlights, field insights, and management updates from Purdue’s Corn Agronomy program.
SUBSCRIBEPurdue
Corn Agronomy
Related News
Indiana corn progress, mycotoxins & weather
Indiana corn planting progress, & weather
Indiana corn planting progress, flooding stresses, and corn ear rot & mycotoxins
Cover crop strategies for weed control, N₂O emissions in corn, and the impacts of harvest...
Early weed control, planting conditions, and nitrogen–sulfur management influence corn...
One of the more unusual issues showing up in Indiana corn fields this summer is “tassel...