Agricultural Economics
Consumer Food Insights survey assesses 2025 grocery spending

WEST LAFAYETTE, Ind. — Consumers made substantial changes to their grocery shopping in 2025, largely driven by economic pressures, according to the December Consumer Food Insights Report (CFI).
The survey-based report from Purdue University’s Center for Food Demand Analysis and Sustainability (CFDAS) assesses food spending, consumer satisfaction and values, support of agricultural and food policies, and trust in information sources. Purdue experts conducted and evaluated the survey, which included 1,200 consumers across the U.S.
The December report breaks down long-running CFI data by household income. Furthermore, the latest survey included new questions that explored changes in consumer grocery spending behavior in 2025.
“The majority of respondents, 82%, modified their shopping behaviors,” said the report’s lead author, Joseph Balagtas, professor of agricultural economics at Purdue and director of CFDAS. “The most common adjustments were seeking sales and discounts, switching to cheaper brands, and reducing nonessential purchases.”
However, only 5% expect to continue these changes in 2026, suggesting that most view their 2025 adjustments as temporary responses rather than permanent shifts in consumer behavior, Balagtas said.
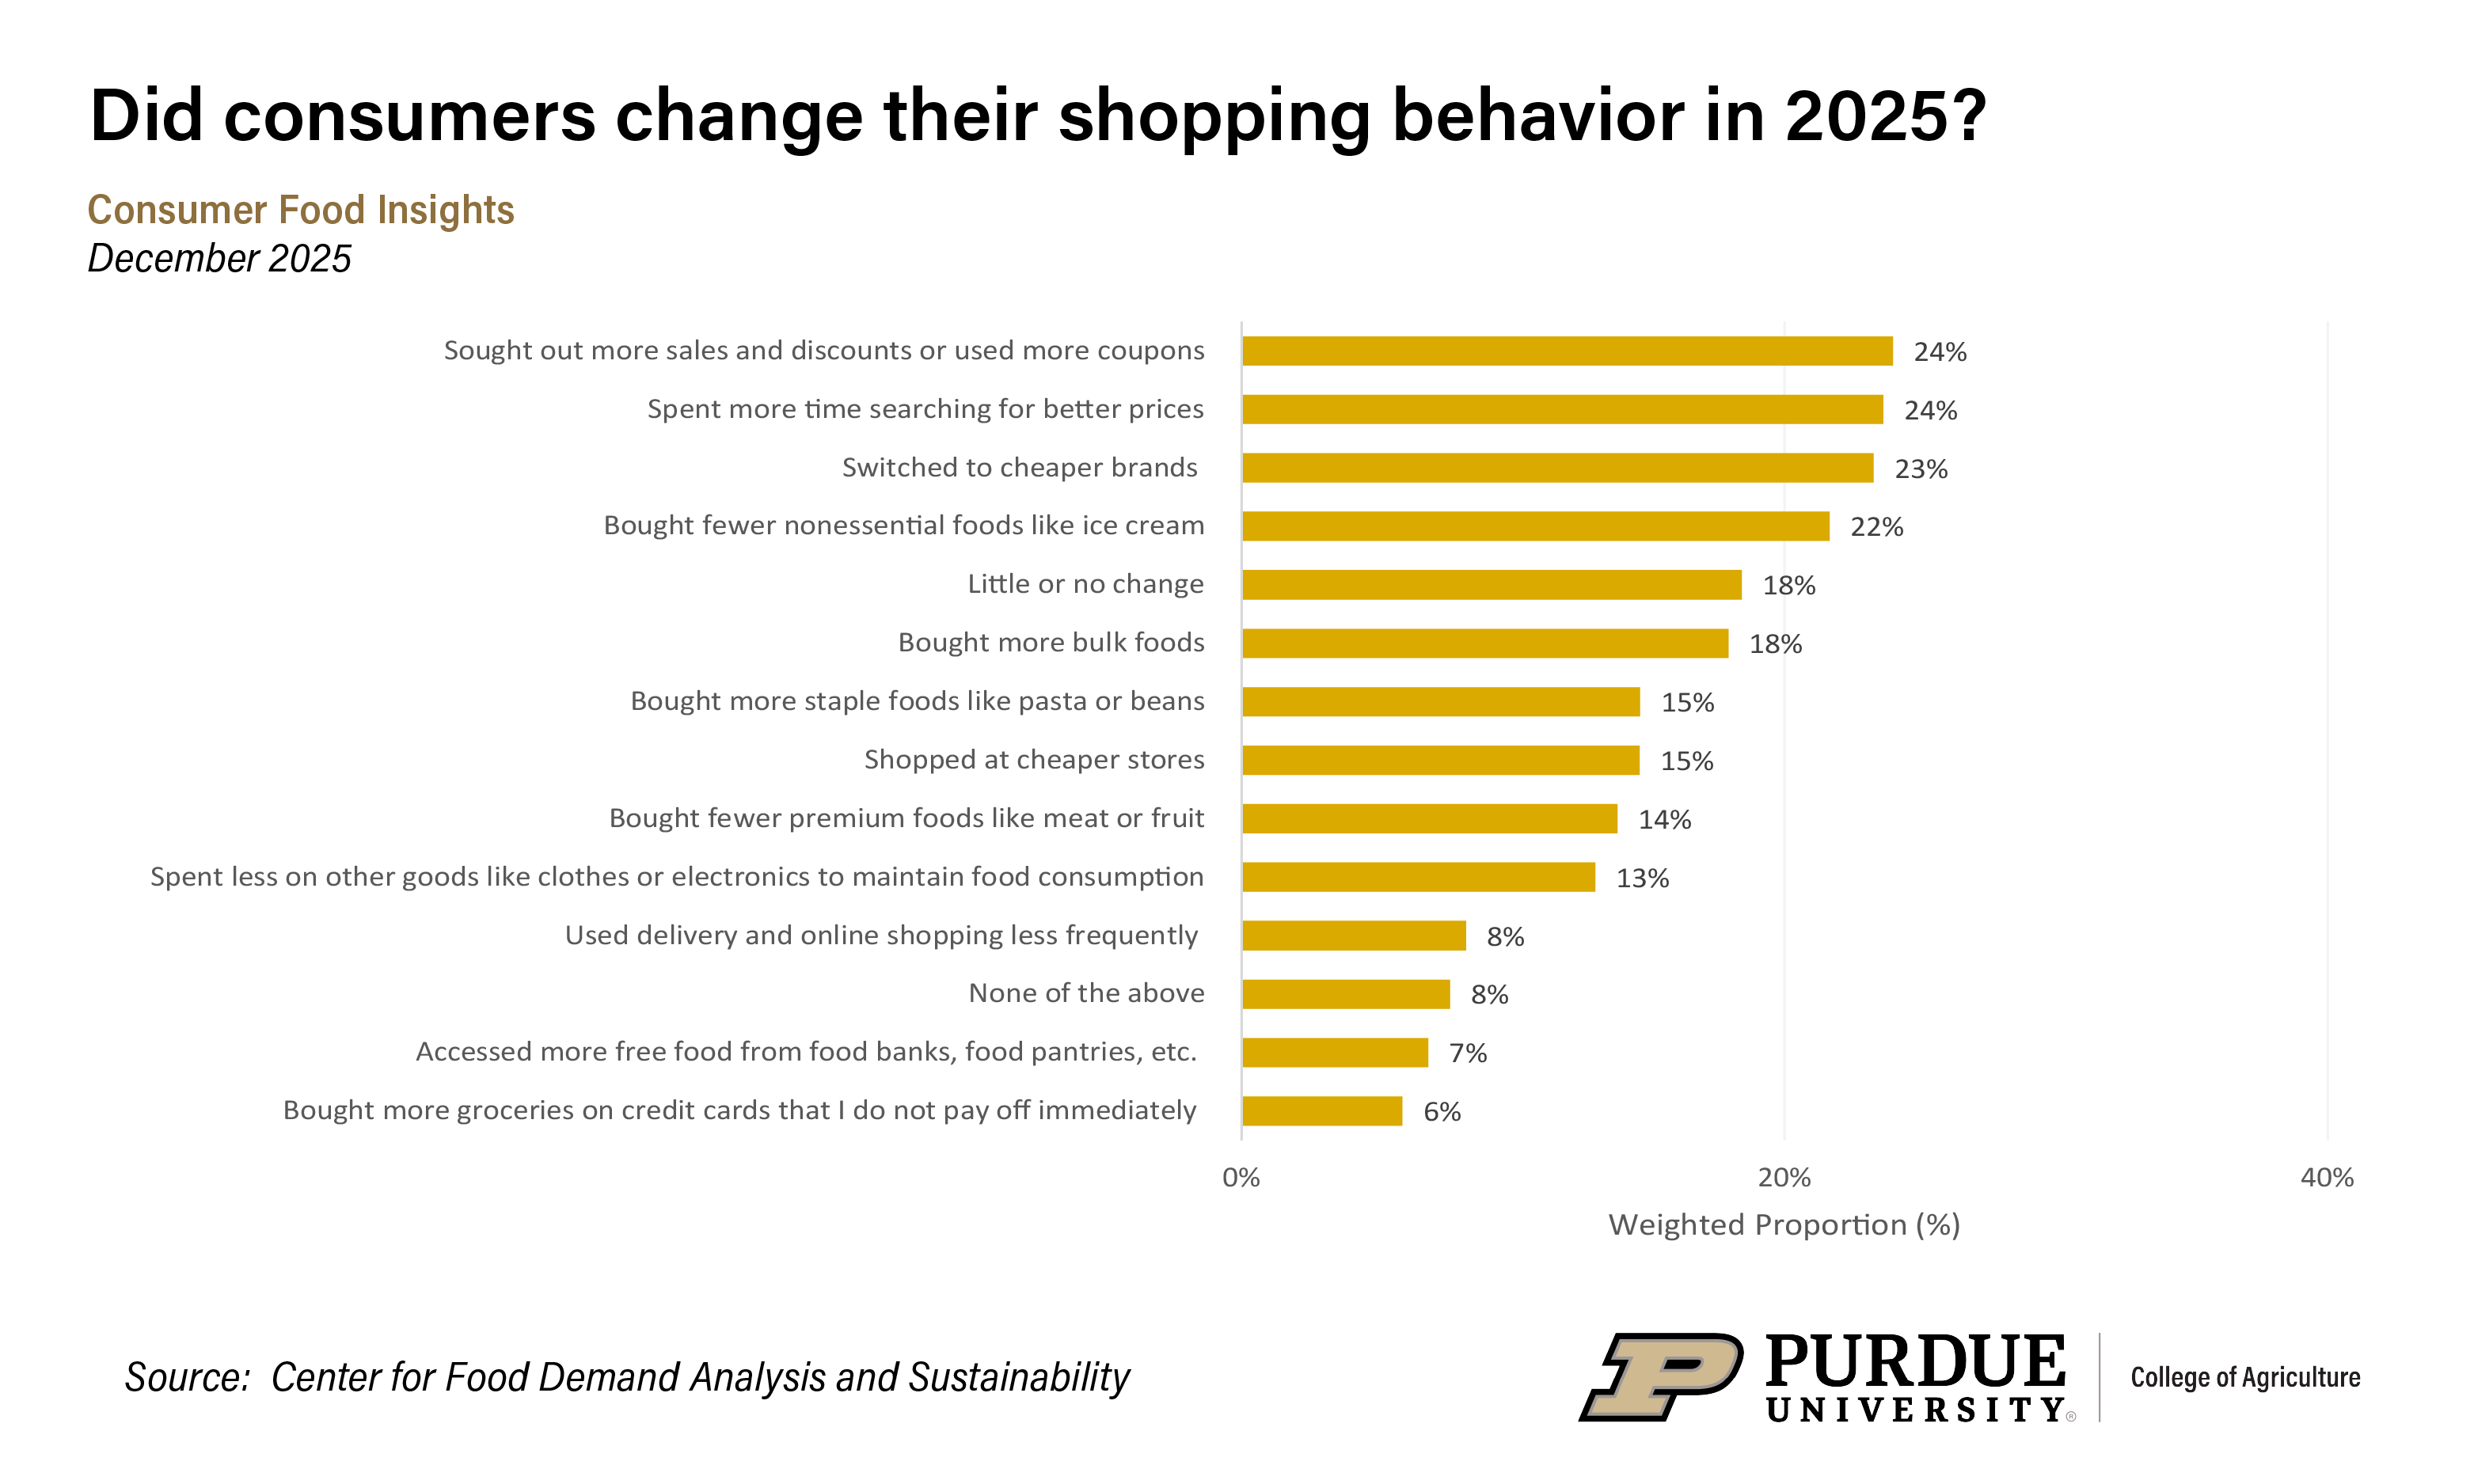 Figure 3. "How have you changed your grocery shopping in 2025? (select up to 3 items that most apply)" Dec. 2025
 Higher overall food prices primarily affected shopping changes, cited by 56% of consumers. Notably, households with incomes of $100,000-plus were more likely to cite food prices as their reason for change (63%) compared to lower-income households (52%).
In contrast, 17% of low-income households (those earning less than $50,000) indicated that reduced income or job loss motivated their shopping adjustments. Beyond food prices, higher living costs such as housing, utilities and health care also influenced spending decisions, with 29% of middle-income households citing these pressures compared to 24% of lower-income households.
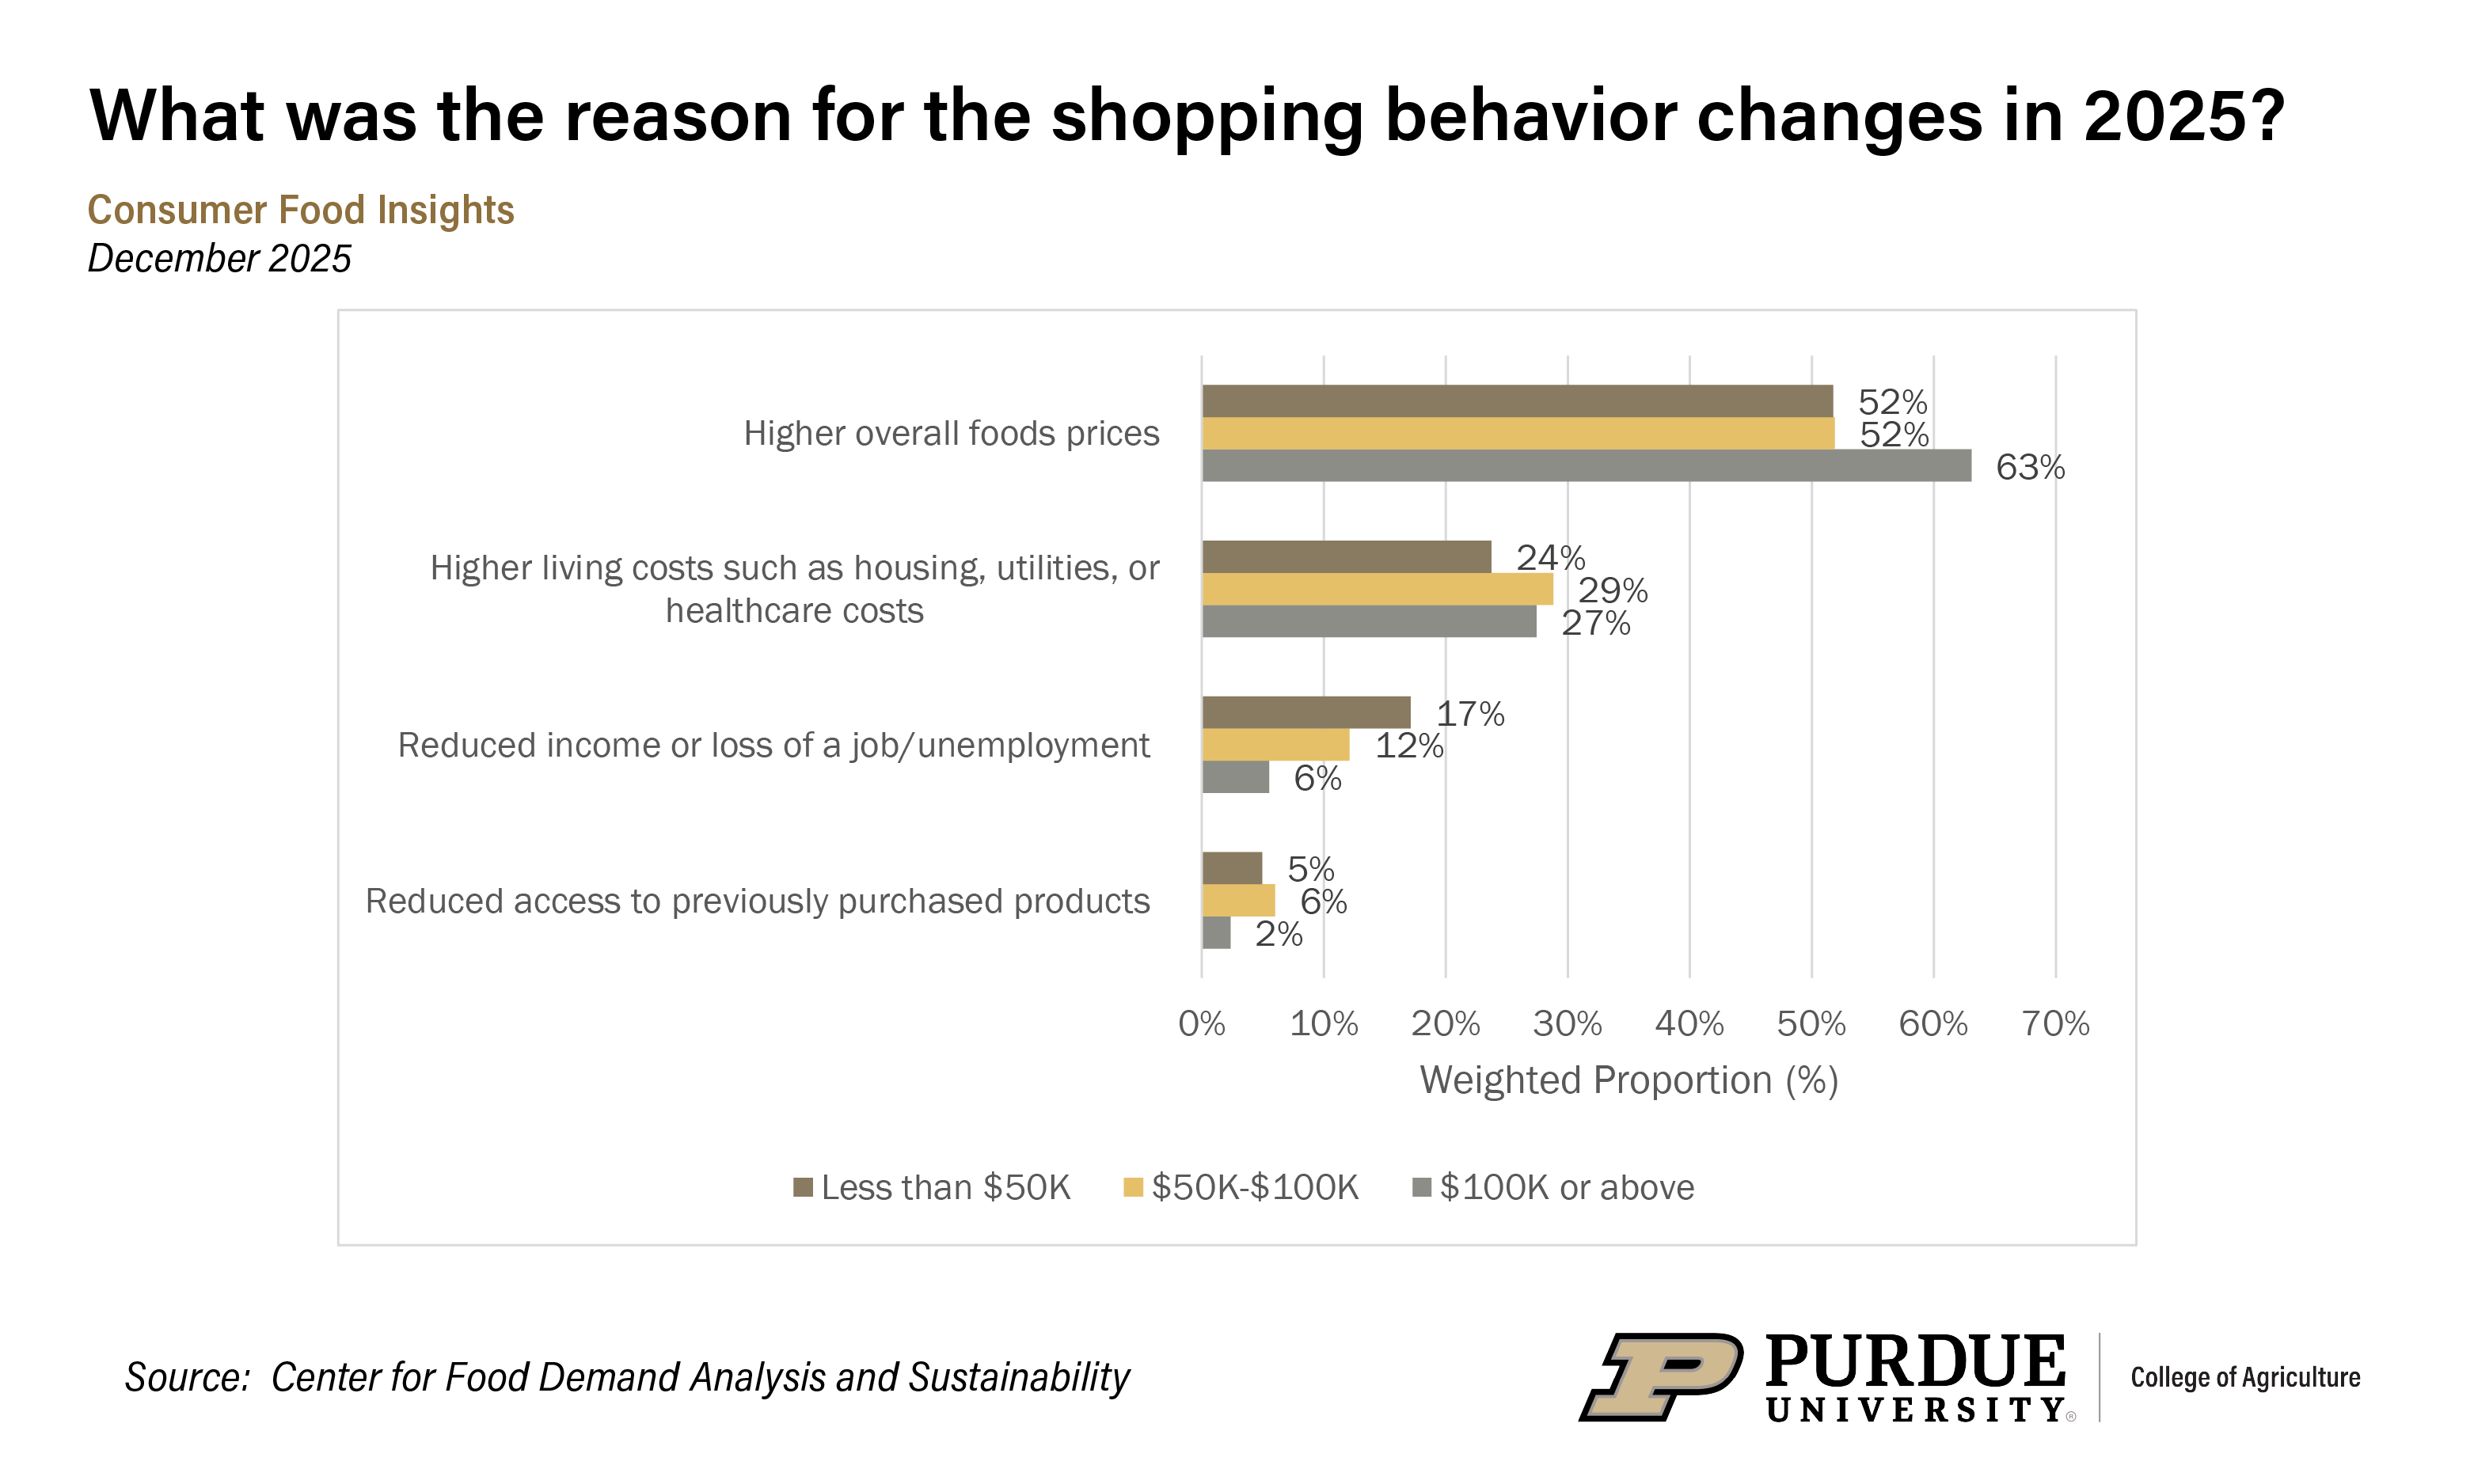 Figure 4. "Which of the following changes best describes the reason for the changes you experienced in your grocery shopping in 2025? By income" Dec. 2025
 Regarding their 2026 plans, 56% of consumers remain uncertain about sustaining their modified habits, while 40% do not expect to maintain them, reflecting uncertainty about economic conditions in the new year, Balagtas said.
National food insecurity stands at 14% in December, 2 percentage points lower than the previous month. Balagtas added that the food insecurity rate for the year was 14.2%, 1.7 percentage points higher than 2024.
Americans’ self-reported diet quality remains intermediate, with an average Mini-EAT dietary questionnaire score of 62.3, well below the healthy threshold of 69.
“Higher-income households report better diet quality scores, though all income groups fall short of healthy targets,” said Caitlinn Hubbell, a market research analyst at CFDAS and a report co-author.
Consumer food purchasing, meanwhile, remains driven by taste, safety and affordability, according to the latest Sustainable Food Purchasing Index, which held steady at an average score of 71 out of 100.
“This month, security just slightly outpaced affordability, which hasn’t been observed since June 2022,” Hubbell said. “Consistently, purchasing behaviors tied to environmental and social responsibility are less common. When disaggregated by household income, households still purchase foods based primarily on taste, affordability and safety, regardless of income level.”
Consumer food spending continues to rise. Households report spending an average of $133 weekly on groceries and $72 on dining out in December.
“While consumer estimates of food inflation have slightly declined, they remain higher than official consumer price index (CPI) figures, suggesting a persistent perception gap,” Hubbell said. “Still, consumers appear to be tracking inflation trends more closely, with their expectations aligning directionally with CPI changes. The CPI for food inflation was down 0.8% from the previous month.”
Primary care providers remain the most trusted source of food and health information across all income levels, while media outlets and food corporations receive substantially lower trust scores. “Higher-income consumers express greater skepticism toward these sources,” Hubbell said.
The Center for Food Demand Analysis and Sustainability is part of Purdue’s Next Moves in Plant Sciences 2.0 and uses innovative data analysis shared through user-friendly platforms to improve the food system. In addition to the Consumer Food Insights Report, the center offers a portfolio of online dashboards.
About Purdue Agriculture
Purdue University’s College of Agriculture is one of the world’s leading colleges of agricultural, food, life and natural resource sciences. The college is committed to preparing students to make a difference in whatever careers they pursue; stretching the frontiers of science to discover solutions to some of our most pressing global, regional and local challenges; and, through Purdue Extension and other engagement programs, educating the people of Indiana, the nation and the world to improve their lives and livelihoods. To learn more about Purdue Agriculture, visit this site.
About Purdue University
Purdue University is a research institution ranked among the top 10 public universities in the United States. More than 106,000 students study at Purdue across multiple campuses, including more than 57,000 at our main campus locations in West Lafayette and Indianapolis. As a land-grant university committed to affordability and accessibility, Purdue’s main campus has frozen tuition 14 years in a row, enabling more students than ever to graduate debt-free.
Writer: Steve Koppes
Media contact: Devyn Ashlea Raver, draver@purdue.edu
Sources: Joseph Balagtas , balagtas@purdue.edu
Agricultural Communications: Maureen Manier, mmanier@purdue.edu, 765-494-8415
Journalist Assets: Publication quality charts and images can be obtained at this link.