
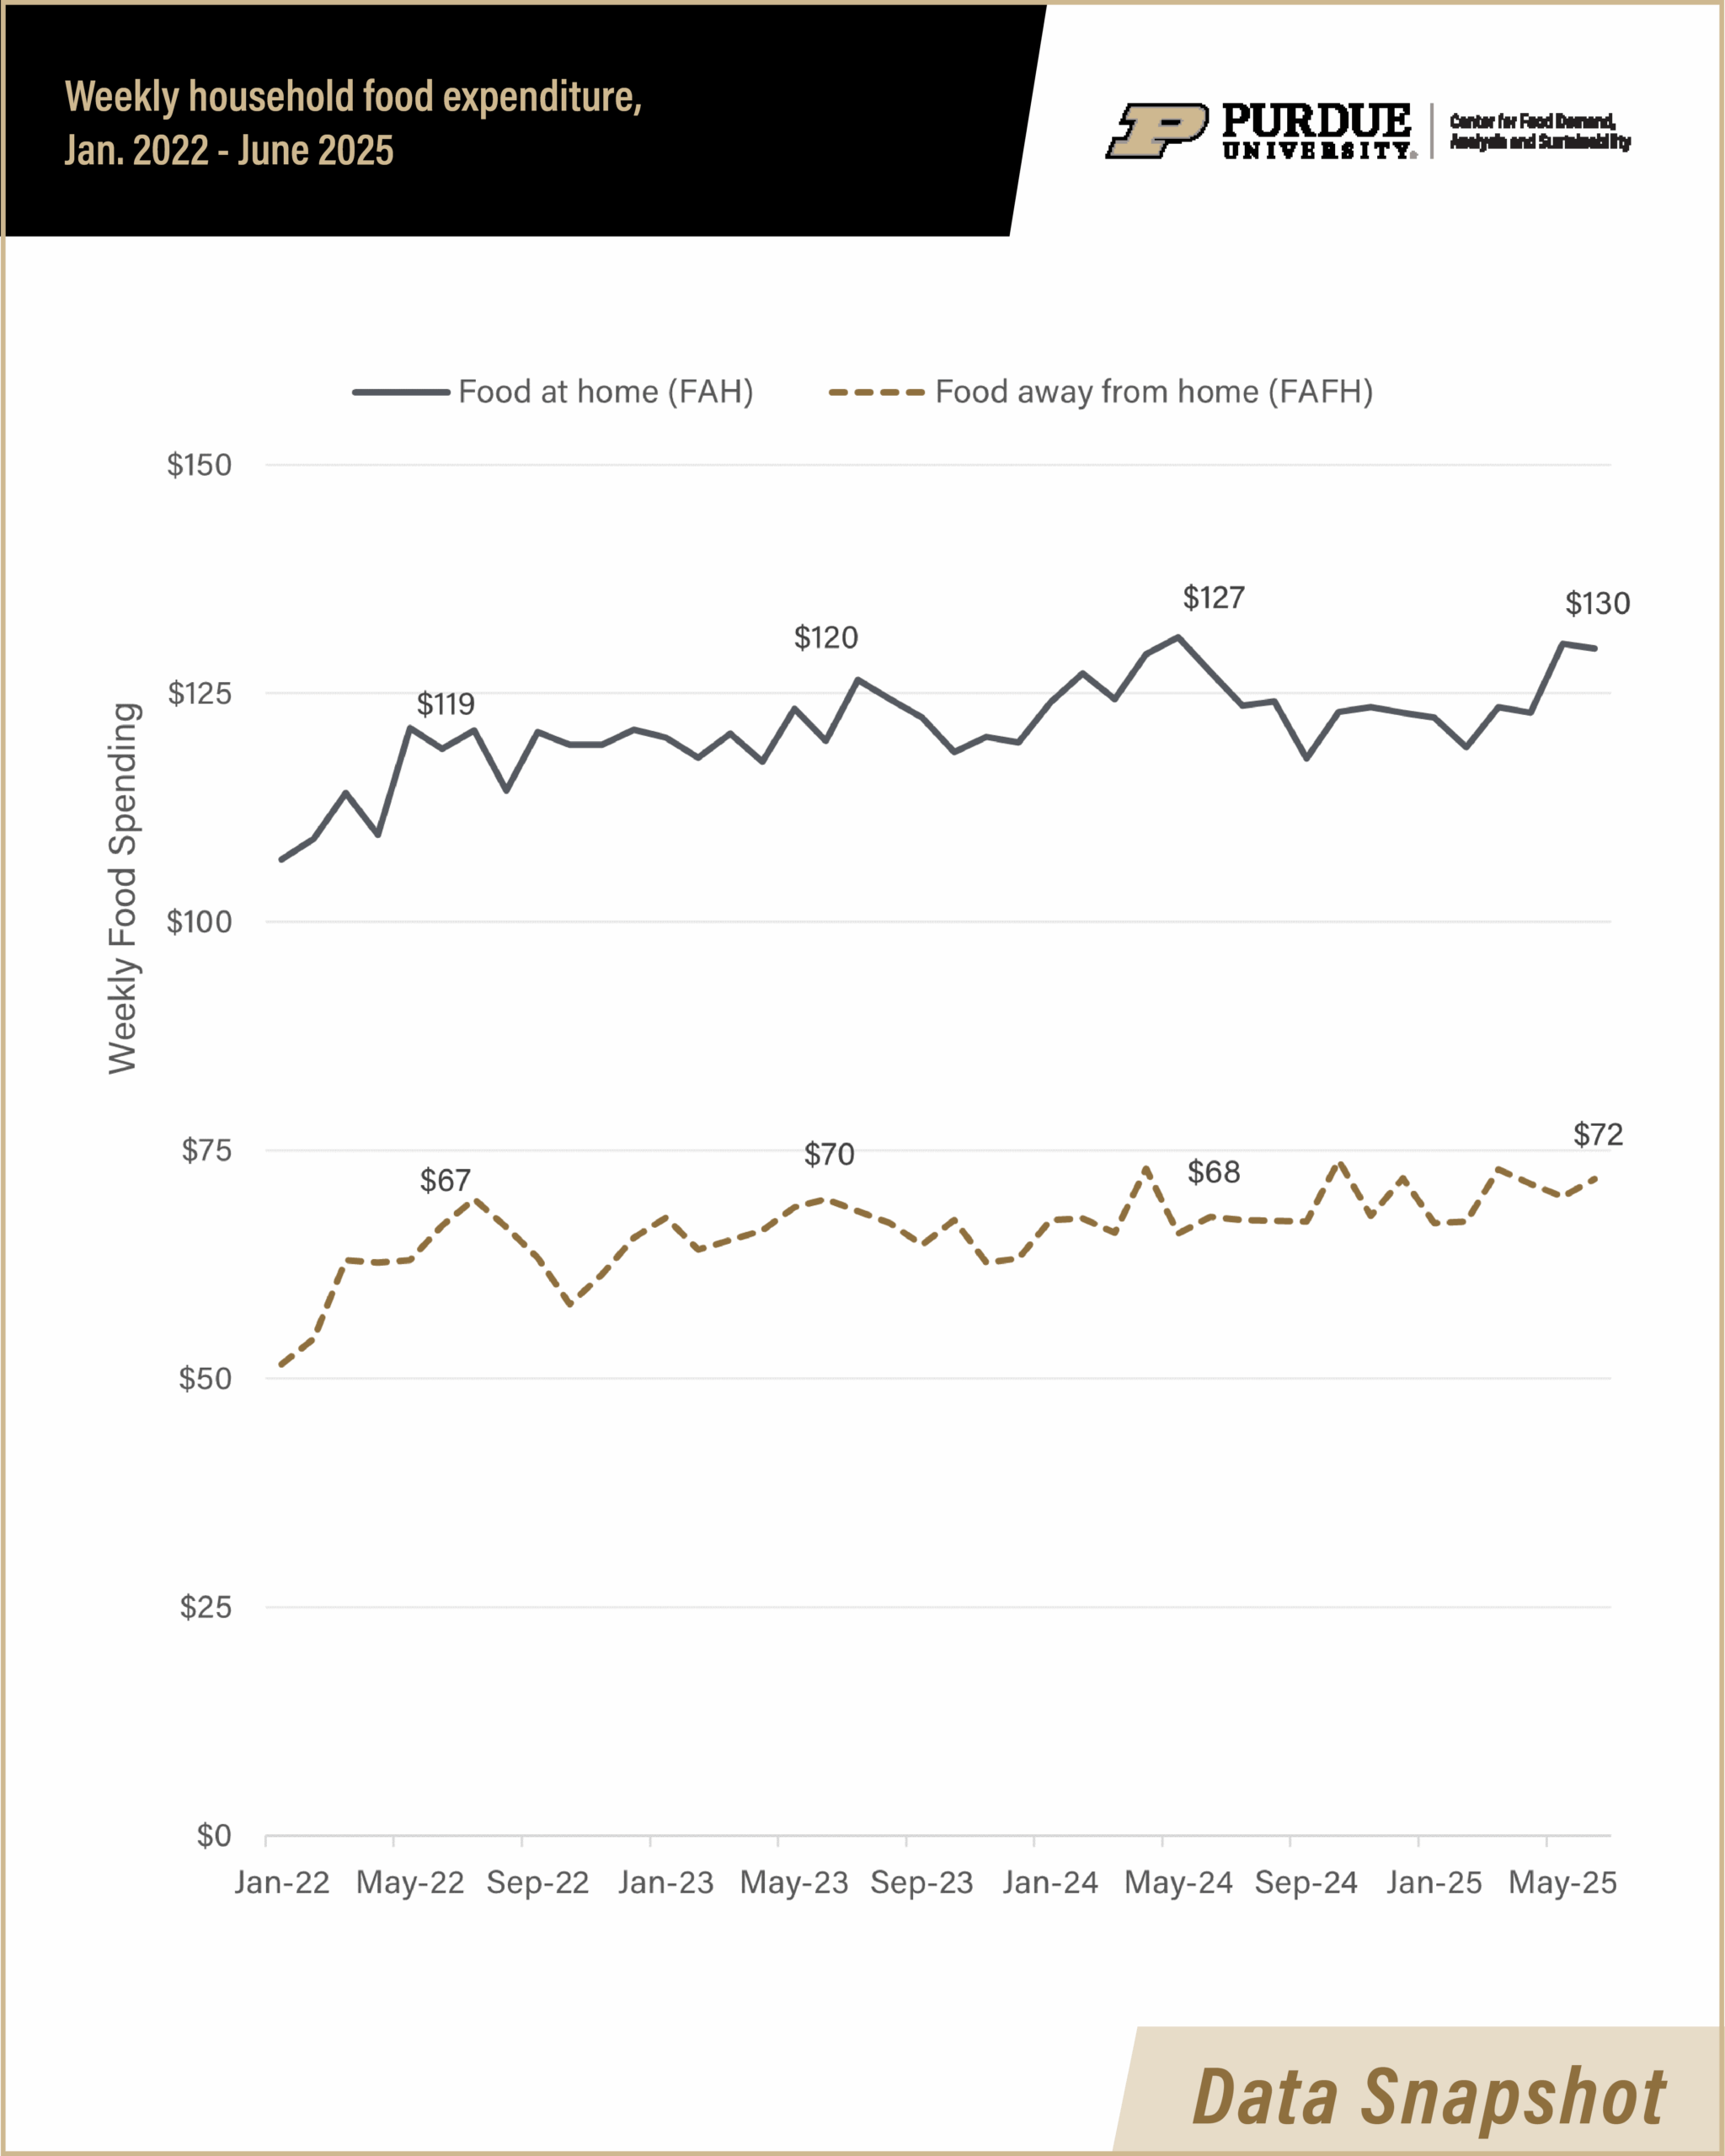
This week’s Data Snapshot features CFDAS data on weekly food expenditure in the United States. Using data from our Consumer Food Insights survey, the figure plots a nationally representative average of expenditure on food at home (aka groceries) and food away from home (aka restaurants and other food service) every month dating back to January 2022. Here we highlight two patterns in the data:
First, nominal expenditure has risen for both categories: by 2.4% for Food at Home (FAH) and 5.8% for Food Away from Home (FAFH) over the past 12 months. This is in line with official estimates of food inflation of 2.4% for FAH and 3.8% for FAFH over the same period.
Secondly, Americans on average spend most of their food budget on groceries. FAH accounts for approximately two-thirds of total food expenditure, and FAFH approximately one third.
For more on the Center’s Food Expenditure data, check out our Consumer Food Insights.
July 24, 2025