

Diet quality is a major determinant of human health and well-being. Poor nutrition is linked to increased risk of chronic diseases, leading to approximately $50 billion in health care costs annually from heart disease, stroke and diabetes alone. Given these high stakes, measuring and tracking diet quality is crucial for understanding population health and guiding effective interventions.
In the United States, a standard for assessing diet quality is the Healthy Eating Index (HEI), which measures adherence to dietary guidelines for Americans on a 100-point scale. When combined with data from What We Eat in America (WWEIA), the dietary intake interview component of the National Health and Nutrition Examination Survey (NHANES), HEI provides a nationally representative estimate of diet quality in the U.S. Data from 2017-18, the most recent HEI estimates available, paint a concerning picture: the average American over the age of 20 has an HEI of 52.3. Perhaps more troubling is that these scores have remained largely unchanged since 2010, suggesting a persistent pattern of poor dietary habits. Americans particularly struggle with consuming adequate amounts of fruits, vegetables and whole grains – fundamental components of a healthy diet.
While the NHANES provides valuable insights into American eating patterns, its biennial release of data prevents more temporal and seasonal understanding of dietary quality. The biennial schedule makes it impossible to assess diet quality changes that occur at higher frequencies, for example in response to the start or end of the school year or changes to diet quality during holidays. The lagged release — the 2021-2023 NHANES data were made available in October 2024, but an estimate of national HEI based on that data is still yet to be published — also prevents monitoring changes to diet quality in real time.
At the Center for Food Demand Analysis and Sustainability, we are excited to introduce a new tool to overcome these obstacles. In 2022, researchers at the Mayo Clinic created a short dietary assessment screener to measure diet quality. This assessment screener, called the Mini Eating Assessment Tool, or Mini-EAT™, estimates diet quality based on a short survey that elicits consumption frequency of different foods: fruits, vegetables, whole grains, refined grains, fish or seafood, legumes/nuts/seeds, low‐fat dairy, high‐fat dairy, and sweets1. The resulting Mini-EAT scores are highly correlated (r=0.71) with HEI scores calculated from a detailed dietary assessment administered to the same sample. Through an agreement with the Mayo Clinic researchers, CFDAS started implementing the Mini-EAT questionnaire in our monthly Consumer Food Insights (CFI) survey in February 2024.
For the CFI, we survey about 1,200 adults from across the U.S. every month to monitor consumer food behaviors, spending, food security, food values, food satisfaction, diet quality and general perceptions of our food system. Our sample targets respondents based on national population proportions and includes post-stratification weights calculated using age, sex, annual household income, race, region and SNAP participation.
An average of Mini-EAT scores across our sample gives us a measure of national diet quality, which we are calling Purdue’s American Diet Quality Index (PADQI). While our diet quality data should be interpreted with caution due to measurement error that is expected with all self-reported diet data, the index allows us to track American diet quality at a monthly frequency and in near-real time.
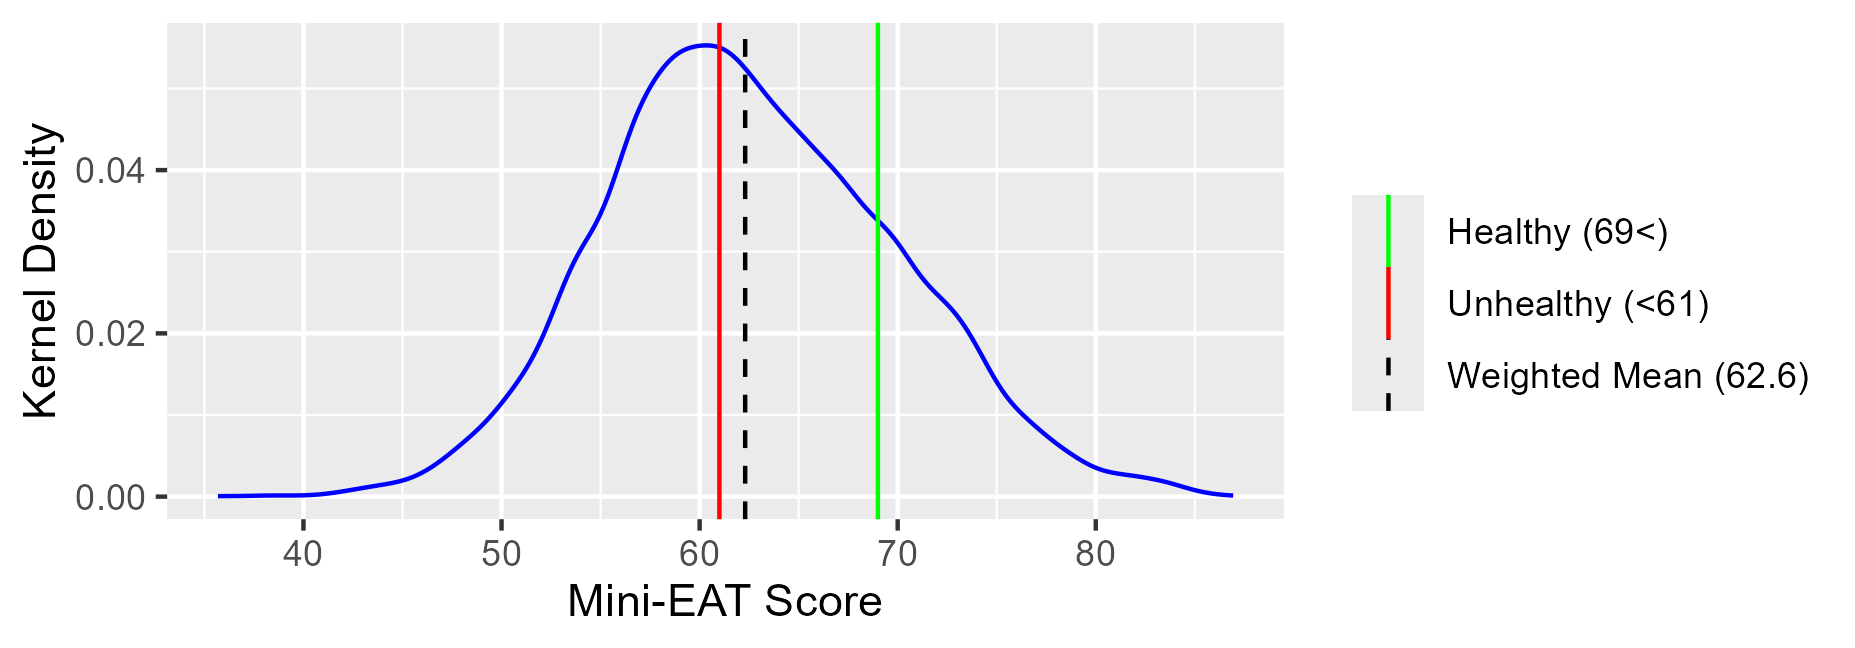
Figure 1 plots the PADQI from February 2024 through January 2025. The overall average during this period is 62.6, which falls in the “intermediate” (61-69) classification, just above the “unhealthy” (<61) threshold. The full range of the index is from 36 to 90 with diets categorized as either “unhealthy” (<61), “intermediate” (61-69) or “healthy” (69<) based on Lara-Breitinger et al. (2022).
Figure 1. Purdue’s American Diet Quality Index, Feb. 2024 – Jan. 2025
Looking at the distribution of scores (Figure 2), we observe the data concentrating right around the unhealthy threshold (61). As with HEI measured from NHANES, our index reveals a less-than-ideal snapshot of American adults’ diets. Like NHANES-based diet quality measures, our survey finds that most consumers have room to improve their diets. In the year from February 2024 through January 2025, 44% of adult Americans had a Mini-EAT score in the unhealthy range.
Figure 2. Weighted Kernel Density of Scores, Feb. 2024 – Jan. 2025
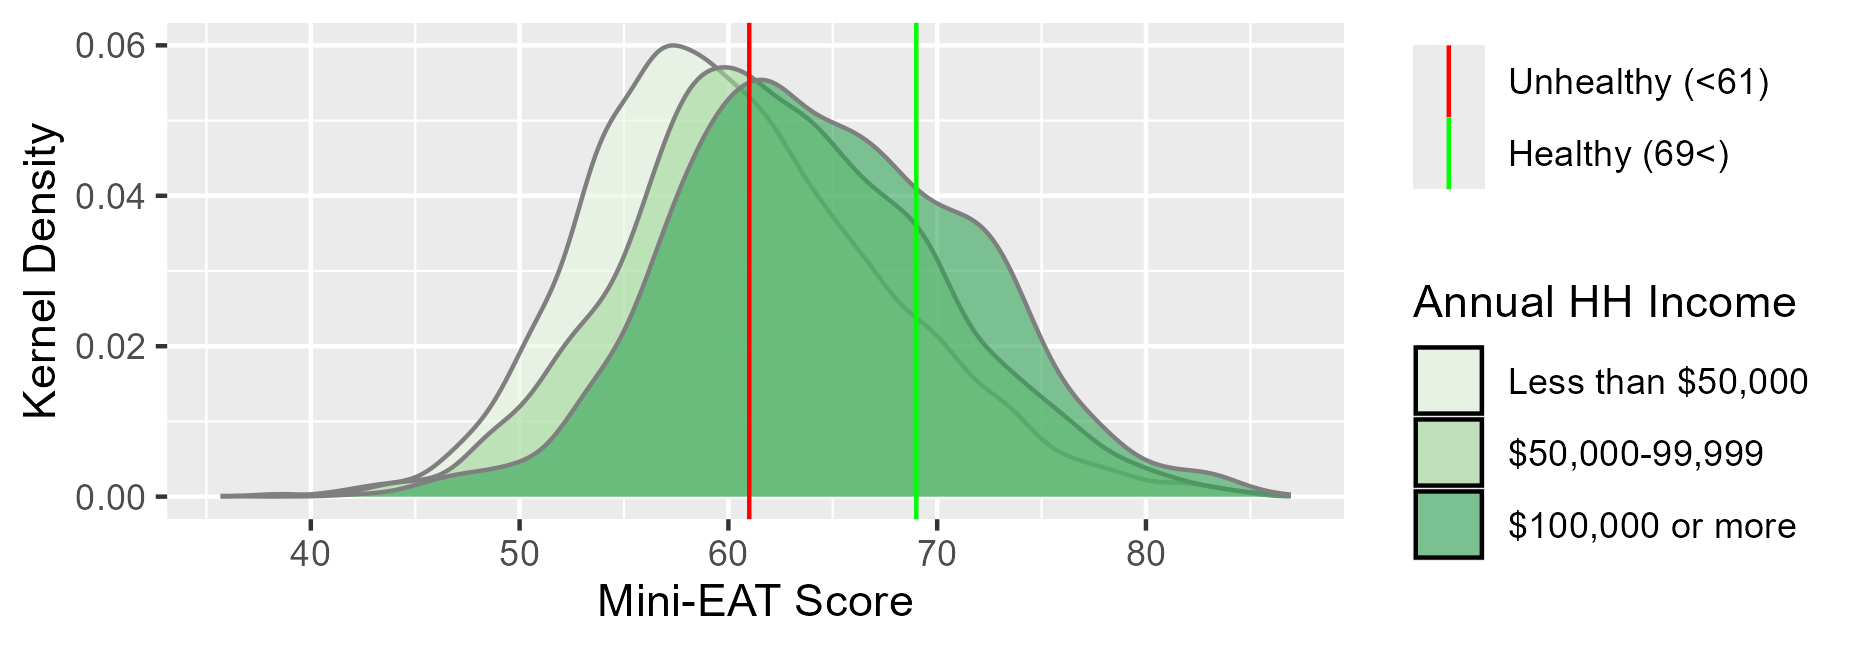
Digging a little deeper, Figure 3 reveals differences in the distribution of Mini-EAT scores by annual household income. Those in low-income households have lower average diet quality and are more likely to eat an unhealthy diet. About 57% of respondents in households making less than $50K a year fall into this category. Average diet quality increases with income, but only slightly. About 33% of adults in households with annual incomes greater than $100,000 are classified as having unhealthy diets. We have previously shown in our monthly CFI reports a strong correlation between annual household income and food security. Poor diets are more common among low-income households, but those with higher incomes who are more likely to be food secure are not eating much healthier.
Figure 3. Weighted Kernel Density of Mini-EAT Scores by Annual Household Income Groups, Feb. 2024 – Jan. 2025
Combining the Mini-EAT scores with other data from the CFI provides insights into why American adults might be eating poorly. Food values are broken down into six key attributes: taste, affordability, availability, nutrition, environmental impact and social responsibility. Since the inception of the CFI, taste has remained the most important attribute, followed by affordability. Nutrition takes the third spot. That is, many consumers are, first and foremost, eating foods that taste good, and nutrition is not the top priority. Perceptions of cost and availability may also be a barrier to eating more healthfully. Understanding these complex tradeoffs between taste, cost and nutrition is crucial for improving American diets. Our CFDAS data on Mini-EAT scores will serve as a tool for monitoring diet quality in the United States, and as a research tool for understanding how market events, technology, and policy influence American diet quality.
If you are interested in following along with American diet quality, keep an eye on our dashboard that will report Purdue’s American Diet Quality Index monthly. Our center continues to analyze how diet quality interacts with the broader food system, consumer behavior and economic conditions.
For questions and/or inquiries related to this topic, you can contact us through this form or email ehbryant@purdue.edu.
References:
- Lara-Breitinger, K.M. et al. Validation of a Brief Dietary Questionnaire for Use in Clinical Practice: Mini-EAT (Eating Assessment Tool). J Am Heart Assoc. 2023 Jan 3;12(1):e025064. doi: 10.1161/JAHA.121.025064. Epub 2022 Dec 30. PMID: 36583423; PMCID: PMC9973598.

Caitlinn Hubbell
Caitlinn currently conducts market research and writes reports on market trends and competitive analysis for CFDAS. She received her bachelor’s degree in food science from Purdue University in 2019 and her master’s degree in Agricultural, Food and Resource Economics from Michigan State University in 2021.

Elijah Bryant
Eli is responsible for achieving research objectives through the creation, administration, dissemination, analysis and communication of surveys. He received his bachelor’s degree in economics and marketing in 2020 and his master’s degree in economics from the University of Wyoming in 2023.

Joseph Balagtas
Joseph is a professor in the department of agricultural economics at Purdue University. He provides strategic direction and cultivates internal and external relationships. His research expertise is in the topics of the economics of agricultural markets, including agricultural and food policy, the industrial organization of agricultural markets and poverty and food security. In recent years, he’s served as a senior economist for the White House’s Council of Economic Advisers. He holds a Ph.D. in agricultural economics from the University of California, Davis.

Annapurni Subramaniam
Anna is responsible for designing, developing, and maintaining online data dashboards. She received her master’s degree in Computer Science from the Missouri University of Science and Technology (Missouri S&T) and bachelor’s degree in Commerce from the University of Bombay.