October 16, 2026
Differences in Sentiment Among Corn and Soybean Producers
by Michael Langemeier and Joana Colussi


Monthly releases of the Purdue University-CME Group Ag Economy Barometer (AEB) report focus on average index values. However, sentiment varies substantially among respondents, and the extent of this variation changes from month to month. Results from the September 2026 AEB survey provide insight into these differences among corn and soybean producer respondents. The AEB index is computed monthly to gauge sentiment among approximately 400 U.S. agricultural producers (Langemeier and Colussi, 2026).
The barometer’s index for September 2026 was 123, indicating that average sentiment was more positive than during the index’s base period (i.e., the fourth quarter of 2015 and the first quarter of 2016). The AEB index is subdivided into two sub-indices: the Index of Current Conditions (ICC) and the Index of Future Expectations (IFE). In September 2026, the ICC was 105 and IFE was 131.
Variability in Monthly Producer Sentiment
The average AEB index is computed and reported monthly. In addition to the average AEB index, two measures of dispersion are also computed. The “negativity” index reports the percentage of farms in each month that had an AEB index of zero. An index of zero means that farm financial performance was worse this year, that they expect their operation to be financially worse off a year from now, that they expect bad times for the agricultural economy over the next 12 months and the next 5 years, and that now is a bad time to think about large farm investments.
Figure 1 illustrates average monthly producer sentiment, as measured with the AEB index, and monthly negativity since the inception of the AEB index project (i.e., late 2015). The AEB index is significantly negatively correlated with negativity. When the AEB index is low, negativity tends to be high and vice versa. The lowest AEB index occurred in March 2016, while the highest AEB index occurred in October 2020. The lowest amount of negativity occurred in October 2020 and the highest in November 2016.
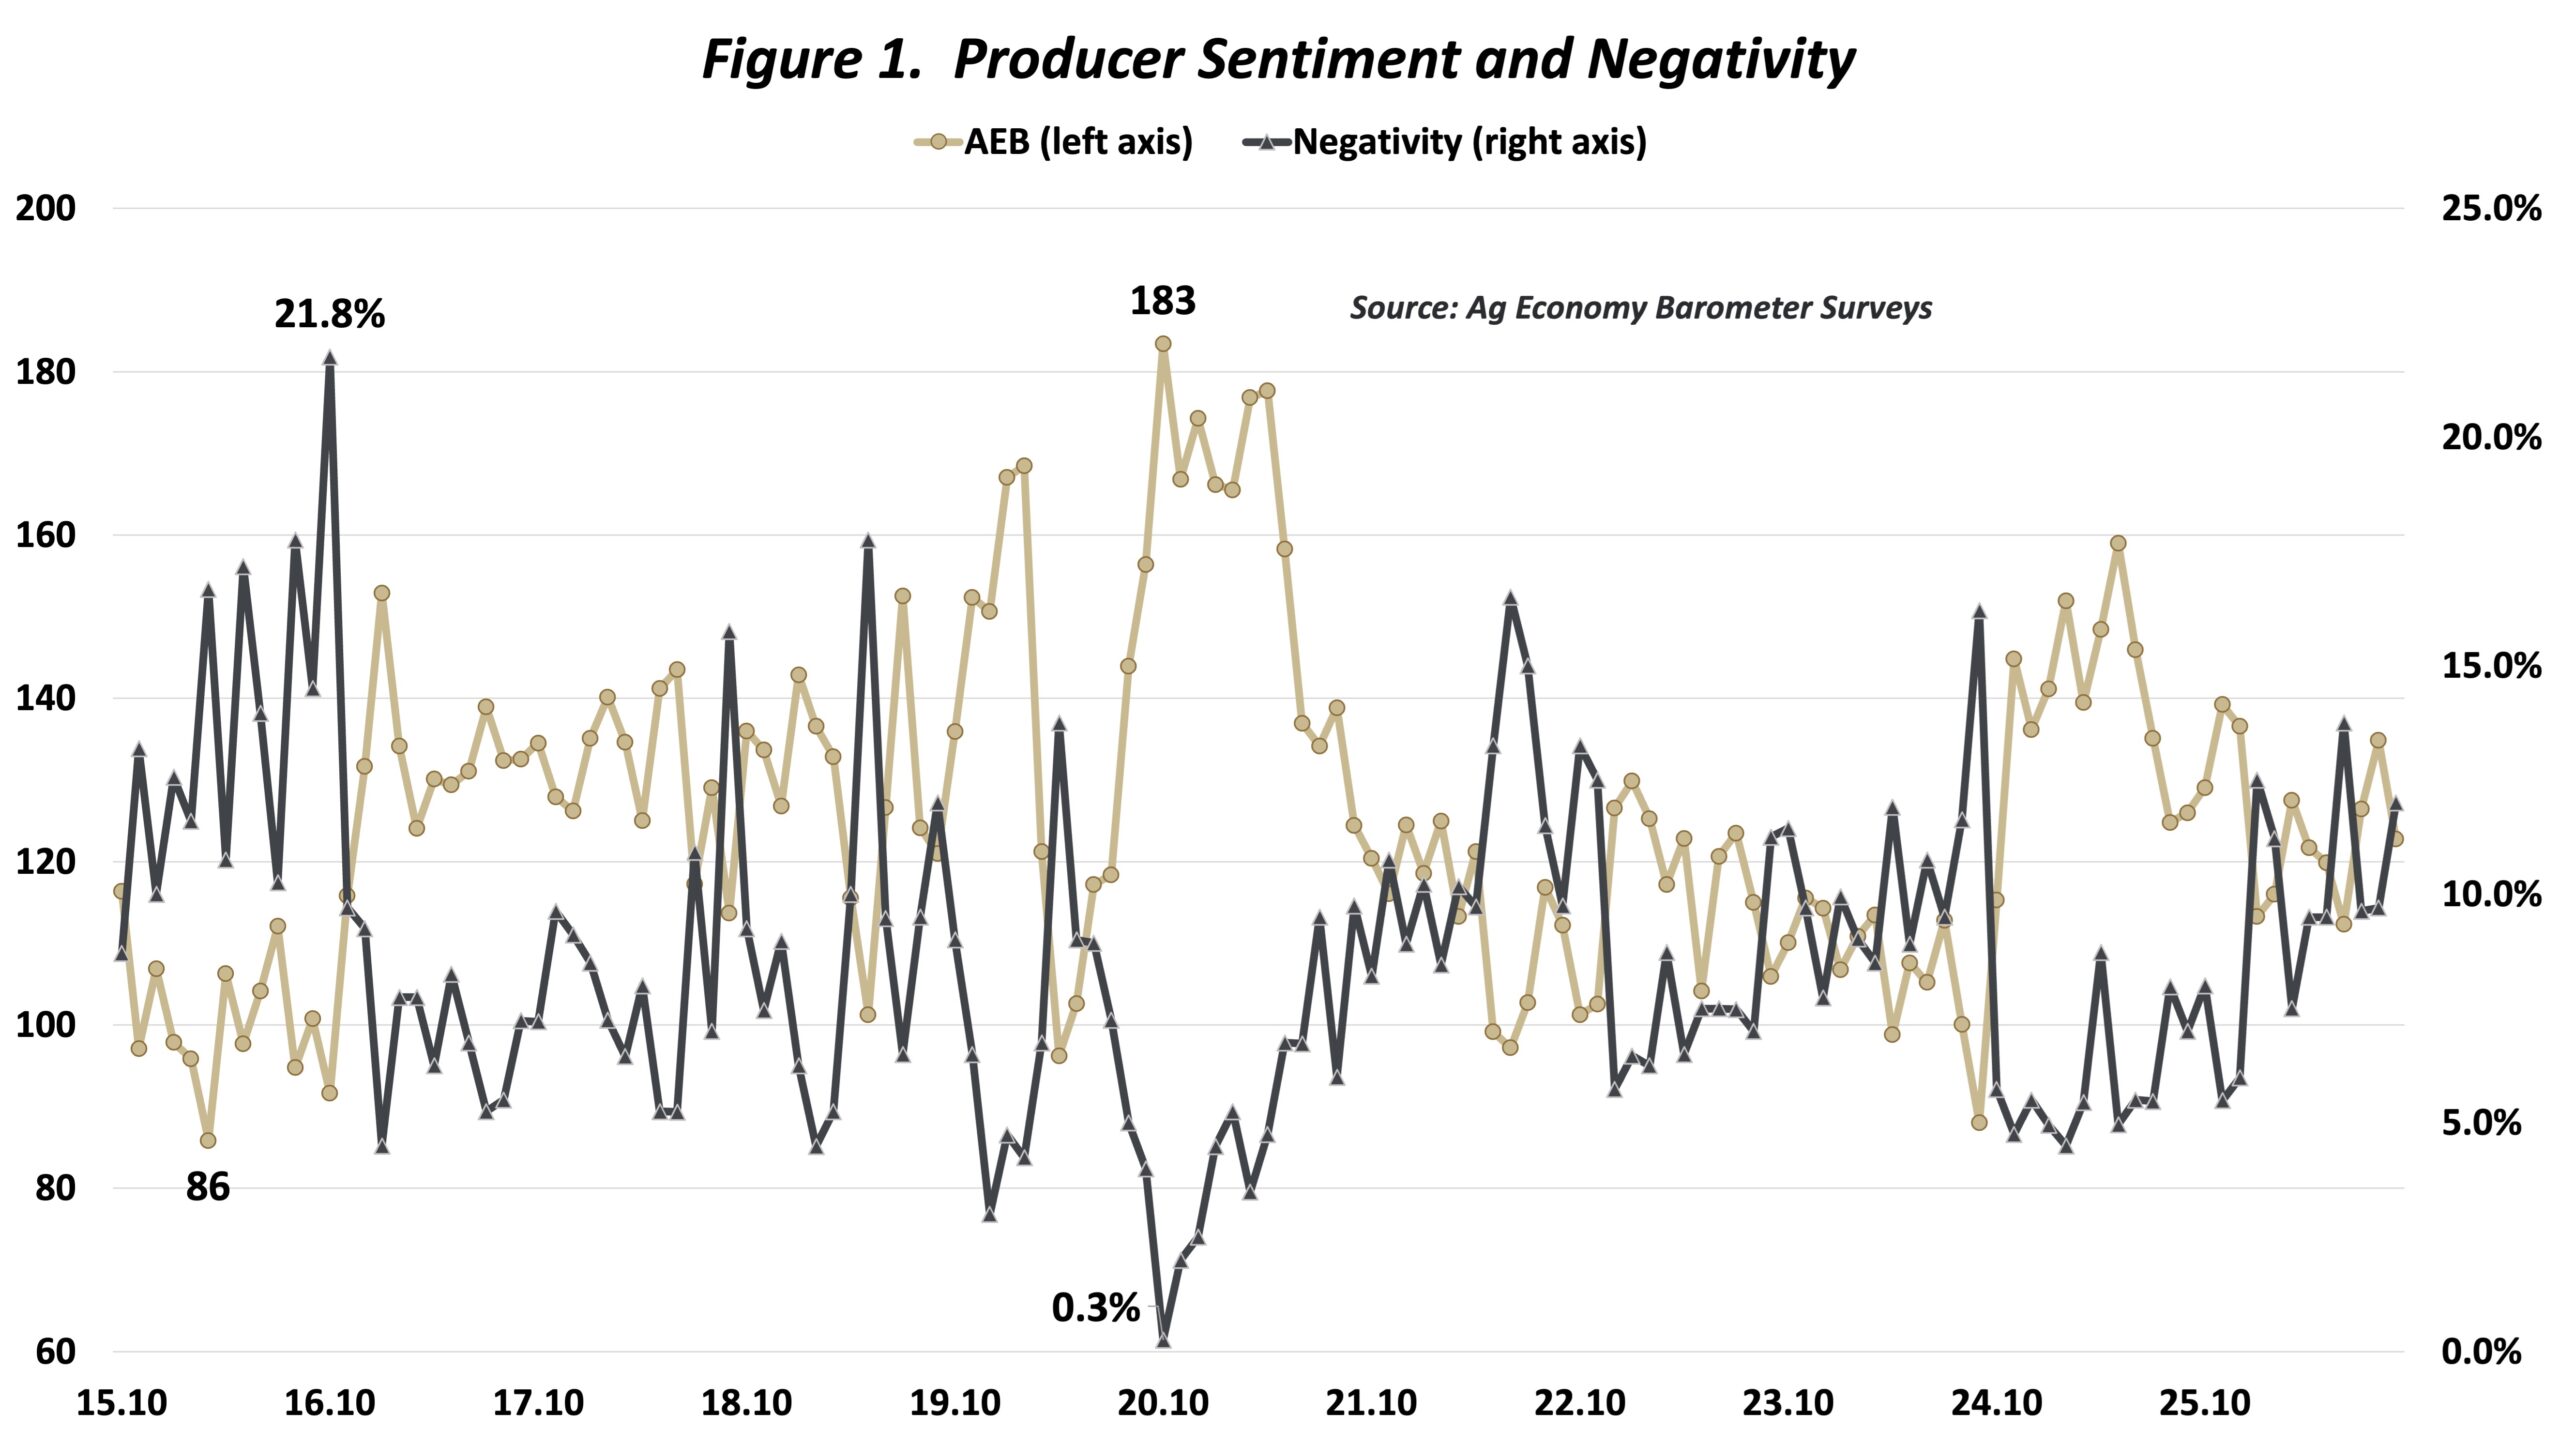
Figure 1. Producer Sentiment and Negativity
To more fully capture trends in negativity, Figure 2 illustrates monthly negativity along with a line showing the historical average of negativity since the inception of the survey. On average, 8.7% of the respondents had an AEB index of zero. Examining negativity over the last couple of years, 16.2% of respondents had an AEB index of zero in September 2024. From October 2024 through December 2025, negativity was at or below average. Apart from March 2026, negativity has been above average since January 2026. In September 2026, 12.0% of all respondents had an AEB index of zero.
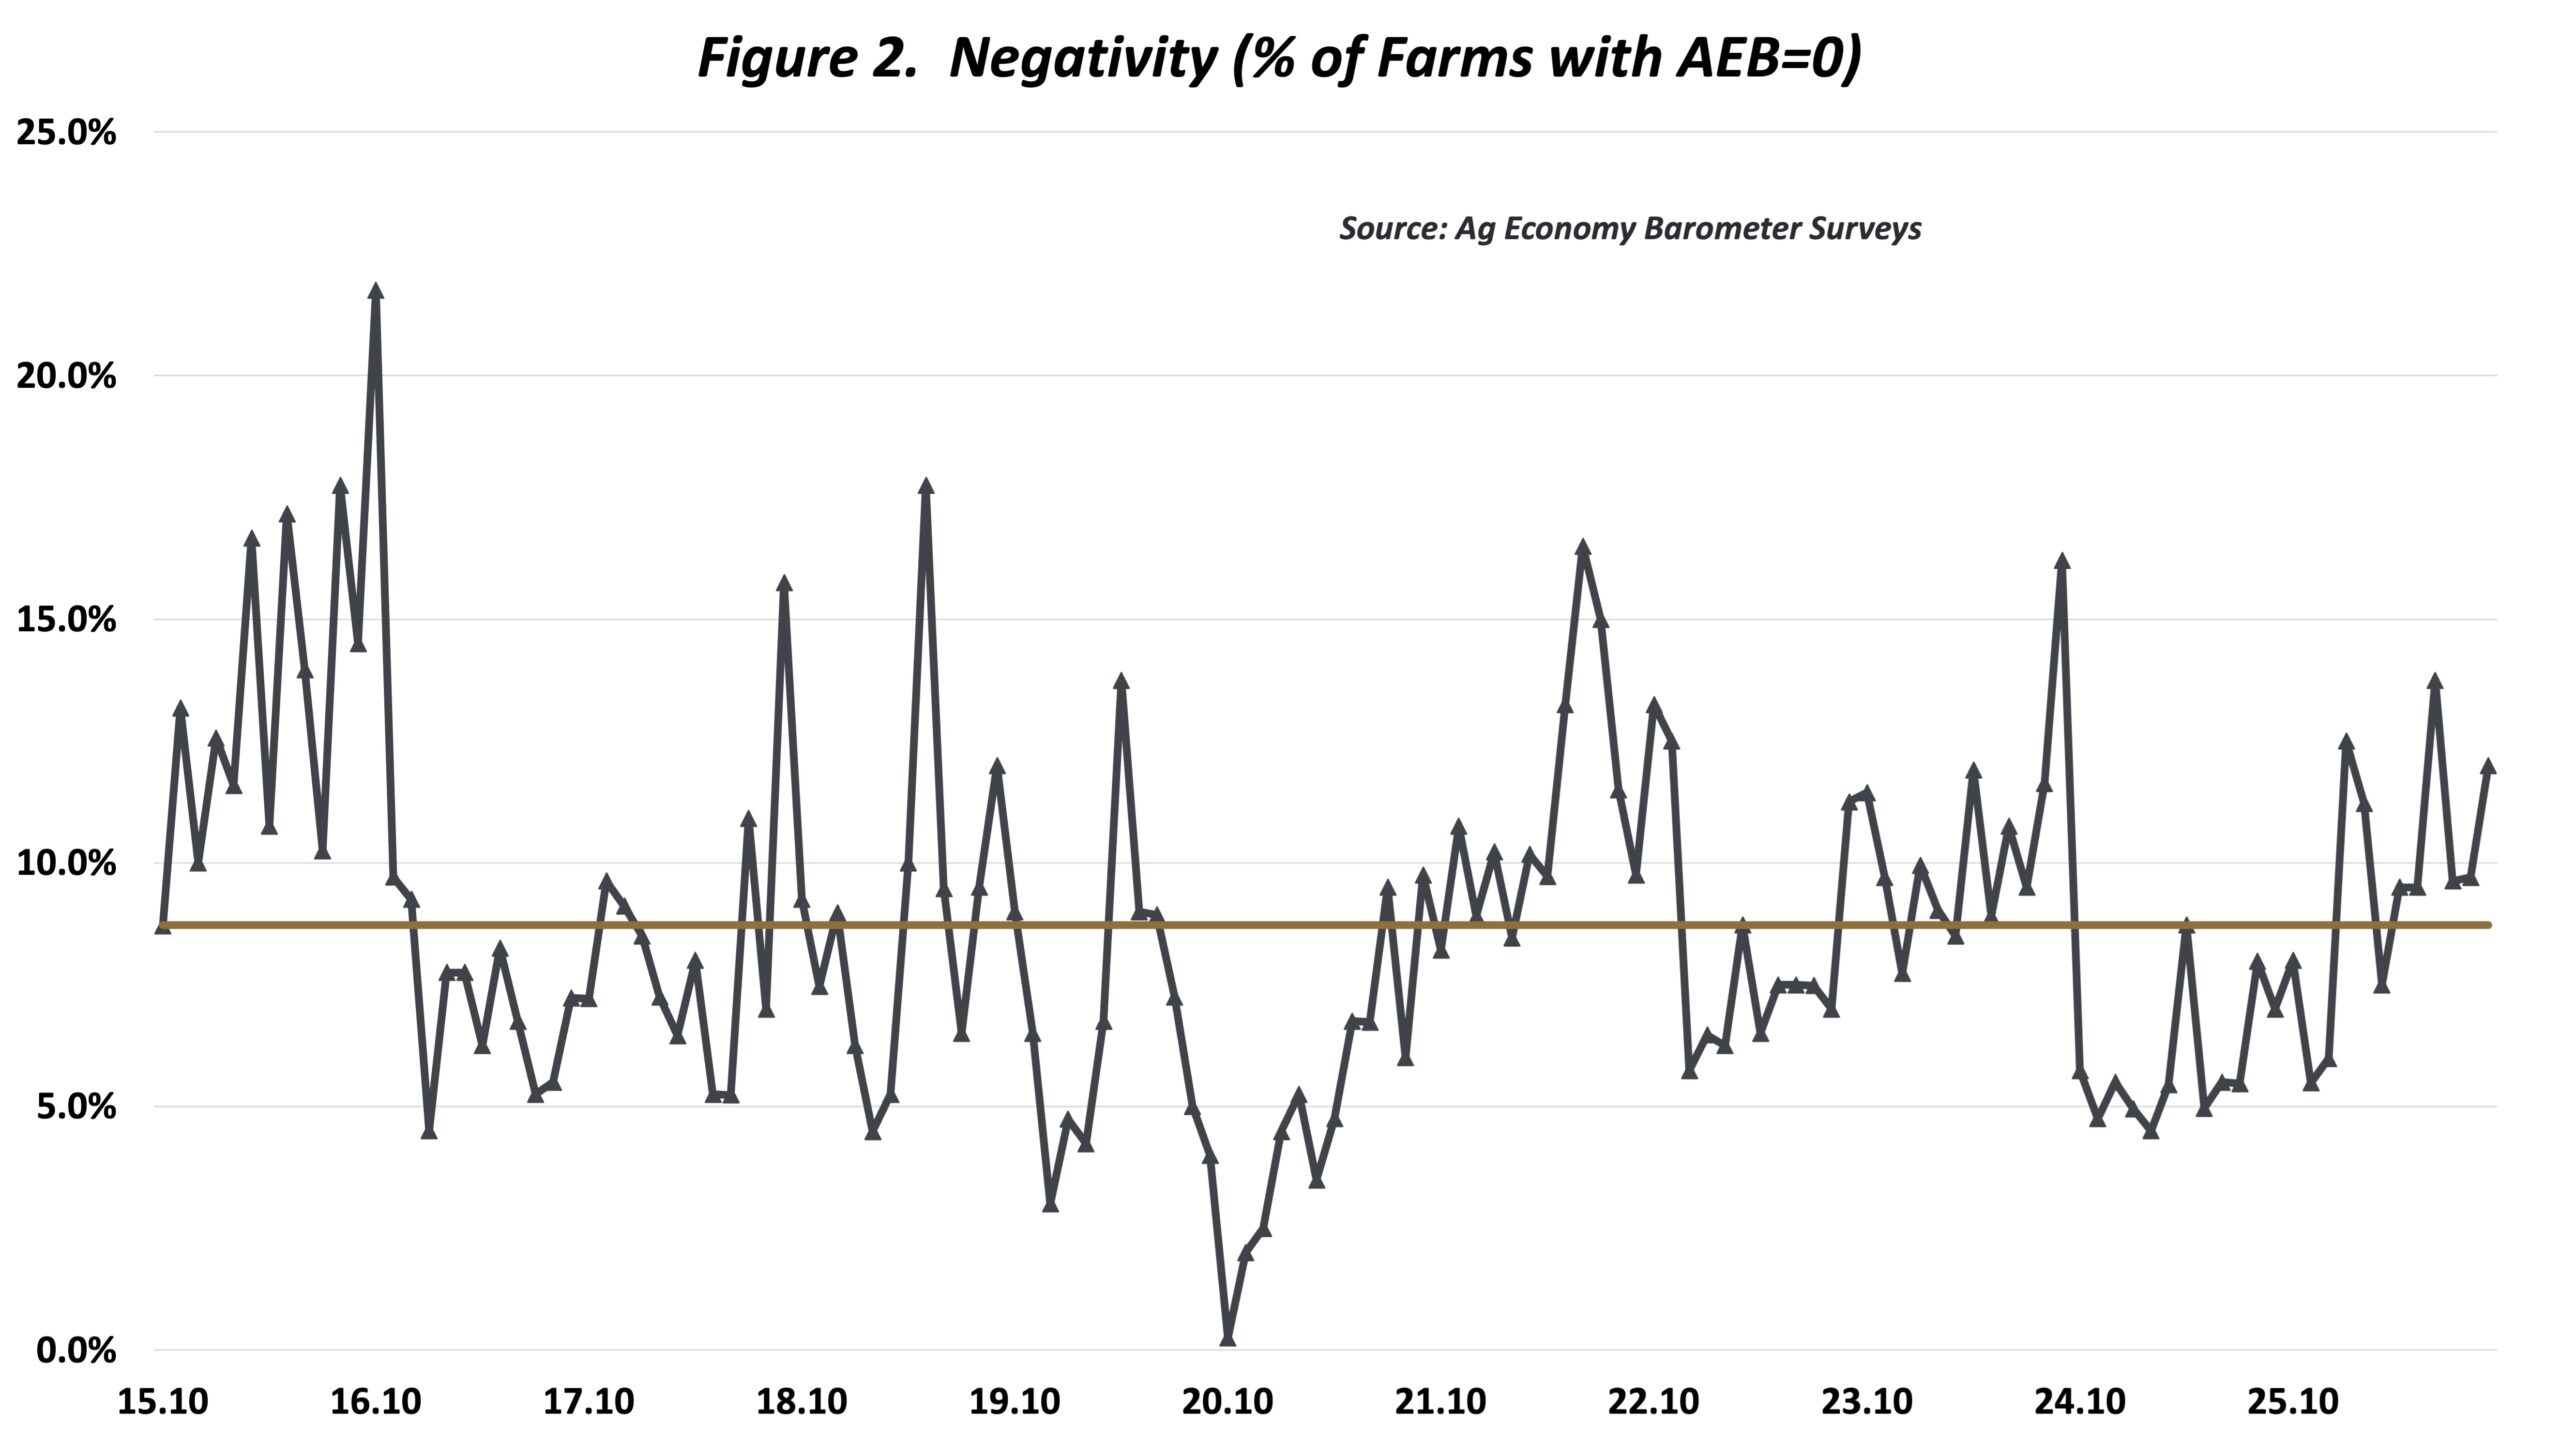
Figure 2. Negativity (% of Farms with AEB=0)
The coefficient of variation (CV), computed by dividing the standard deviation of the AEB monthly index by the average of the monthly AEB index, is the second measure of dispersion computed monthly. The average CV since the inception of the AEB survey is 0.642 or 64.2%. Though not as strongly correlated as negativity, there is also a significant negative correlation between the monthly AEB index and the monthly CV for the index. After being above average in September 2024, the CV was below average from October 2024 through December 2025. Except for August 2026, the CV has been above average since January 2026. The average CV for all respondents in September 2026 was 68.2%.
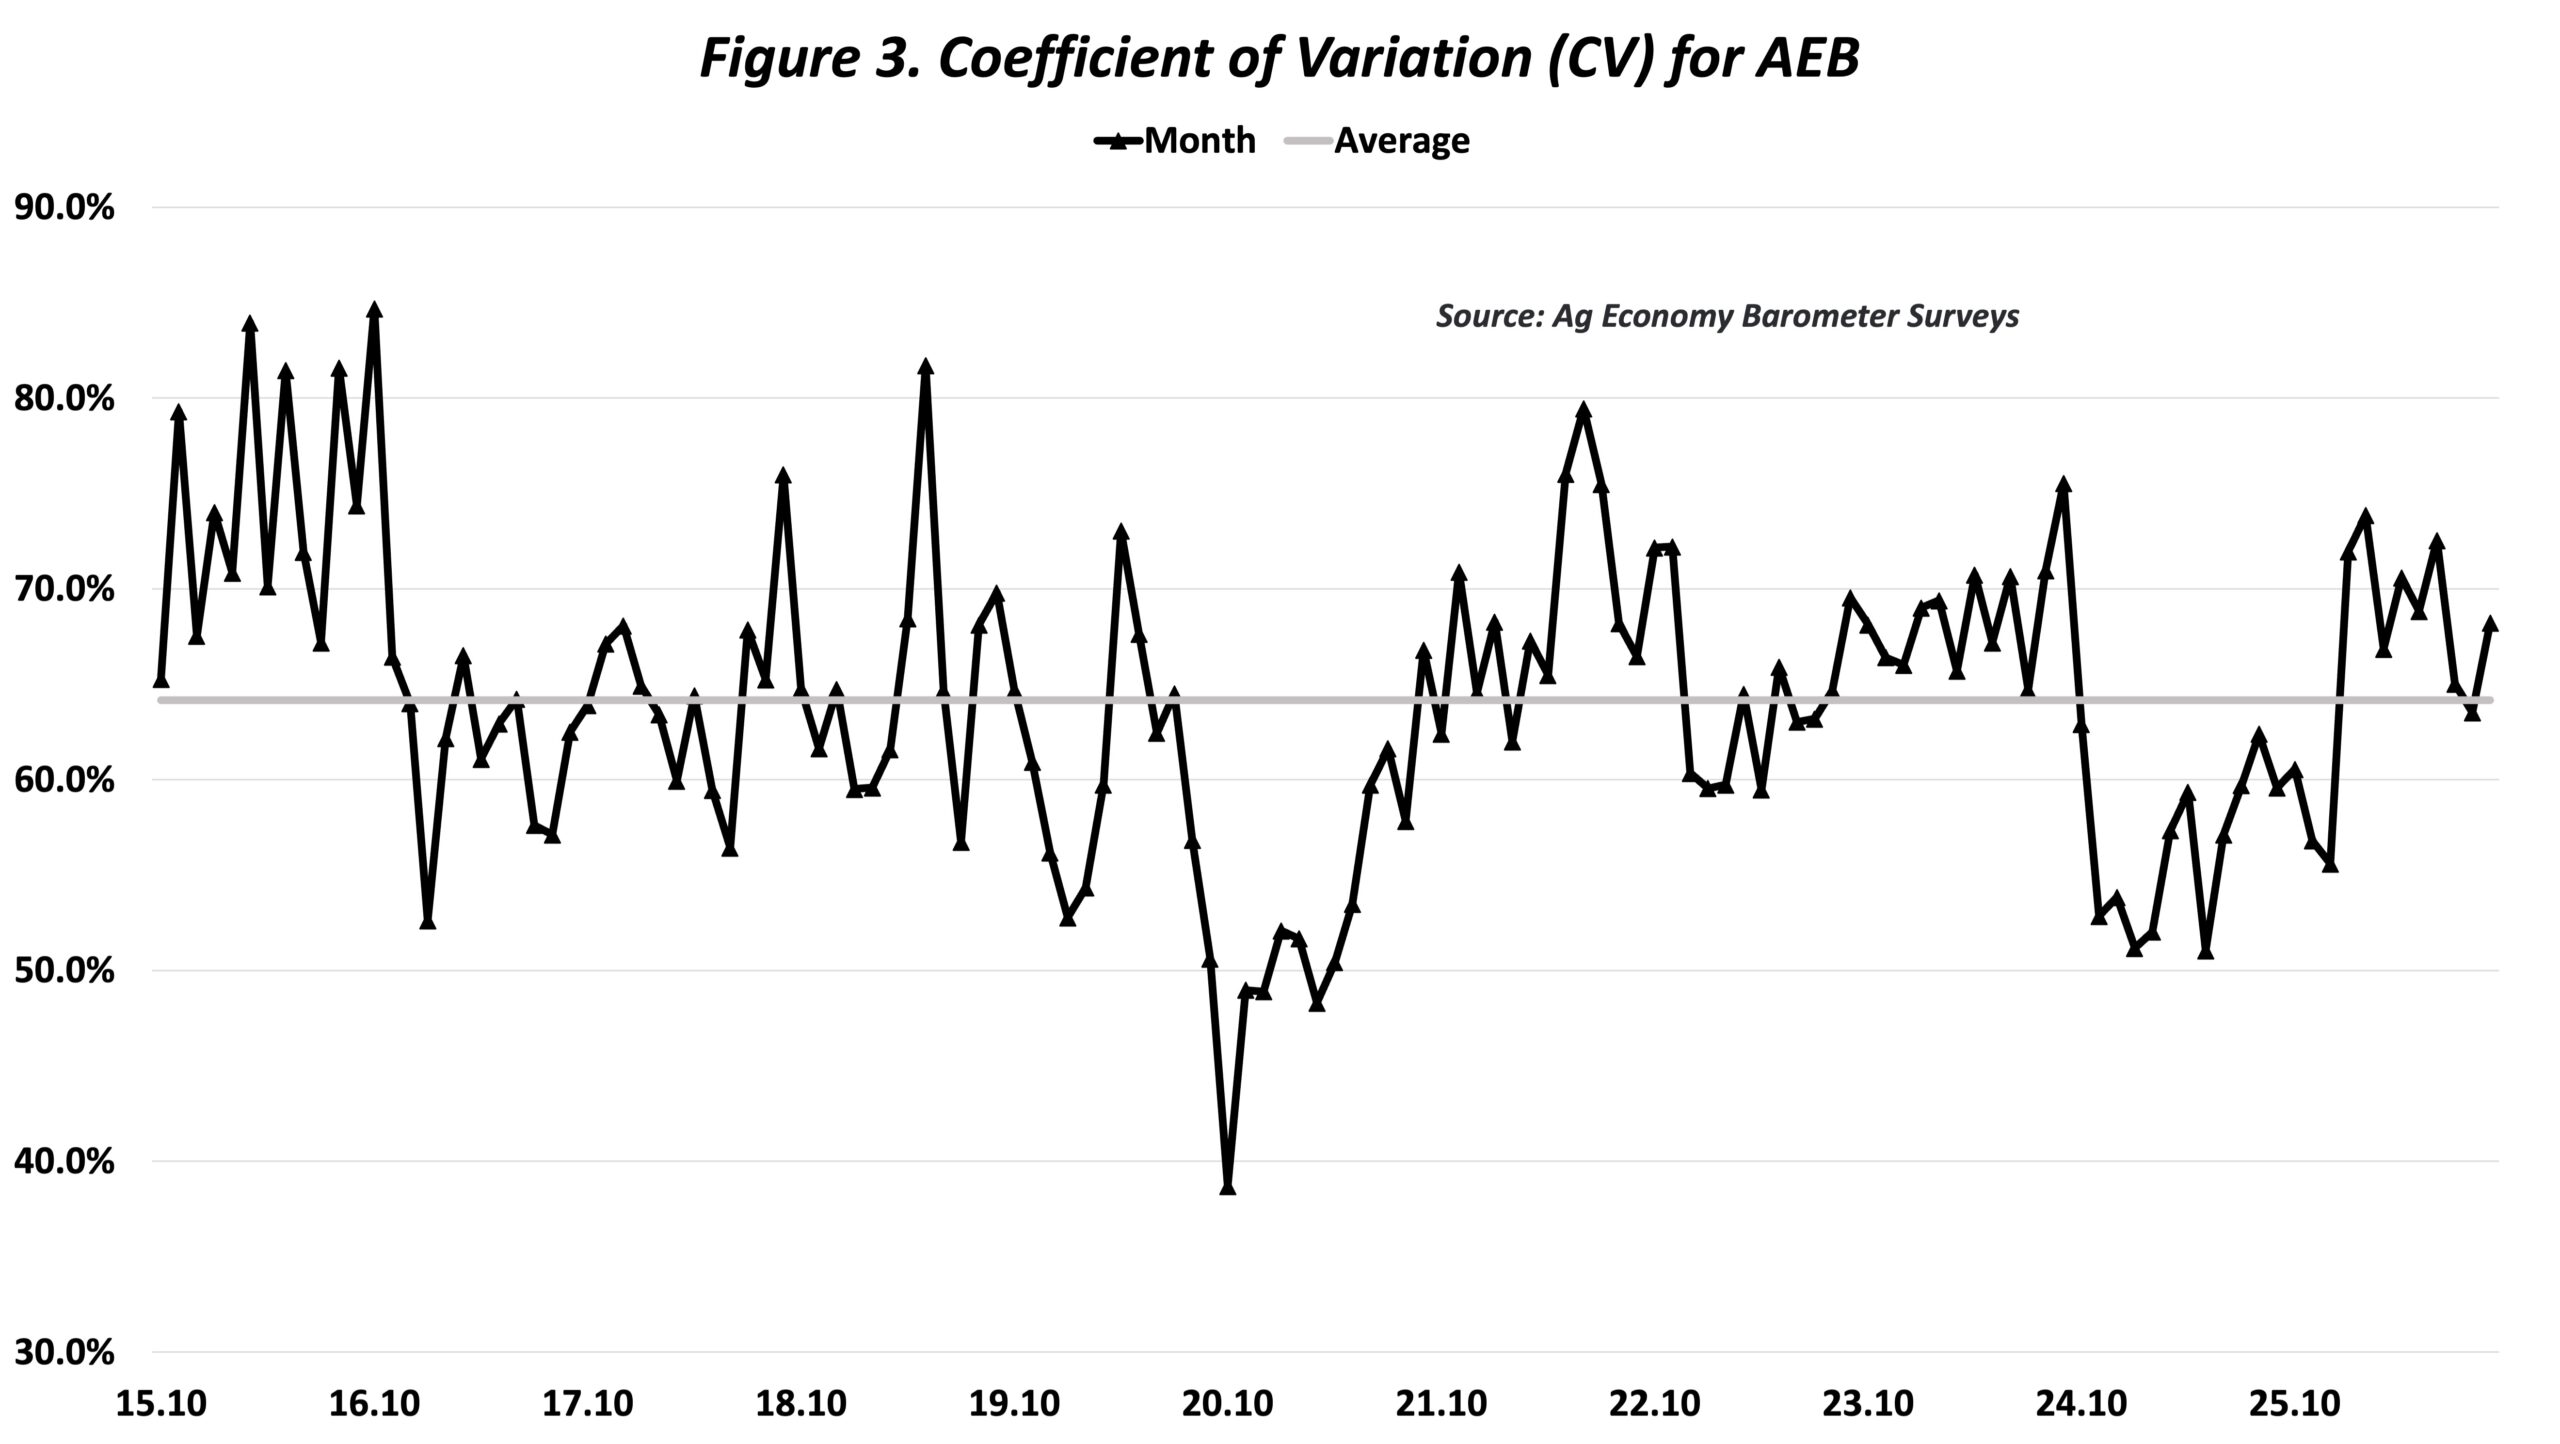
Figure 3. Coefficient of Variation (CV) for AEB
Variation in Producer Sentiment Among Corn and Soybean Producers
September 2026 survey results are used to illustrate dispersion of sentiment among respondents. The September 2026 AEB survey included several questions that were specifically addressed to corn and soybean producers. Approximately 80% of the survey respondents indicated they grew corn and soybeans in 2026. In addition to reporting results for all corn and soybean producers in Table 1, results are also illustrated for two sub-groups; the first group had an AEB index below the average for all corn and soybean producers (i.e., below 124) and the second group had an above average AEB index (i.e., above 124).
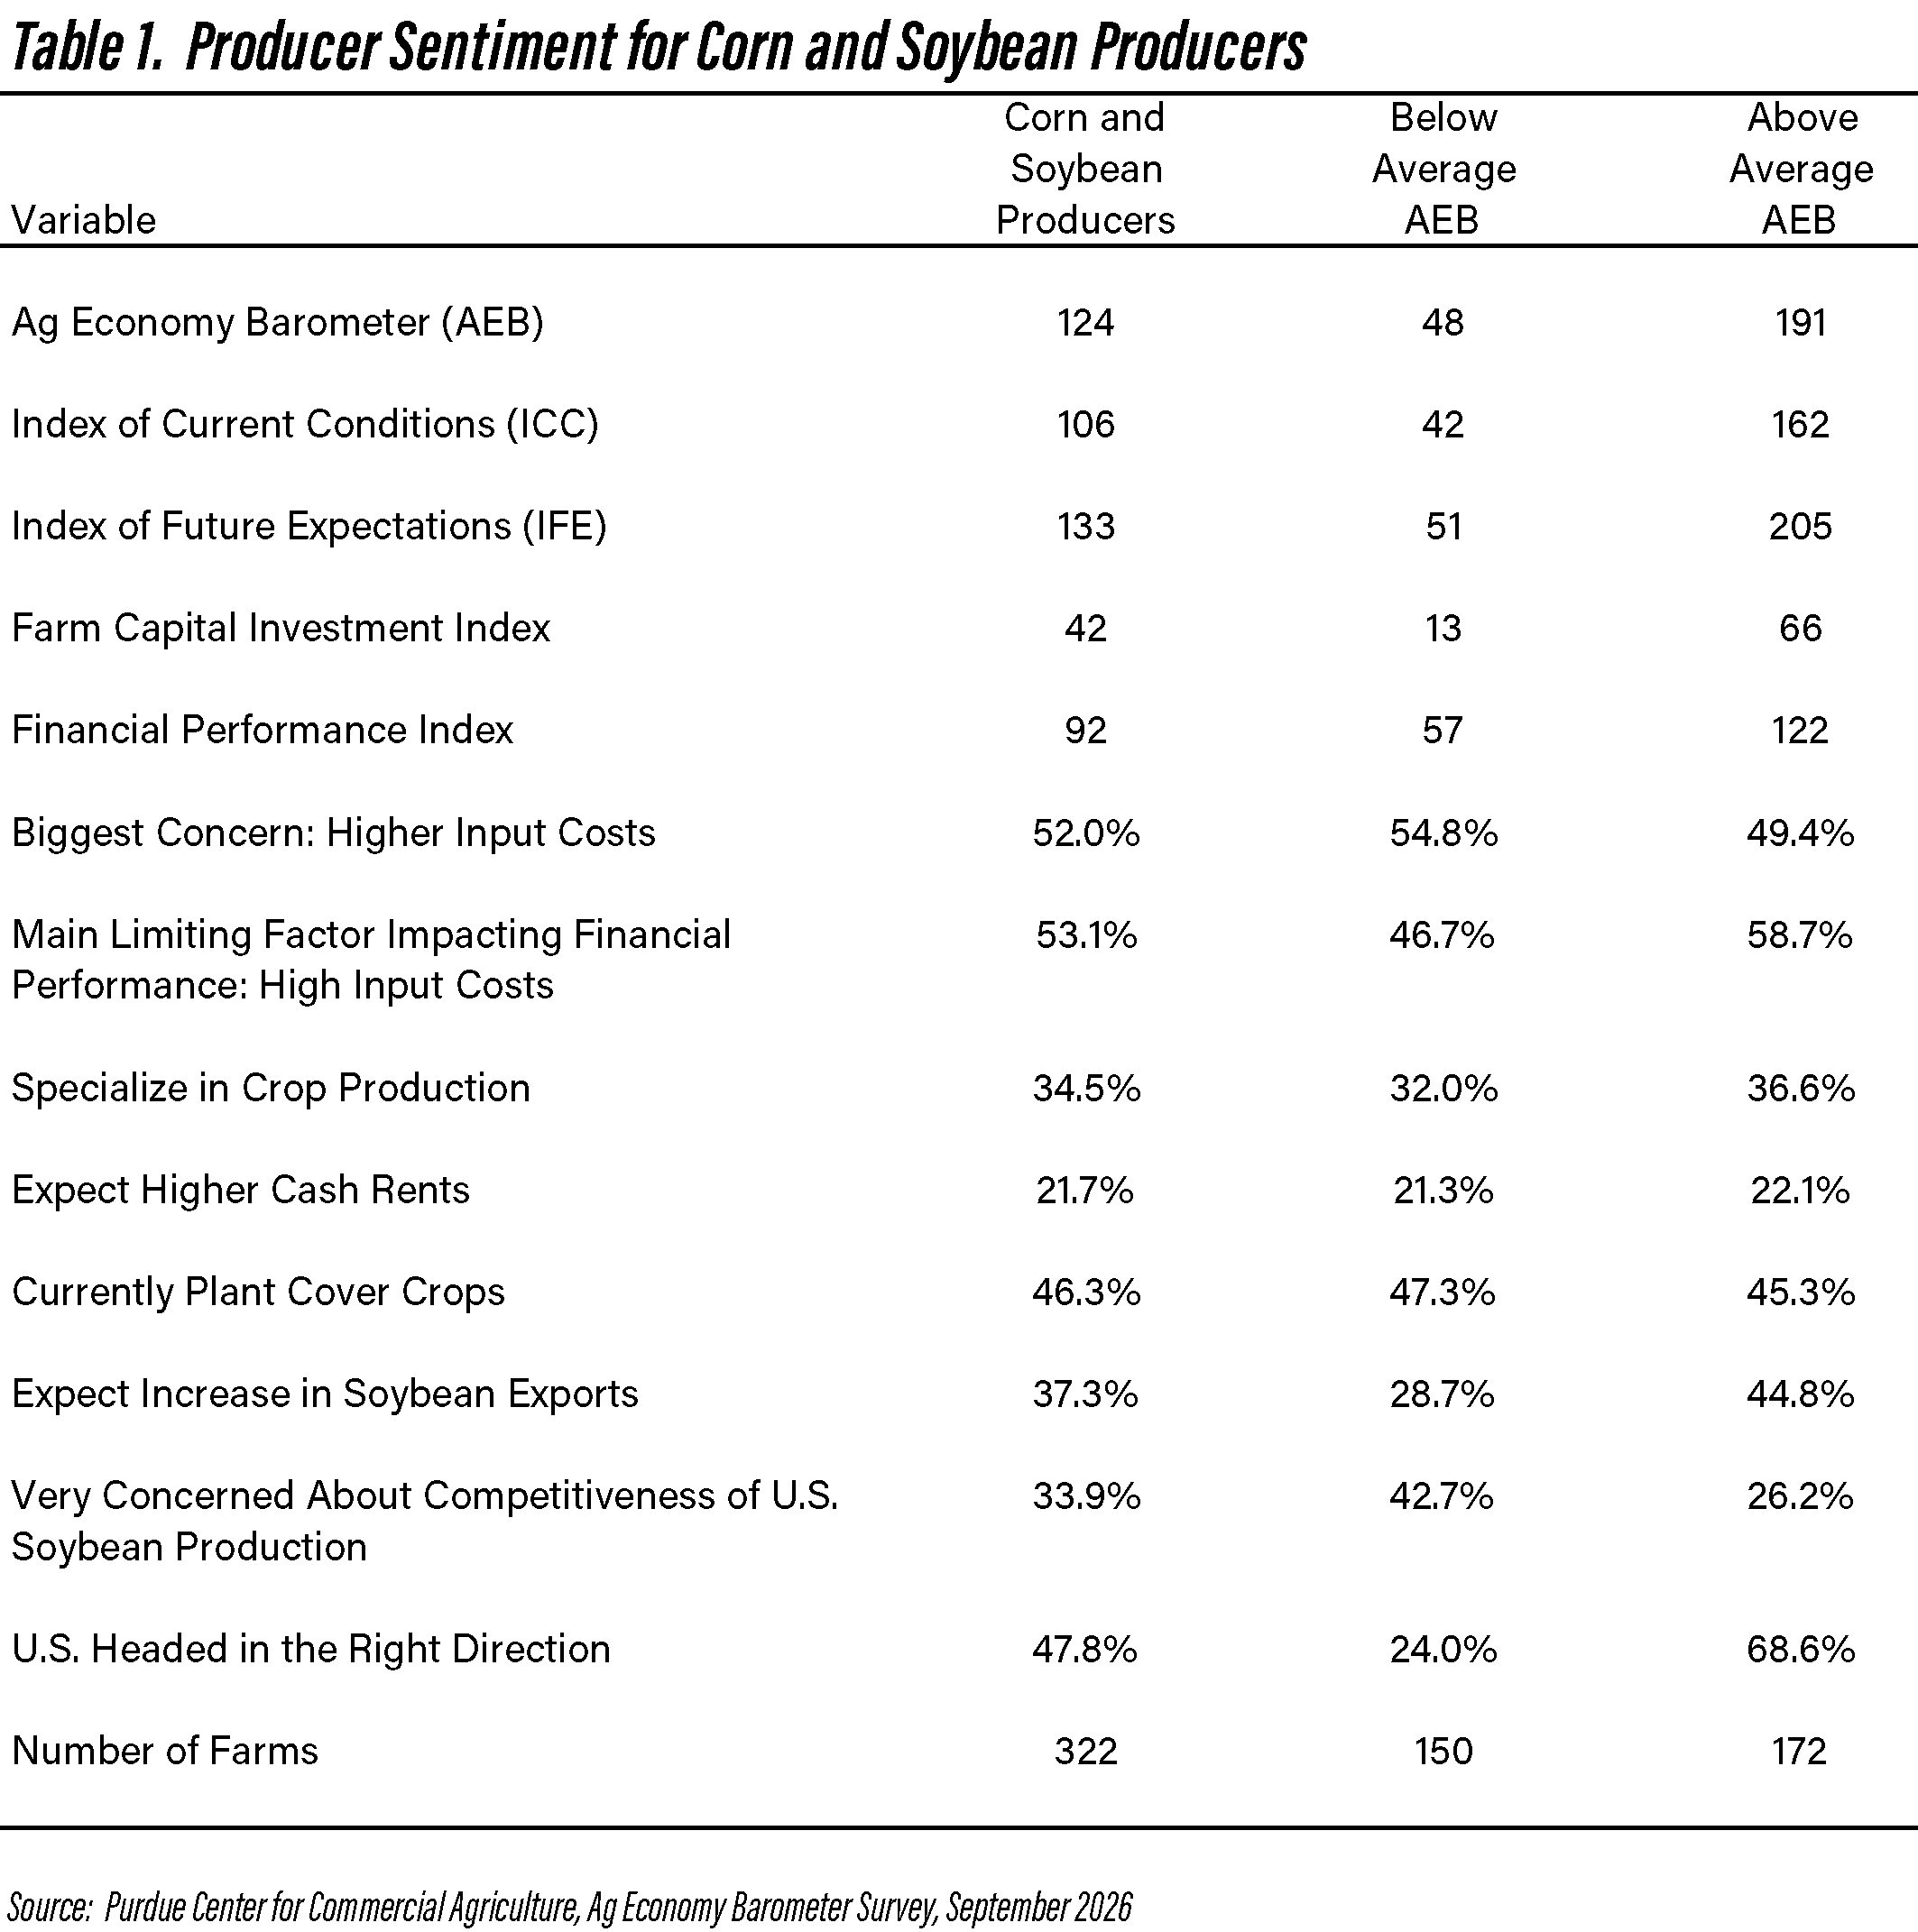
Table 1. Producer Sentiment for Corn and Soybean Producers
There was a substantial difference in the AEB, ICC, and IFE indices between the two sub-groups. The AEB index for the below-average AEB group was only 48 while the AEB index for those with an above-average AEB index was 191. Approximately 12% of all corn and soybean producers had an AEB index of 0. The coefficient of variation (CV) for the AEB index for all corn and soybean producers was 67.4%, which is very similar to the CV for all respondents to the September AEB survey.
The Farm Capital Investment Index measures whether respondents think now is a good time or a bad time to make farm investments, including items such as machinery and buildings. An index below 100 indicates that more respondents think it is a bad time rather than a good time to make such investments. The Farm Capital Investment Index was 13 for the below-average AEB group and 66 for the above-average AEB group.
The Financial Performance Index measures whether a producer expects financial performance to be better than, worse than, or about the same in the next 12 months. An index below 100 indicates that more respondents expect their performance to be worse rather than better in the next 12 months. The average index for all corn and soybean producers was 92. The average index for the respondents with a below-average AEB index was 57 while the group with an above-average AEB index, with a reading of 122, was much more optimistic regarding their financial prospects.
Another monthly AEB question asks respondents to identify their biggest concern for their farm using the following response choices: lower crop and/or livestock prices, high input costs, environmental policy, farm policy, interest rates, and availability of inputs. High input costs were the biggest concern for both groups of corn and soybean producers. However, when asked about the main limiting factor impacting financial performance, a larger proportion of the above-average AEB index group listed high input costs. Figure 4 illustrates how the two groups answered the limiting factor question. A higher proportion of the above-average AEB index group listed low output prices and high input costs as the main limiting factor. In contrast, a lower proportion of this group listed labor and equipment constraints, weather risk, debt or financial pressures, and policy uncertainty as limiting factors.
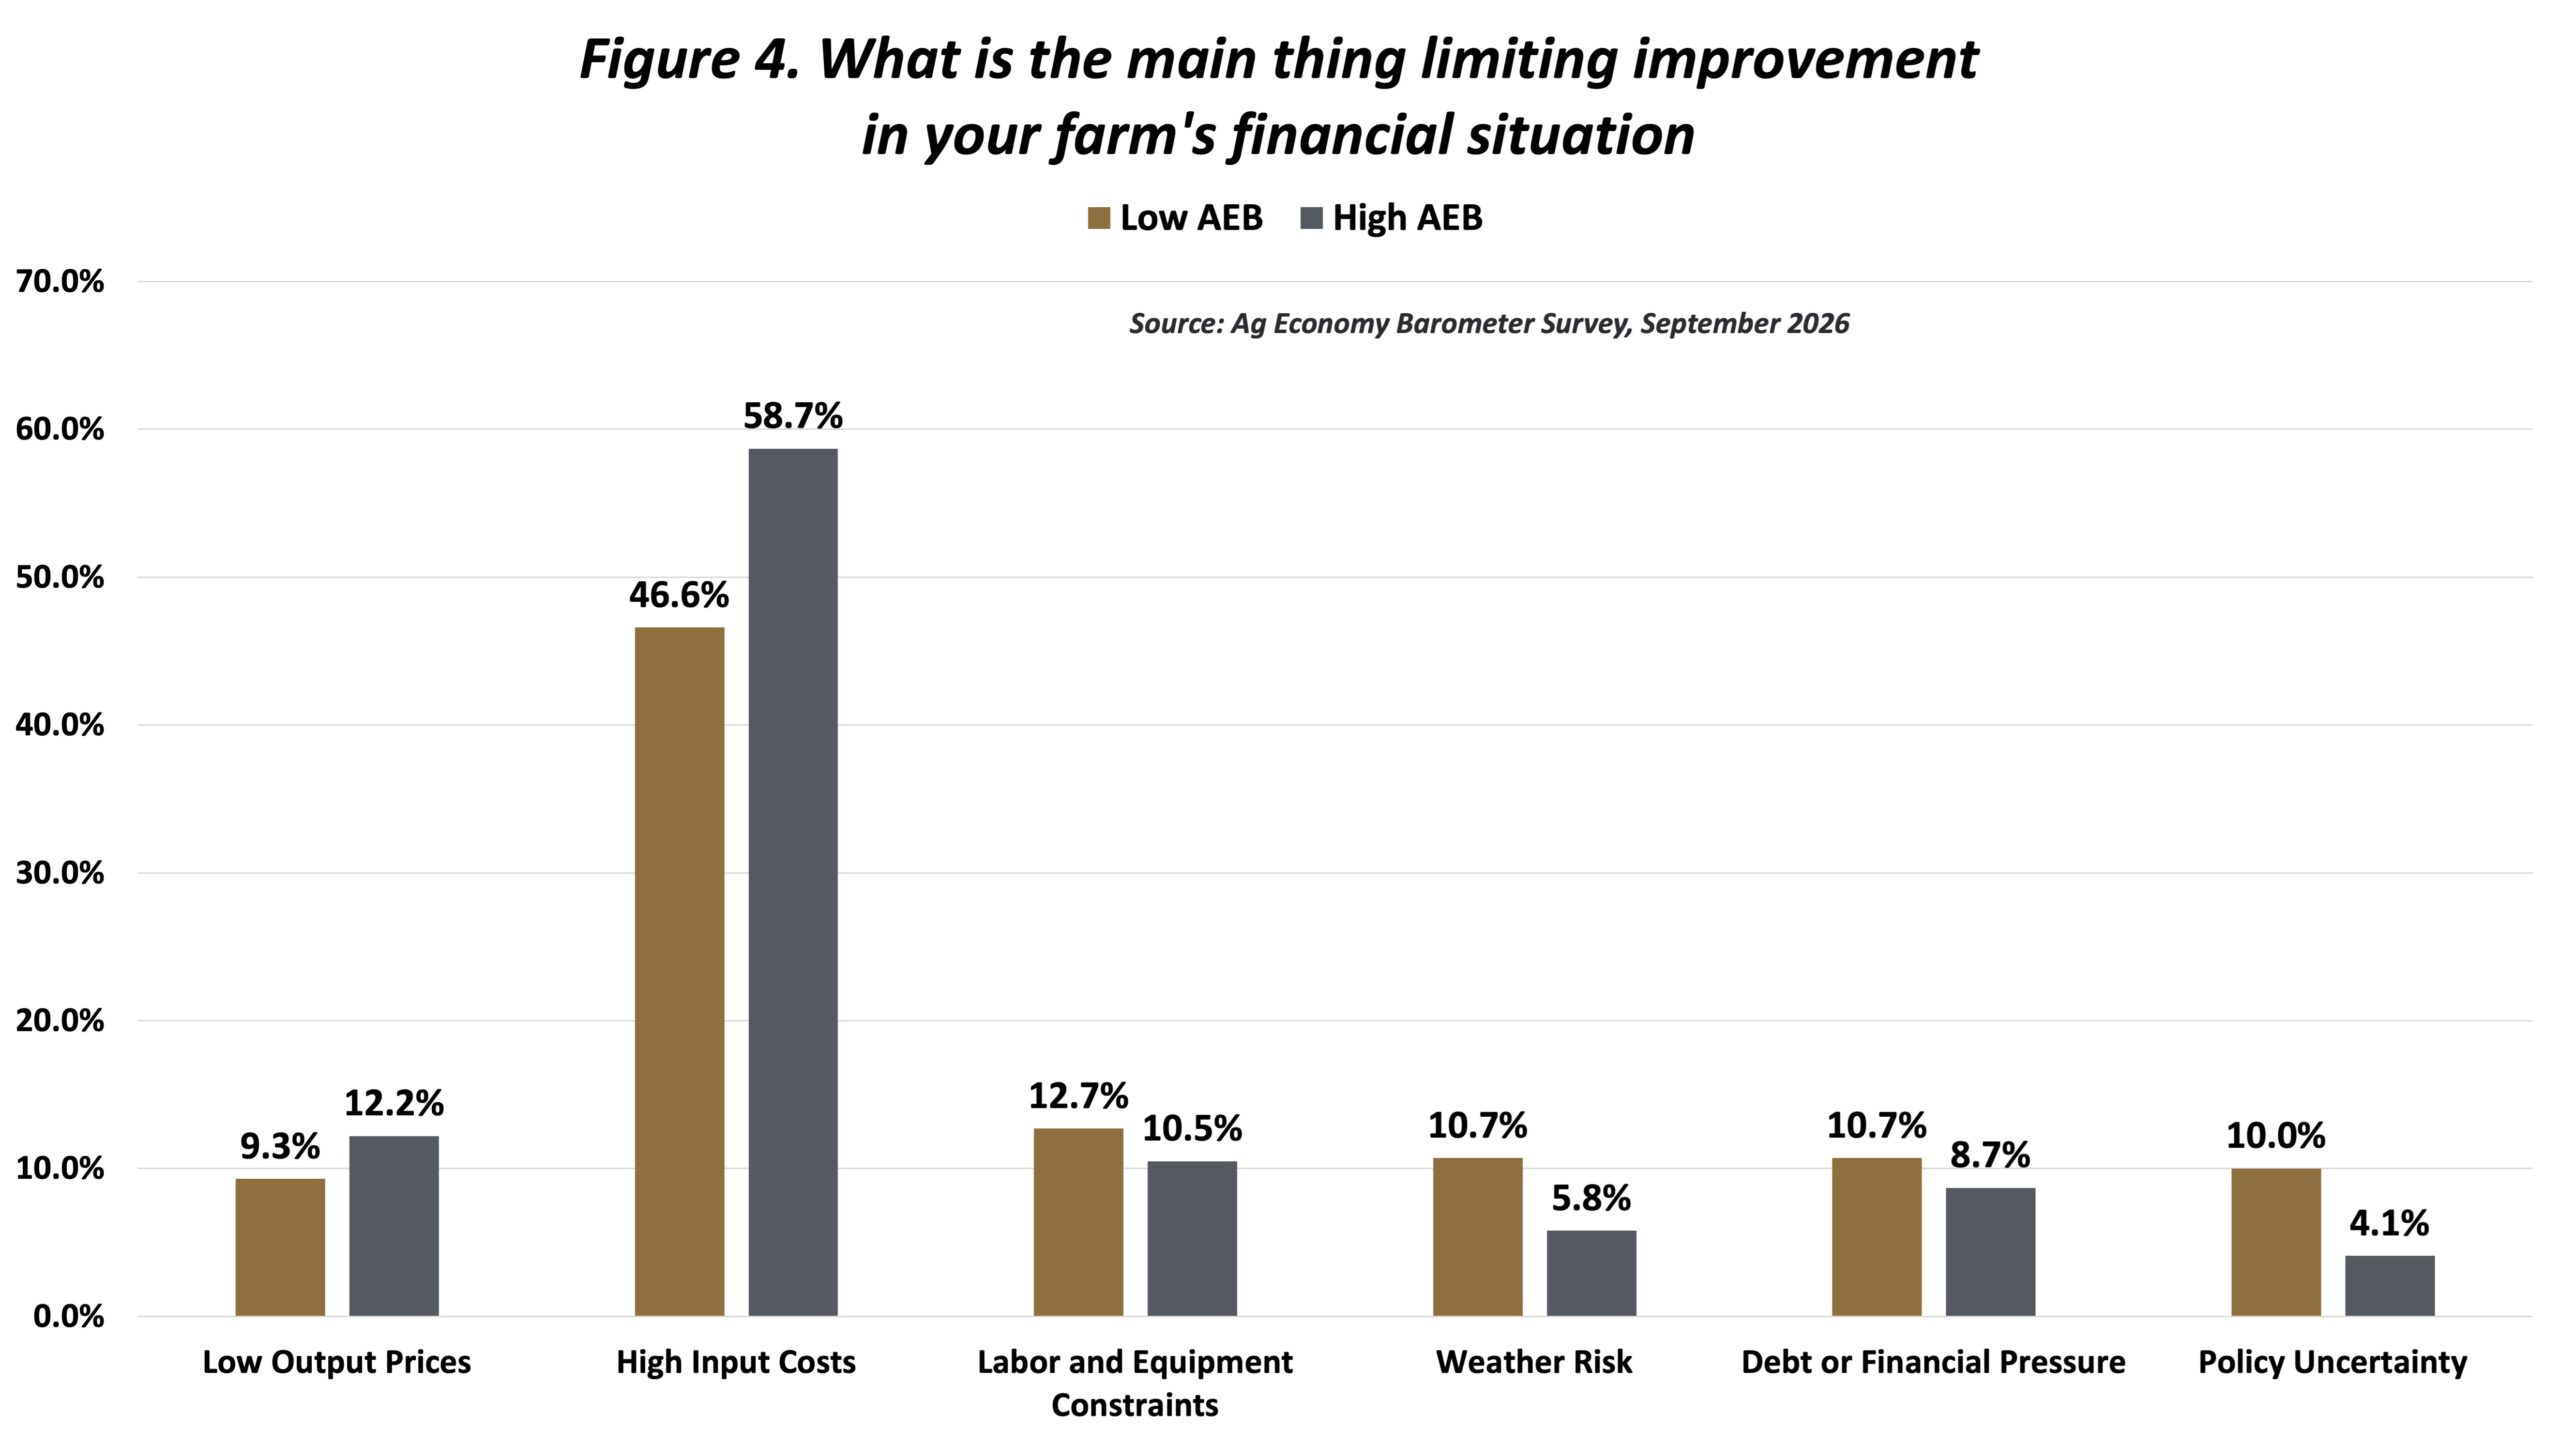
Figure 4. What is the main thing limiting improvement in your farm’s financial situation
Differences in the proportion of respondents were small when examining whether farms specialized in crop production, whether they expected higher cash rents, or whether they currently plant cover crops. For both groups, most respondents indicated that they expect cash rent to be about the same in 2027 as it was in 2026. We did not ask specifically about sentiment regarding which individual input costs were of concern. However, an examination of the open-ended comments leads us to believe that producers were particularly concerned about fuel and fertilizer costs. These results are consistent with the cash rent expectations.
The group with an above-average AEB index was more optimistic regarding soybean exports and less concerned about the relative competitiveness of U.S. soybean production. However, it is important to note that 26% of the above average AEB index group were very concerned about U.S. competitiveness, which is not a trivial number.
Finally, producers were asked whether the U.S. is generally headed in the right direction or is on the wrong track. The difference between the two groups of corn and soybeans producers was striking. Only 24% of the below-average AEB index group thought the U.S. was headed in the right direction. This figure increased to 69% for the above-average AEB index group. As illustrated in Figure 4, 10% of the below-average AEB index group indicated that policy uncertainty was the main thing limiting their financial performance. Only 4% of the above-average AEB index group listed this item as the main limiting factor.
Conclusions
This article examined dispersion in producer sentiment, as measured by the AEB index, among survey respondents over time, and illustrated differences in sentiment and survey answers among corn and soybean producers using results from the September 2026 AEB survey. Dispersion of survey responses varies substantially over time but is in general negatively correlated with the AEB index. In months when the AEB index is high, dispersion is low and vice versa. Dispersion of survey responses has been above average since January 2026. In September 2026, survey respondents with a below-average AEB index had an average AEB index of only 48. In contrast, those with an above-average AEB index had an average AEB index of 191.
These results have important implications for interpreting monthly AEB survey findings. Along with changes in the headline index, examining the distribution of individual responses proves a more complete picture of farmer sentiment and the differences in producers’ concerns and expectations.
References
Langemeier, M. and J. Colussi. “Farmer Sentiment Drops as Concerns About Input Costs Increase.” Ag Economy Barometer, October 6, 2026. (https://ag.purdue.edu/commercialag/ageconomybarometer/).
TAGS:
TEAM LINKS:


RELATED RESOURCES
UPCOMING EVENTS
Join educators from across the Midwest to build skills for communicating soil health concepts on Nov. 4-5, 2026. In the field, we’ll evaluate the relationship between soil health and water management focusing on irrigation and edge of field practices. The in-service will have both classroom and on farm demonstrations.
The Land of Opportunity: A Conference for Farmland Owners will be held at two locations on October 5 and October 6, providing farmland owners with valuable information and resources to help them make informed decisions about their land. The conference will feature keynote presentations, educational breakout sessions, and networking opportunities designed specifically for those who own, manage, or have an interest in farmland.