November 9, 2026
Farm Absorption Capacity and Producer Sentiment
by Michael Langemeier and Joana Colussi


Agility and absorption capacity represent two distinct strategies through which a farm builds resilience (Lippsmeyer and Langemeier, 2023). Agility is a farm’s ability to spot and exploit market changes in a timely manner. Farms that have established goals and objectives, look for new enterprise opportunities, and regularly assess their competitive position are typically more agile. Absorption capacity (which is closely related to one of the core pillars of farm resilience, economic flexibility) is the ability to withstand market shocks. In production agriculture, absorption capacity is sustained by keeping excess cash reserves, storing crops to market when extra cash is needed, diversifying cash flows, decreasing fixed costs per unit of production, and other strategies that provide a buffer in times of uncertainty. Absorption capacity is often related to the strength of a farm’s balance sheet.
This article examines what the October 2026 Purdue University-CME Group Ag Economy Barometer (AEB) survey shows about producers’ absorption capacity (Langemeier and Colussi, 2026). The analysis focuses on three questions: whether producers report low fixed costs per unit relative to competitors, whether their farm’s enterprise mix is more diversified than it was five years ago, and whether they consider their farm’s balance sheet strong. Together, these responses indicate where producers report having financial buffers and where they may have less room to absorb a shock.
Assessing a Farm’s Absorption Capacity
Table 1 provides a tool for assessing a farm’s absorption capacity. The questions are designed so that higher scores are preferable. The three questions focus on fixed costs per unit, diversification of the farm’s enterprise mix, and the strength of the farm’s balance sheet. To obtain a score for absorption capacity, add up your scores for the three individual questions. The average scores are discussed below.
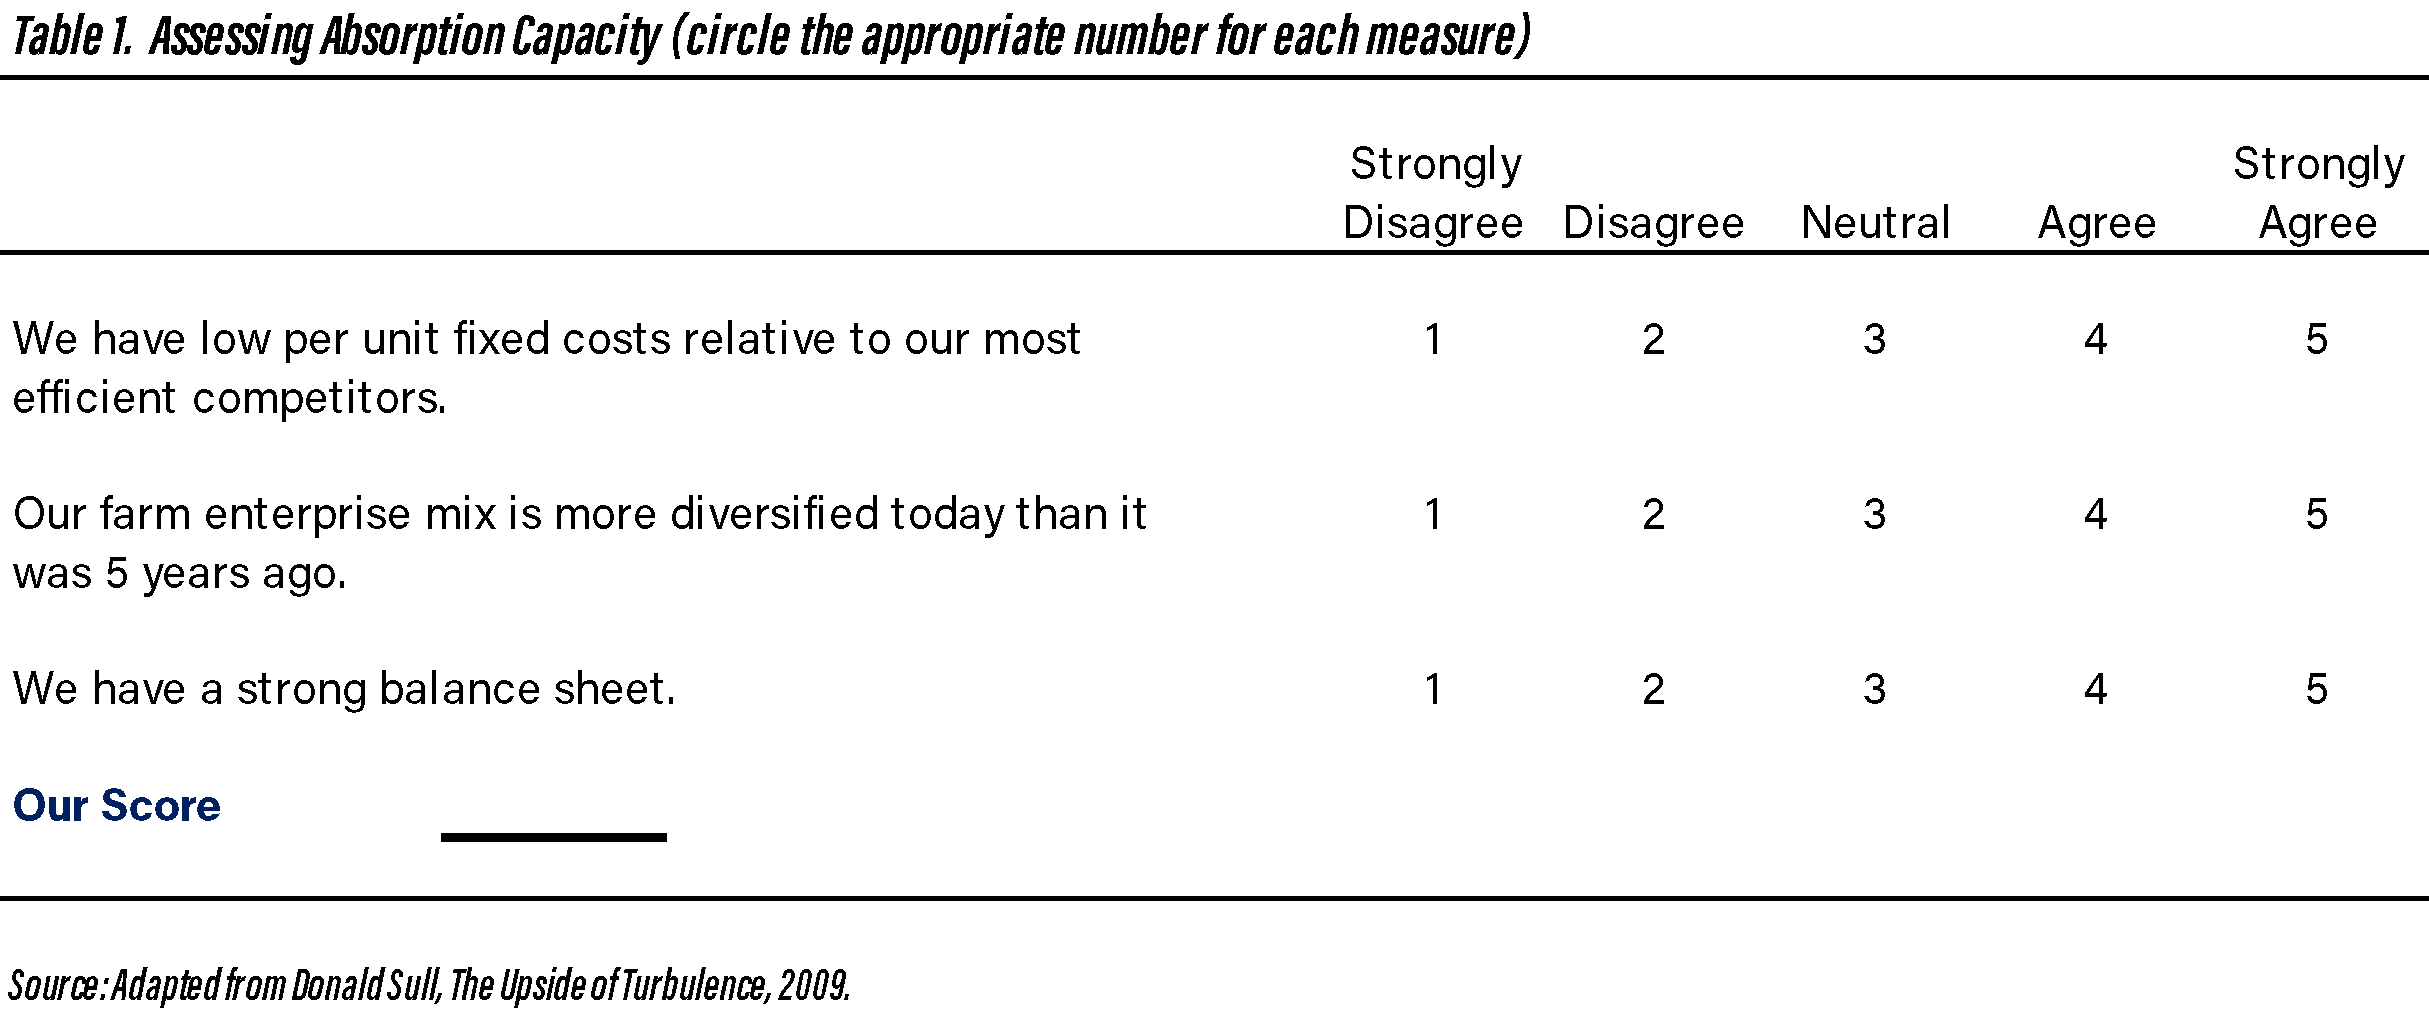
Table 1. Assessing Absorption Capacity (circle the appropriate number for each measure)
Variation in Absorption Capacity Among Producers
The Purdue University-CME Group Ag Economy Barometer (AEB) Index for October 2026 was 126, indicating that average sentiment was more positive than during the index’s base period (i.e., the fourth quarter of 2015 and the first quarter of 2016). The AEB index has two sub-indices: the Index of Current Conditions (ICC) and the Index of Future Expectations (IFE). In October 2026, the ICC was 121 and the IFE was 129.
Table 2 presents producer sentiment and absorption capacity for all AEB survey respondents and separately for two groups based on their absorption capacity scores. The low absorption capacity group includes respondents with scores of 9 or below, and the high absorption capacity group includes those with scores of 10 or above.
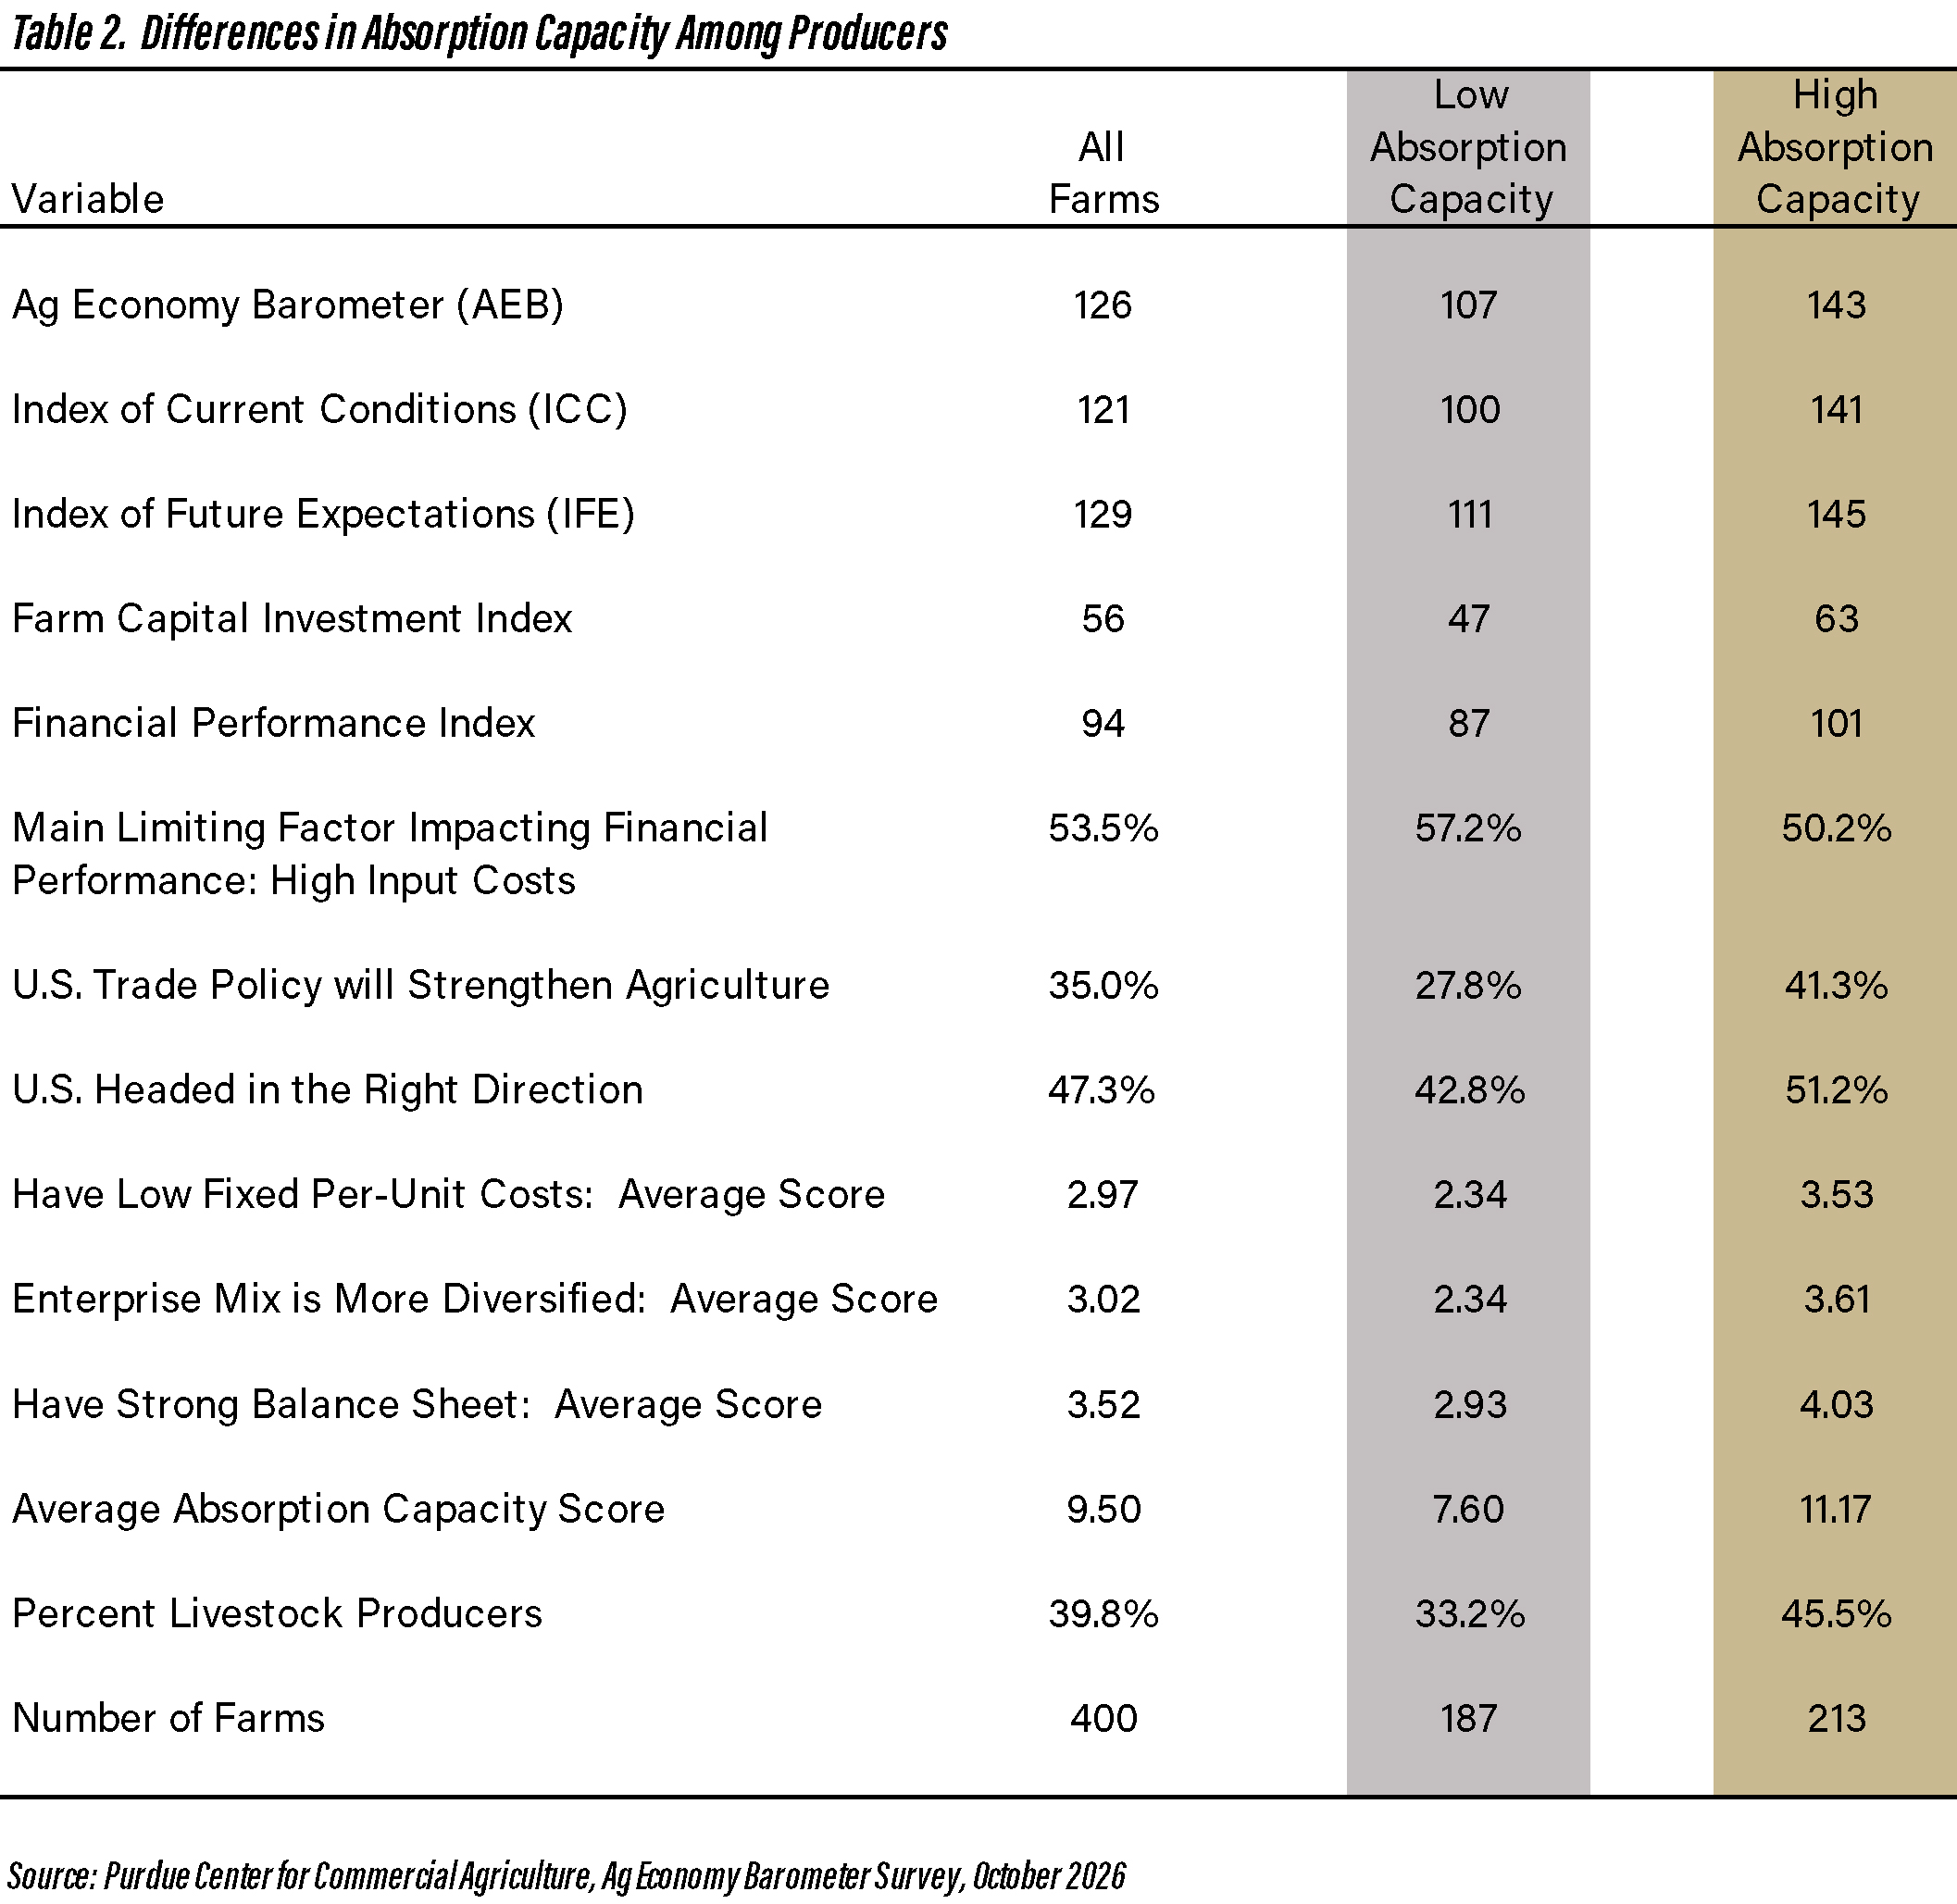
Table 2. Differences in Absorption Capacity Among Producers
The absorption capacity scores for individual farms ranged from 3 (strongly disagreed with all three statements) to 15 (strongly agreed with all three statements). The distribution of absorption capacity scores for the 400 AEB survey respondents is illustrated in Figure 1. The three most common scores were in the middle of the range (i.e., 9, 10, or 11). Only three farms had a score of 3 and only five farms had a score of 15.
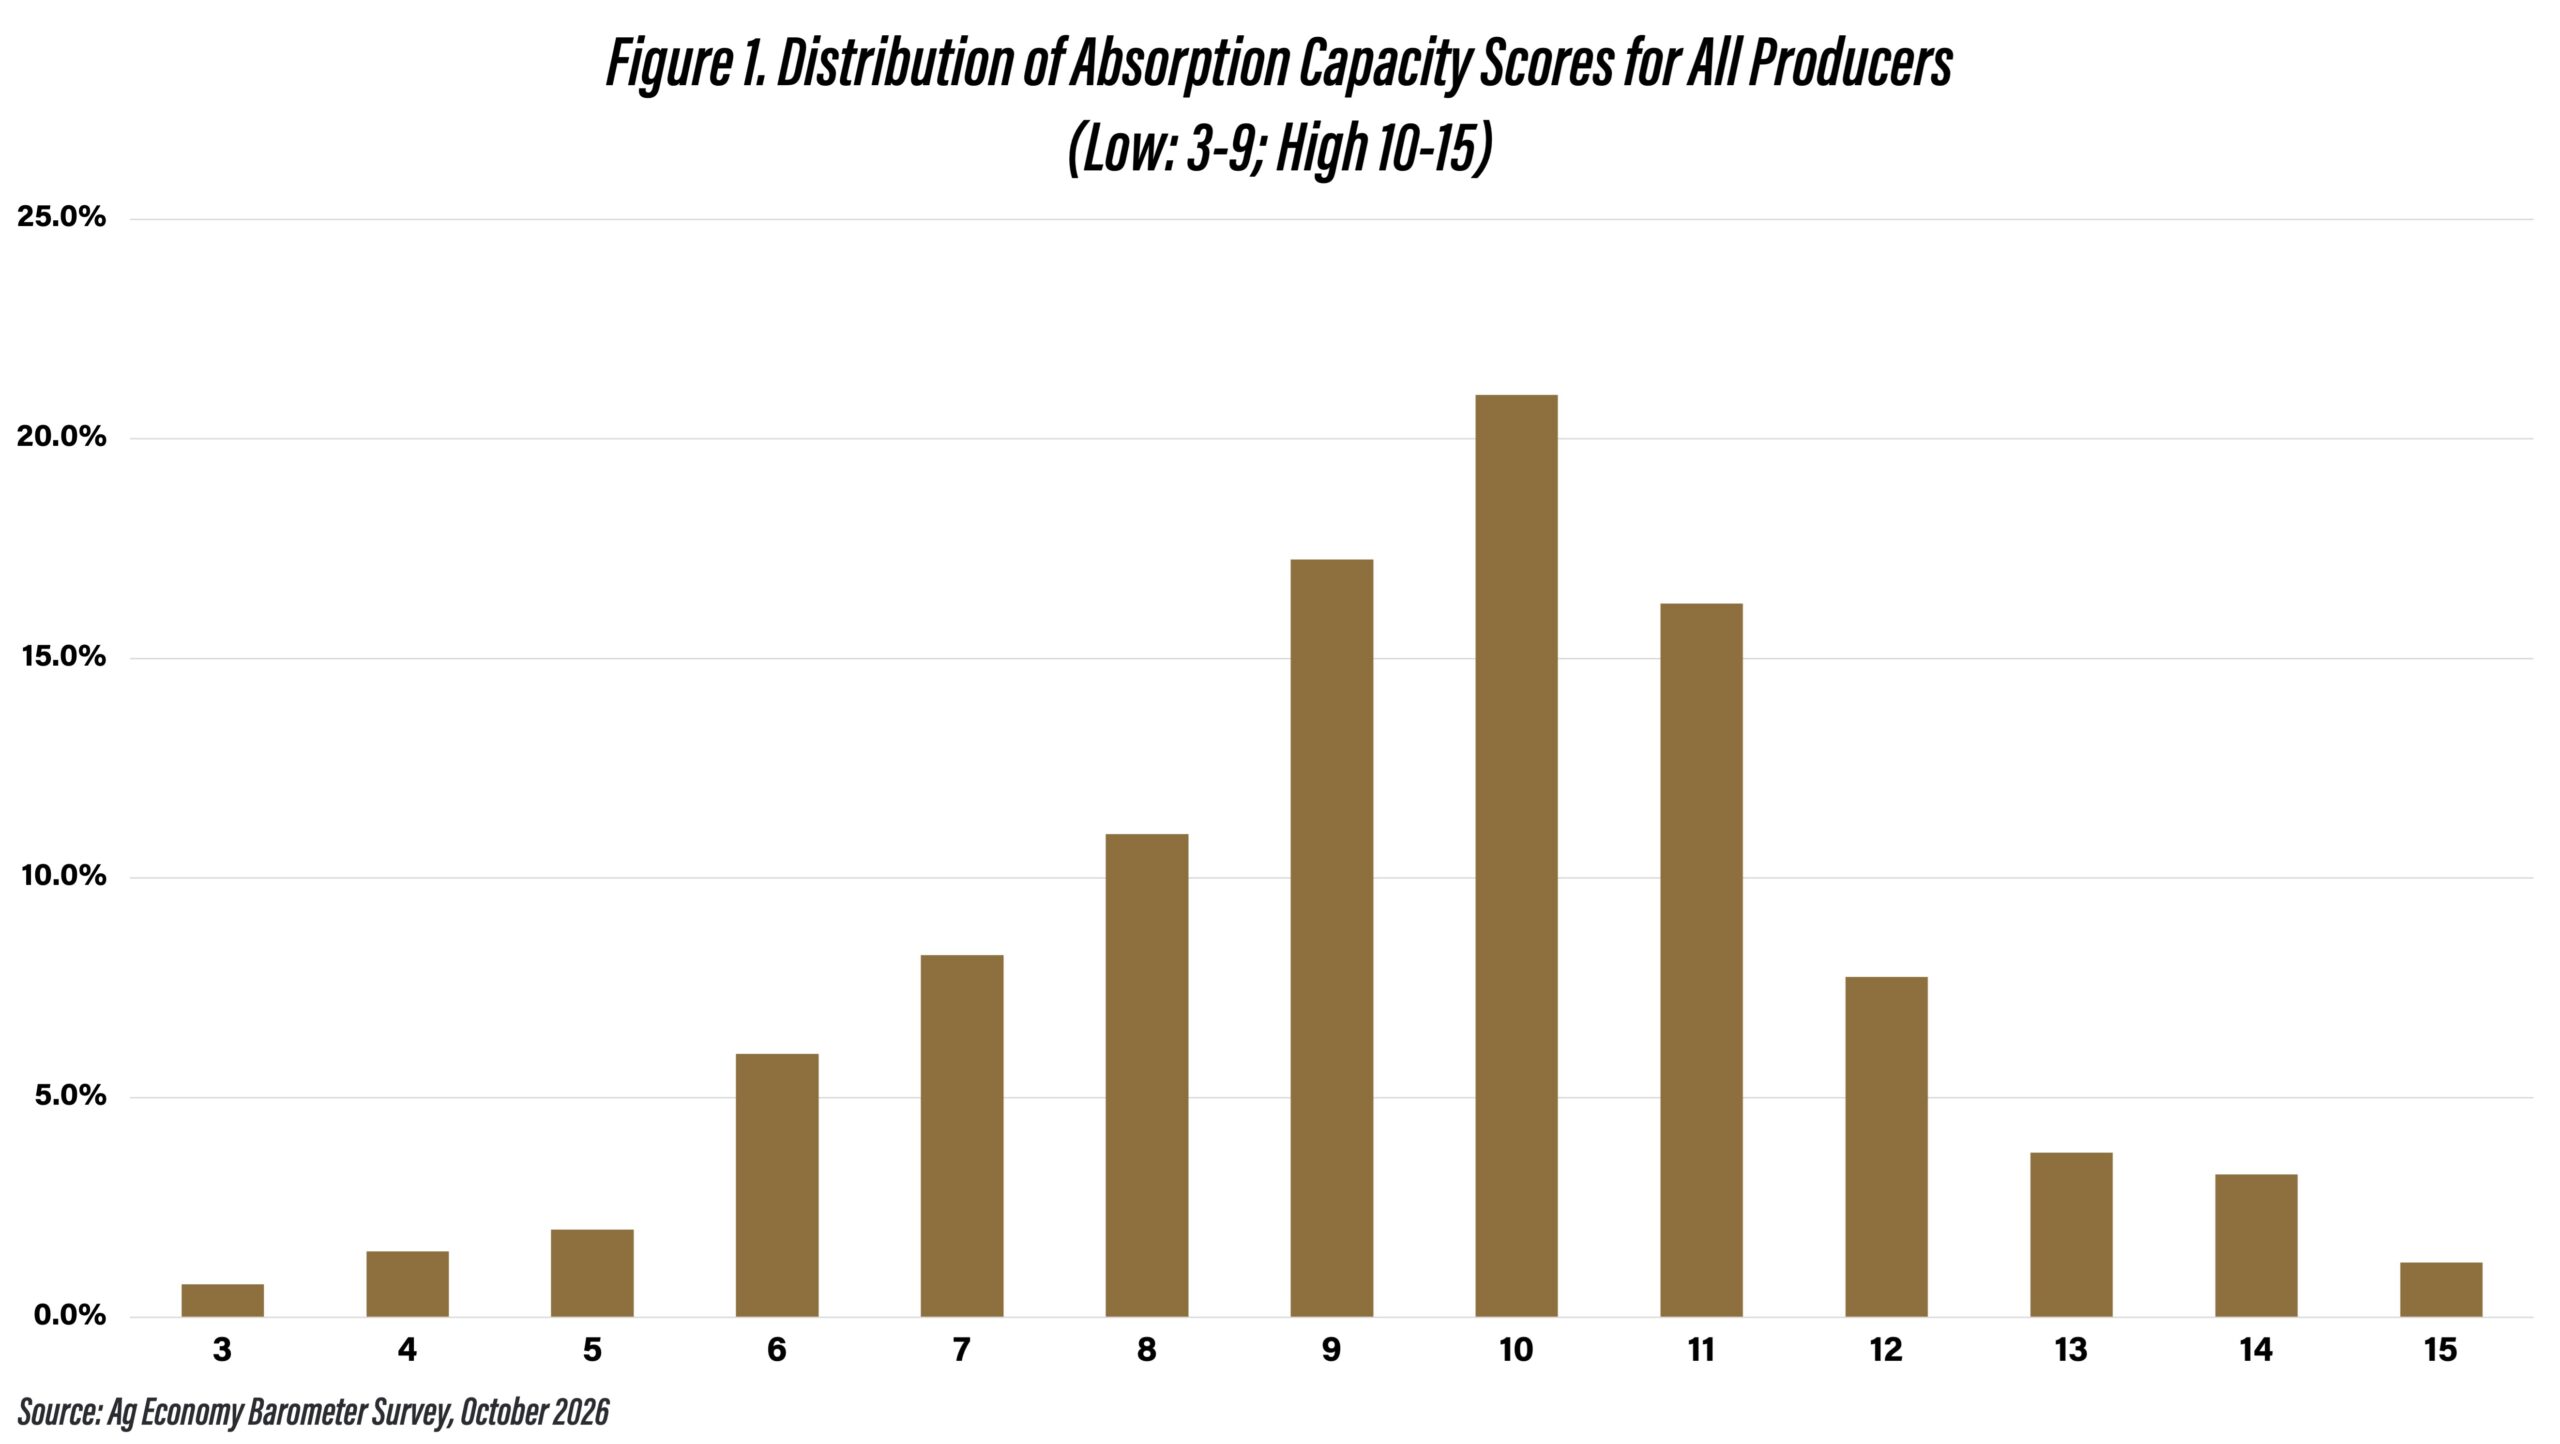
Figure 1. Distribution of Absorption Capacity Scores for All Producers (Low: 3-9; High 10-15)
There was a substantial difference in the AEB, ICC, and IFE indices between the two sub-groups (see Table 2). The AEB index for the low absorption capacity group was 107 while the AEB index for those in the high absorption capacity group was 143. Similarly, the average ICC and IFE indices were substantially lower for the low absorption capacity group.
The Farm Capital Investment Index measures whether respondents think now is a good time or a bad time to make farm investments, including items such as machinery and buildings. An index below 100 indicates that more respondents think it is a bad time rather than a good time to make such investments. The Farm Capital Investment Index was 47 for the low absorption capacity group and 63 for the high absorption capacity group.
The Financial Performance Index measures whether producers expect their farms’ financial performance to be better, worse, or about the same over the next 12 months. An index below 100 indicates that more respondents expect their performance to be worse instead of better in the next 12 months. The average index for all producers was 94. The average index for the respondents with low absorption capacity was 87, while the group with high absorption capacity, with a reading of 101, was much more optimistic regarding their financial prospects.
Another monthly AEB question asks respondents to identify the main thing limiting improvement in their farm’s financial situation. Response choices are as follows: low output prices, high input costs, labor and equipment constraints, weather risk, debt or financial pressure, and policy uncertainty. High input costs were chosen as the most limiting factor by over 50% of respondents. Approximately 9% of respondents indicated that debt or financial pressure was the main limiting factor.
Producers were asked two long-run policy questions. The first question asked whether the increased use of tariffs has strengthened or weakened the U.S. agricultural economy in the long run. A vast majority of respondents in both groups indicated that tariffs have weakened the agricultural economy, however, this percentage was higher for the low absorption capacity group. The second question asked whether the U.S. is generally headed in the right direction or is on the wrong track. A higher percentage of those in the high absorption capacity group indicated that the U.S. is headed in the right direction.
As expected, the average absorption capacity scores for each question (possible scores ranged from 1 to 5) and for the three questions taken together (score ranged from 3 to 15) were higher for the high absorption capacity group. However, some of the producers in the low absorption capacity group either agreed or strongly agreed with at least one of the absorption capacity questions (see Figure 2).
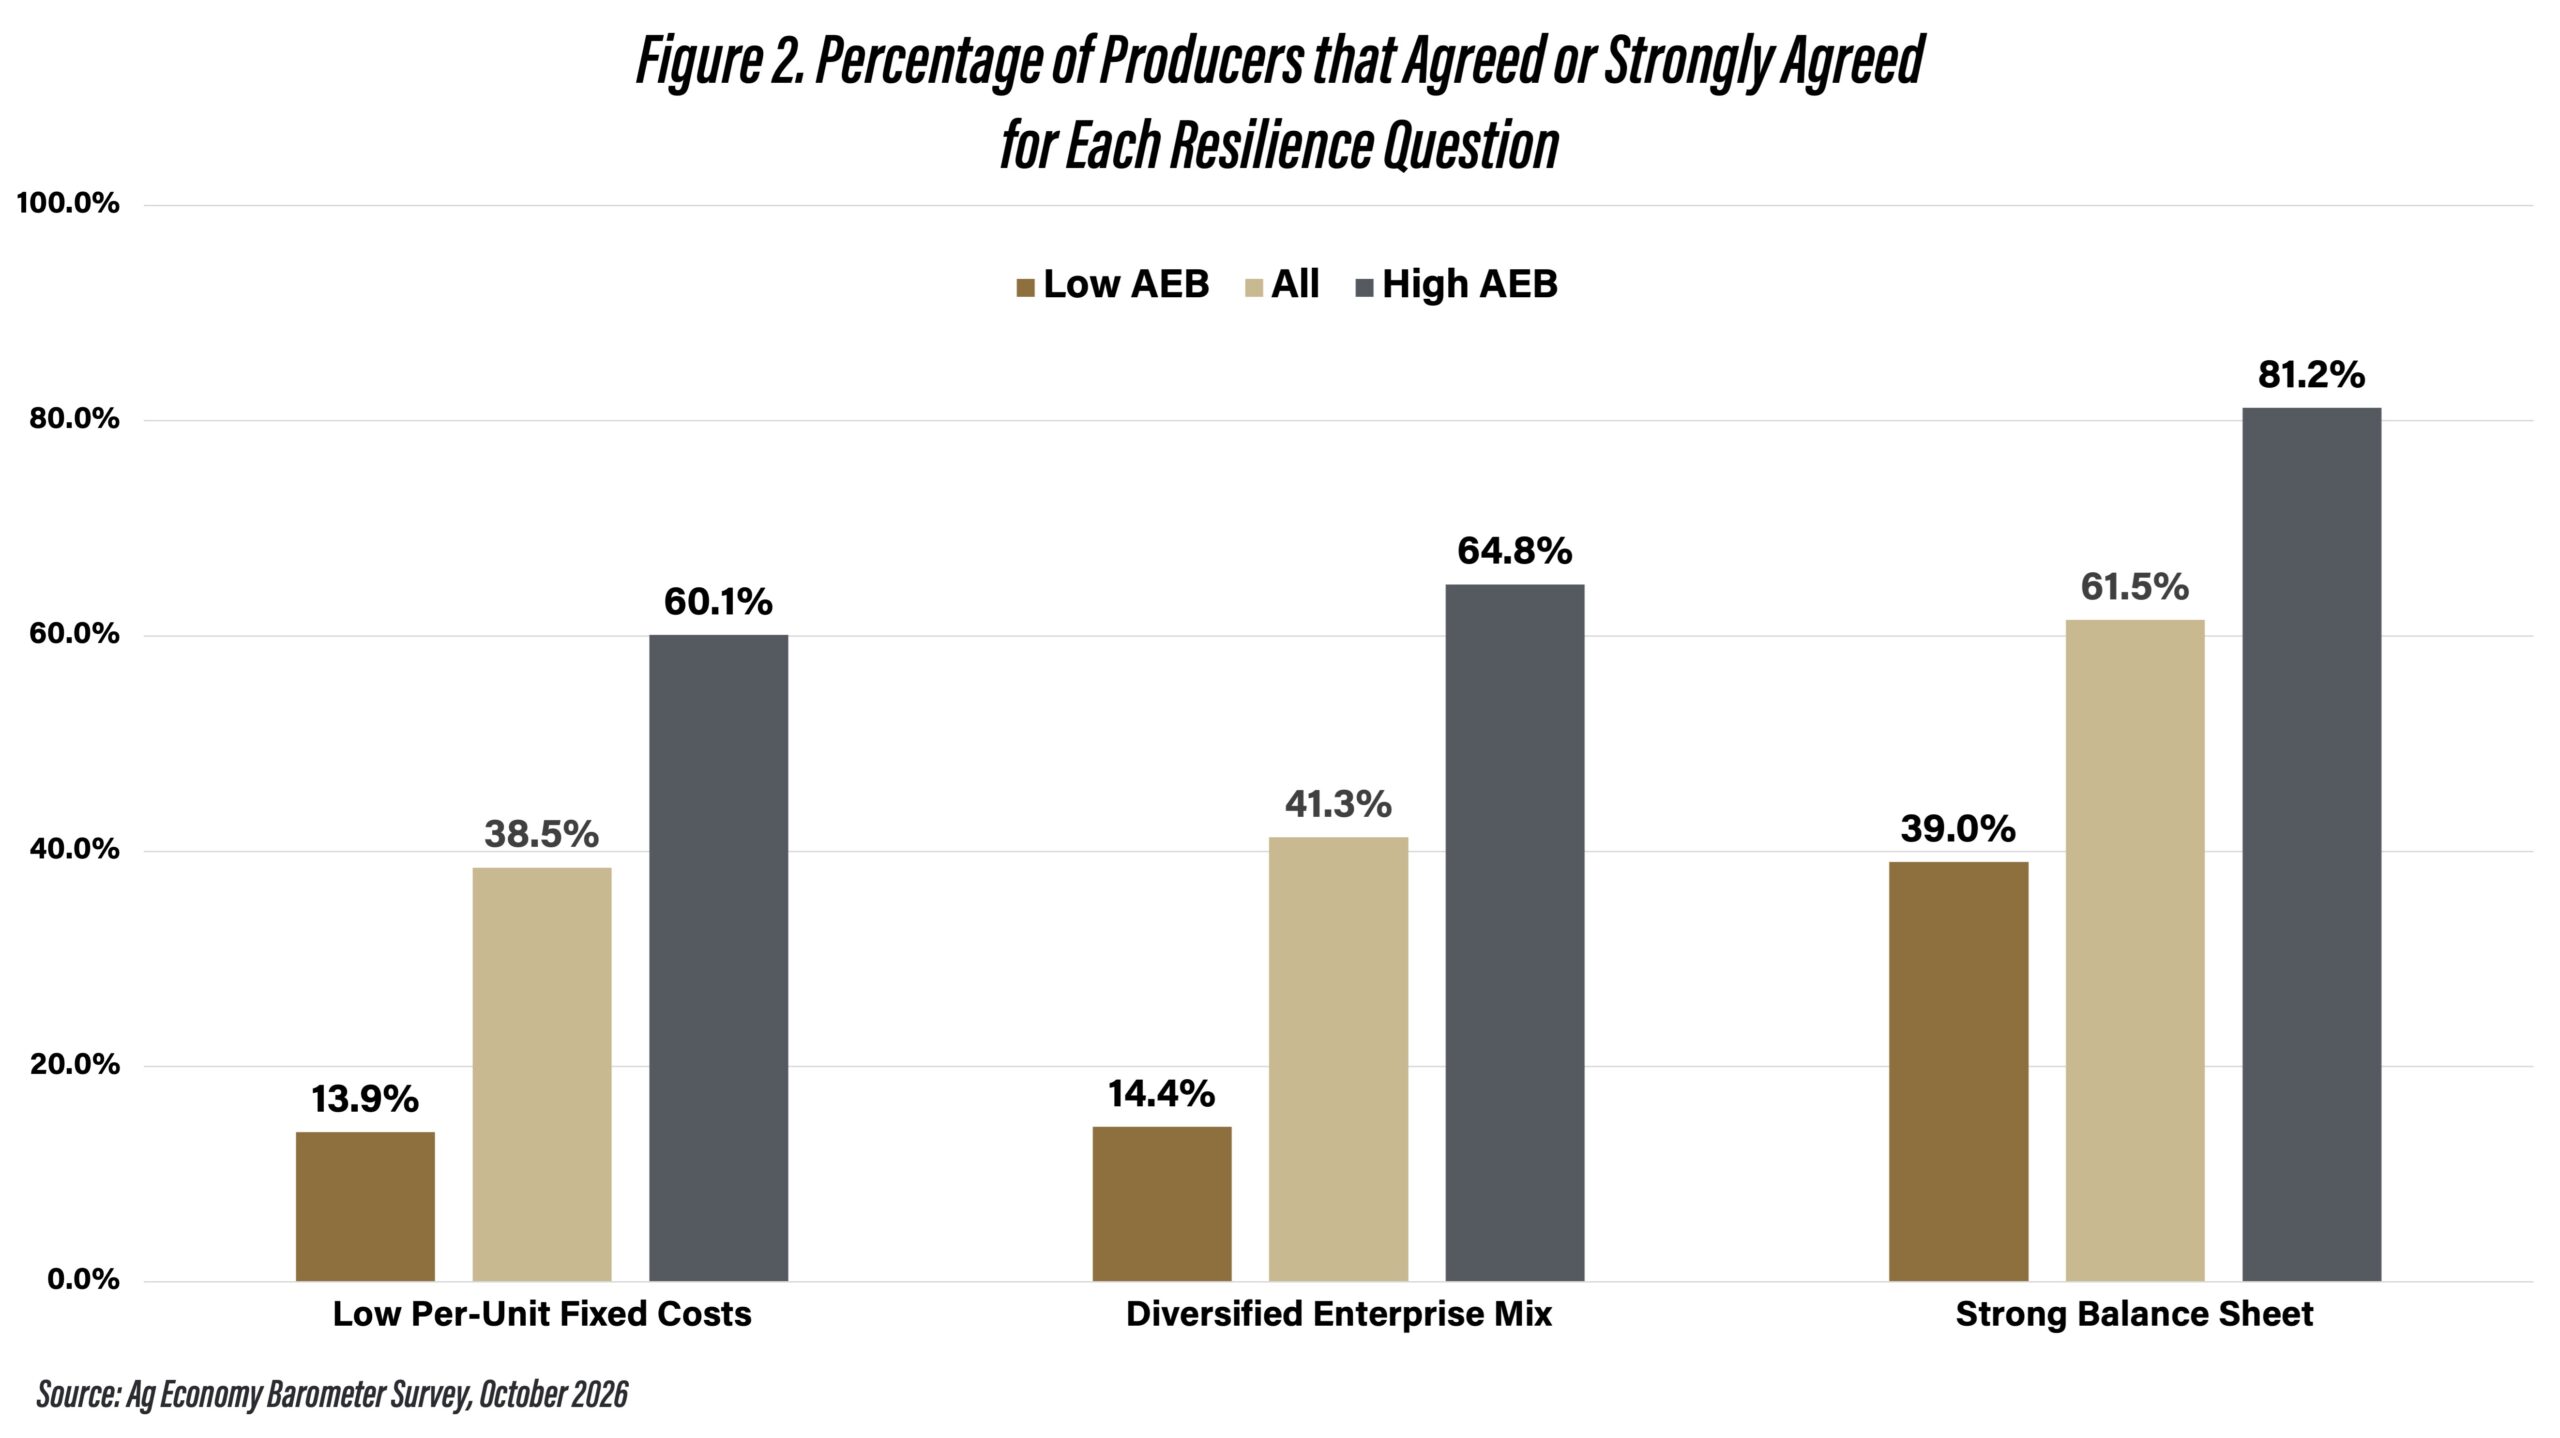
Figure 2. Percentage of Producers that Agreed or Strongly Agreed for Each Resilience Question
A neutral score for an individual statement was 3. The average score for each of the statements on fixed cost per unit and enterprise mix was around 3. In contrast, the average score for the statement on strong balance sheet was approximately 3.5 (i.e., above neutrality). The average absorption capacity score for all the AEB survey respondents was 9.5. Nearly 53% of respondents had a score above this average.
Approximately 40% of the AEB survey respondents received more than 50% of their revenue from livestock production. This percentage was relatively higher for the high absorption capacity group and relatively lower for the low absorption capacity group. This result is consistent with perceptions involving the two sectors. When asked in the October survey whether crop producers and livestock producers would have good times or bad times in the next five years, 35% of survey respondents indicated that crop producers would have good times and 53% indicated that livestock producers would have good times.
Conclusions
This article provided a scorecard that can be used to assess a farm’s absorption capacity and illustrated differences in absorption capacity among AEB survey respondents. The absorption capacity scores for the survey respondents ranged from 3 to 15 and averaged 9.5. A higher percentage of farms either agreed or strongly agreed that their farm had a strong balance sheet than agreed or strongly agreed that their farm had low fixed costs per unit or a diversified enterprise mix. In general, producer sentiment was higher for those in the high absorption capacity group.
With tight margins, particularly for crops, it is imperative that producers evaluate their ability to withstand market shocks. We encourage producers to assess their absorption capacity using our scorecard and compare the score for their farm to the distribution of scores presented in this article.
References
Langemeier, M. and J. Colussi. “Optimism Grows in October as Current Conditions Improve.” Ag Economy Barometer, November 3, 2026. (https://ag.purdue.edu/commercialag/ageconomybarometer/).
Lippsmeyer, M. and M. Langemeier. “Agility and Absorption Capacity.” Center for Commercial Agriculture, Purdue University, April 24, 2023. https://ag.purdue.edu/commercialag/home/resource/2023/04/agility-and-absorption-capacity/
Sull, D. The Upside of Turbulence. New York: Harper Collins, 2009.
TAGS:
TEAM LINKS:


RELATED RESOURCES
UPCOMING EVENTS
Compare PLC, ARC-CO and ARC-IC before making your 2026 farm program election. Join Purdue’s Michael Langemeier November 16 for a free webinar covering the pros and cons of each option, with time for Q&A.
January 8, 2027
A management programs geared specifically for farmers. Surrounded by farm management, farm policy, agricultural finance and marketing experts, and a group of your peers, the conference will stimulate your thinking about agriculture’s future and how you can position your farm to be successful in the years ahead.