

Purdue, USDA release online freeze-date tool for specialty crop growers in 25 states
A new interactive online tool for visualizing and exploring freeze-date trends and other climate patterns is now available, thanks to a partnership between Purdue University’s Midwestern Regional Climate Center and the USDA’s Midwest Climate Hub. The tool covers 25 states in the upper Midwest, Northeast and Appalachia.
“This tool isn’t itself tracking what’s happening in the current season. But it helps you put into perspective what has been happening in the past,” said Melissa Widhalm, associate director of the climate center.
Climate change has affected agriculture, noted Dennis Todey, director of the climate hub. Among those changes are first fall freezes coming later and final spring freezes happening earlier.
“We talk about that, but we didn’t have any graphics, easily accessible data or visualizations to show people at a local level. And agricultural producers like to see something more local,” Todey said.
The tool may interest producers of tree fruits, grapes and row crops such as corn and soybeans to help them take advantage of longer growing seasons.
“They want to understand how things are changing and they are changing fairly rapidly in the spring and the fall,” Todey said.
Agricultural advisers, weather forecasters, university extension staffers and state climatologists also have expressed interest in the tool.
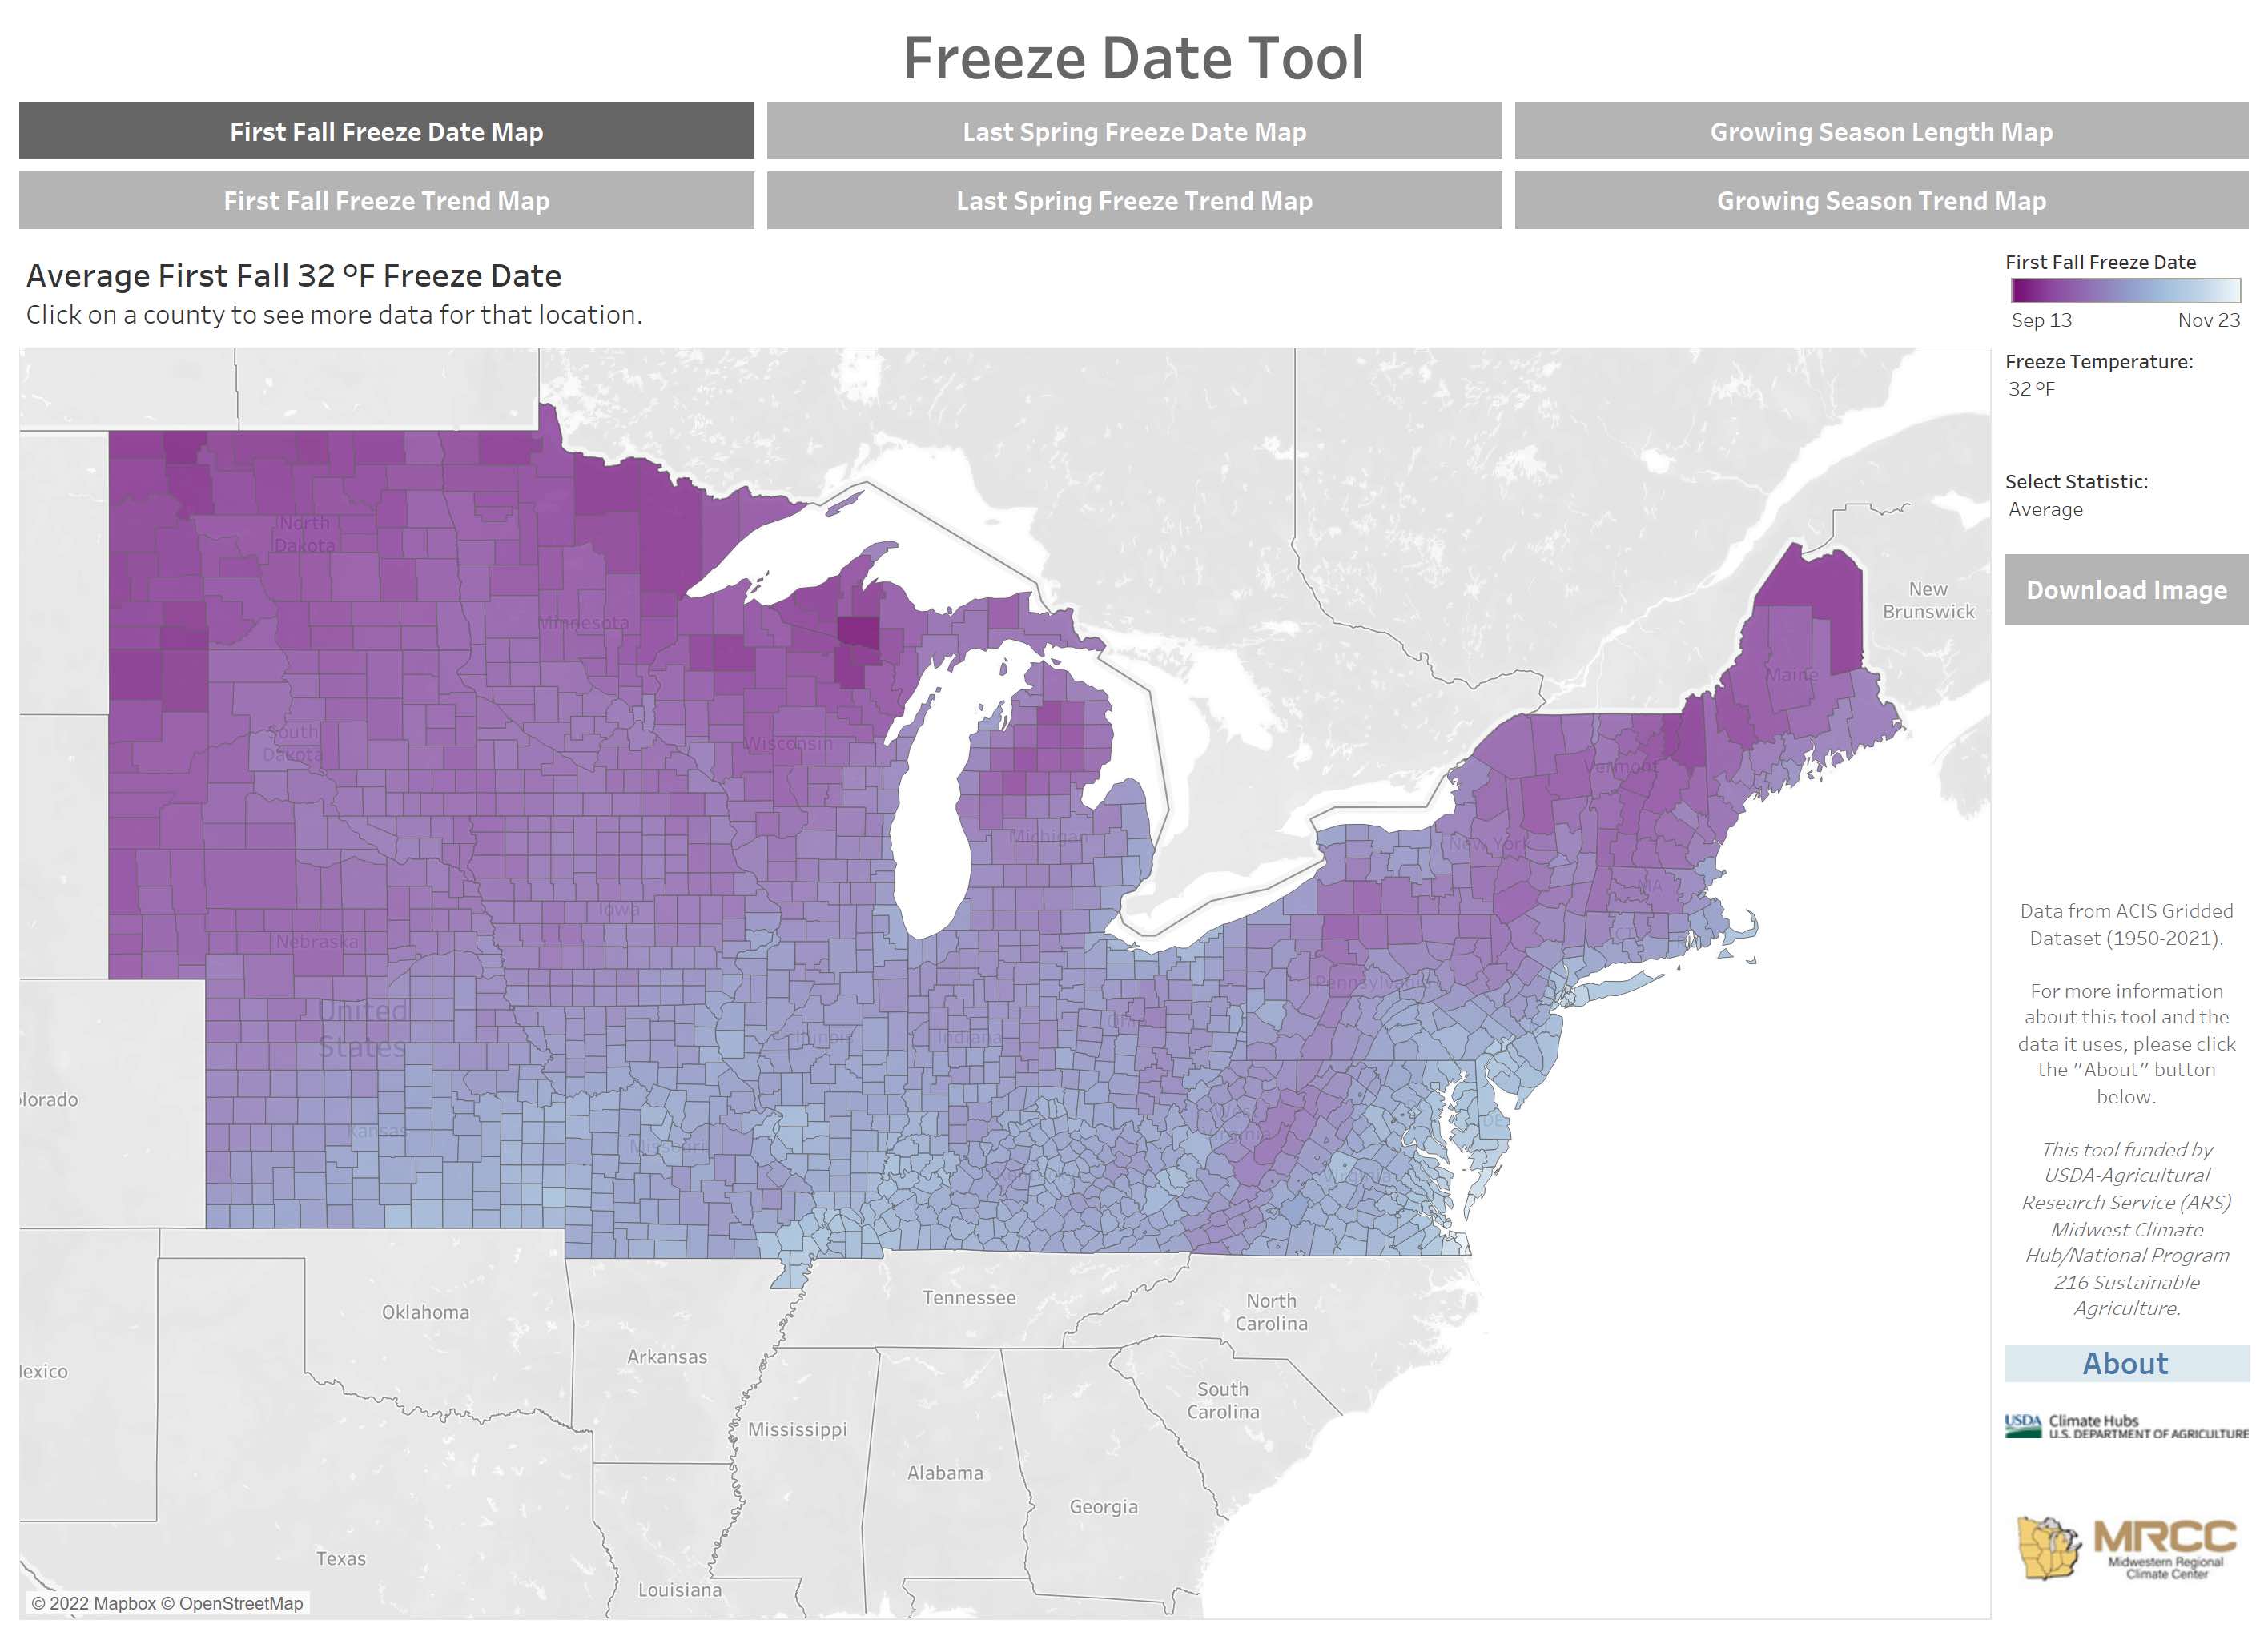 This interactive, publicly available freeze-date tool is a collaboration between Purdue University’s Midwest Regional Climate Center and the USDA’s Midwest Climate Hub. The tool contains county-by-county data from 1950 to 2021 and will be updated annually.
"We’ve had a lot of interest from National Weather Service and others who are responsible for issuing watches and warnings in real-time, so they put that into context with their forecasting of this season compared to previous seasons,” Widhalm said. But homeowners may also consult the tool to help them decide when to bring in their plants when fall arrives or begin planting in the spring.
“When you think about freeze, you immediately think, 32 degrees. But when it comes to agricultural applications, you might be interested in values that are colder or warmer,” Widhalm said.
Corn and soybeans, for example, can survive 28 degrees, while fruit trees are more sensitive to freezing or near-freezing temperatures. And the freeze-date tool allows users to query their desired temperatures.
The tool was developed for visualization rather than to explain trends, it does have research potential.
“Just because your fall freeze date changes doesn’t mean your spring freeze date is changing, or it could mean both of them are changing,” Widhalm said. “Trends can be revealed in this tool that may indicate areas needing more research.”
Today’s Midwest Climate Hub, which funded the tool, uses it to monitor conditions within its eight-state coverage area. 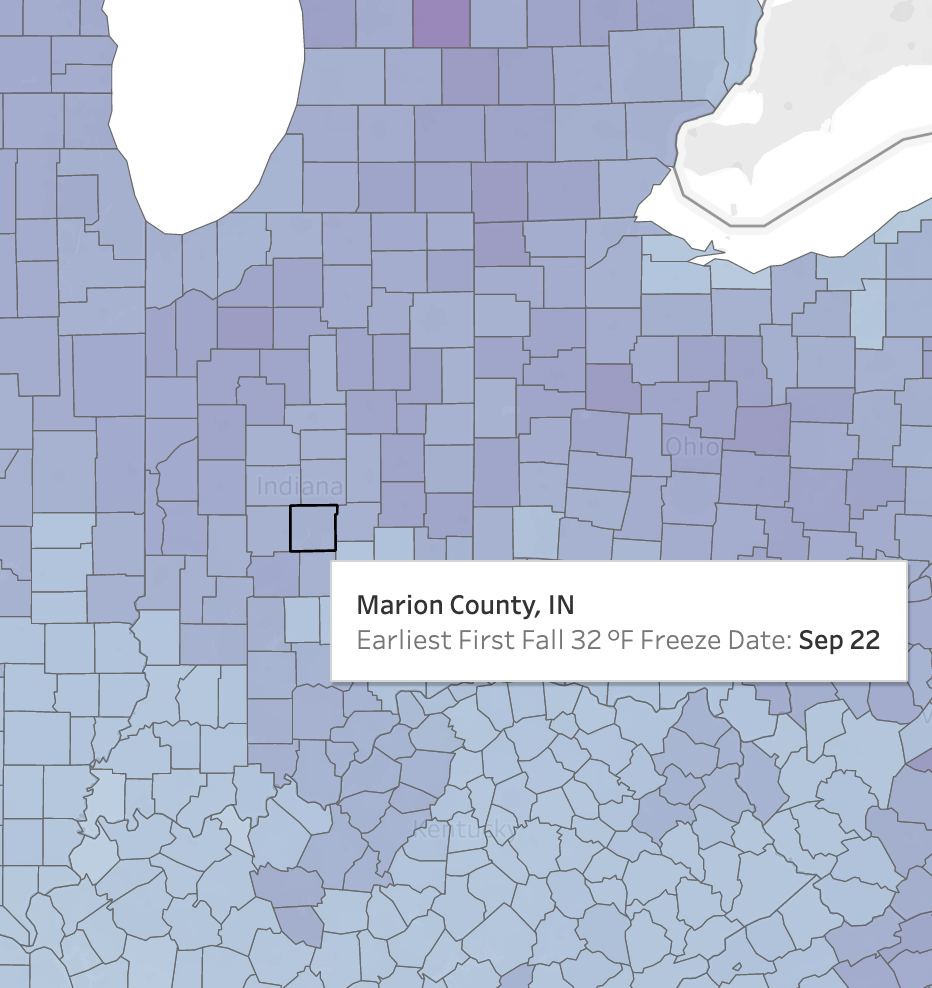
“This tool has helped us not only to display what is happening with changes at a local level but has given us a look regionally at where the trends are a bit different from location to location,” Todey said. “It’s also provided us a look at the difference in trends at different temperatures because the trends are not the same even at the same location, depending on what criteria you’re using.”
The tool, which will be updated annually, draws upon Applied Climate Information System (ACIS) data from 1950 to 2021. Weather stations across the U.S. feed data to the ACIS, but there are gaps in the network.
“You can combine data from the individual stations to start filling in those gaps,” Widhalm said. “They create a product called a gridded data set, which lets us look at these values for a county. So, if you have a lot of stations in a county, it aggregates them.”
Purdue and the USDA had previously teamed with 10 other universities and agencies on the Useful-to-Usable project. The project’s goal was to help farmers and farm advisors integrate climate information into their decision-making.
“We built a suite of tools that are still in use today to focus on keeping corn production profitable, even in a shifting climate,” Widhalm said. “The most popular was the corn-growing-degree-day tool. Farmers could go in and track growing degree days across the season and compare it to the past to understand their vulnerability to early in the season and help with timing fieldwork throughout the growing season.”
The Purdue Midwest Regional Climate Center (MRCC) and the USDA Midwest Climate Hub (MDCH) have worked well together over the years, said MRCC Director Beth Hall.
“The MWCH works with the agricultural community to help them be more cognizant of climate impacts and how variability and extremes might affect their production decisions,” said Hall, who also is the Indiana State Climatologist. She noted the MRCC’s access to historical climate data and its capacity to translate data into usable public information.
(Banner Image Photo by Wilfried Brown-Grimm)
Agriculture is one of the most critical climate-impacted sectors of the Midwest region, so this partnership has been a wonderful way to help convey the trends and risks without overwhelming stakeholders with too much science and raw data.
- Beth Hall, director of the Purdue Midwest Regional Climate Center and Indiana State Climatologist
Featured Stories

For Brody Cox, preparing for the Indiana State Fair began long before he entered the show...
Carolyn Foley, a long-time member of the Purdue Forestry and Natural Resources (FNR) and...

In the September Purdue University/CME Group Ag Economy Barometer survey, 52% of respondents...

Purdue University’s College of Agriculture recognized nine alumni at the Distinguished...
Keep your eyes peeled across Indiana for the newly minted Purdue Forestry and Natural Resources...

“Being at Purdue has changed my thinking entirely,” says Mingyu Zhao, a third-year...