

Forts to files, reimagined: MRCC brings historic weather data into the digital age
What was the weather like in the 1800s at a remote U.S. Army fort or on the frontier? Thanks to the Midwestern Regional Climate Center (MRCC), you no longer have to wonder or wait for someone to email you the data.
The MRCC recently launched a searchable, downloadable archive of 19th-century weather records. Pulled from more than 450 U.S. observation stations, including over 350 that have undergone quality control through NOAA Climate Data Base Modernization (CDMP) funding, the project digitized detailed climate reports recorded by military forts and volunteer observers across the country between 1820 and 1892.
Before this product was released, users had to contact the MRCC to request the data, which were then sent via email. This makes the process of retrieving data more efficient and instantaneous for users.” - Austin Pearson, climatologist at the Midwestern Regional Climate Center
Historic weather, modern access
The U.S. Army began taking weather observations at forts as early as the 1820s. Later, in the mid-to-late 1800s, civilian volunteer observers—managed by the Smithsonian Institution and the U.S. Department of Agriculture—joined the effort, contributing valuable reports. These early initiatives laid the foundation for the Weather Bureau's Cooperative Observer Network, which still feeds data into the National Weather Service.
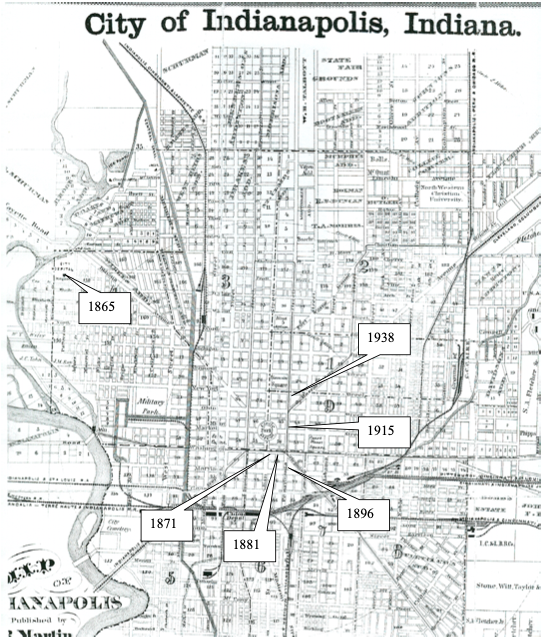 Map showing the locations of Downtown Indianapolis observation stations, based on data from Glen Conner and plotted on an 1870 map by Luther R. Martin.
 With this new digital archive, you can now explore those early observations alongside modern climate records or even paleoclimate data like tree-ring reconstructions. It’s a valuable tool for understanding how historical weather extremes and long-term climate patterns have shifted over the last 200 years.
Most of the original documents were preserved on microfilm at the National Archives and Records Administration. Now, they’ve been scanned, quality-controlled and indexed into a user-friendly digital platform through the National Center for Environmental Information (NCEI) and offline, at the MRCC service office.
What’s inside the database?
The MRCC digitalized 39 distinct data types of weather observations, including temperature, pressure, precipitation, wind, cloud cover, weather conditions, river gauge height and surface water temperature.
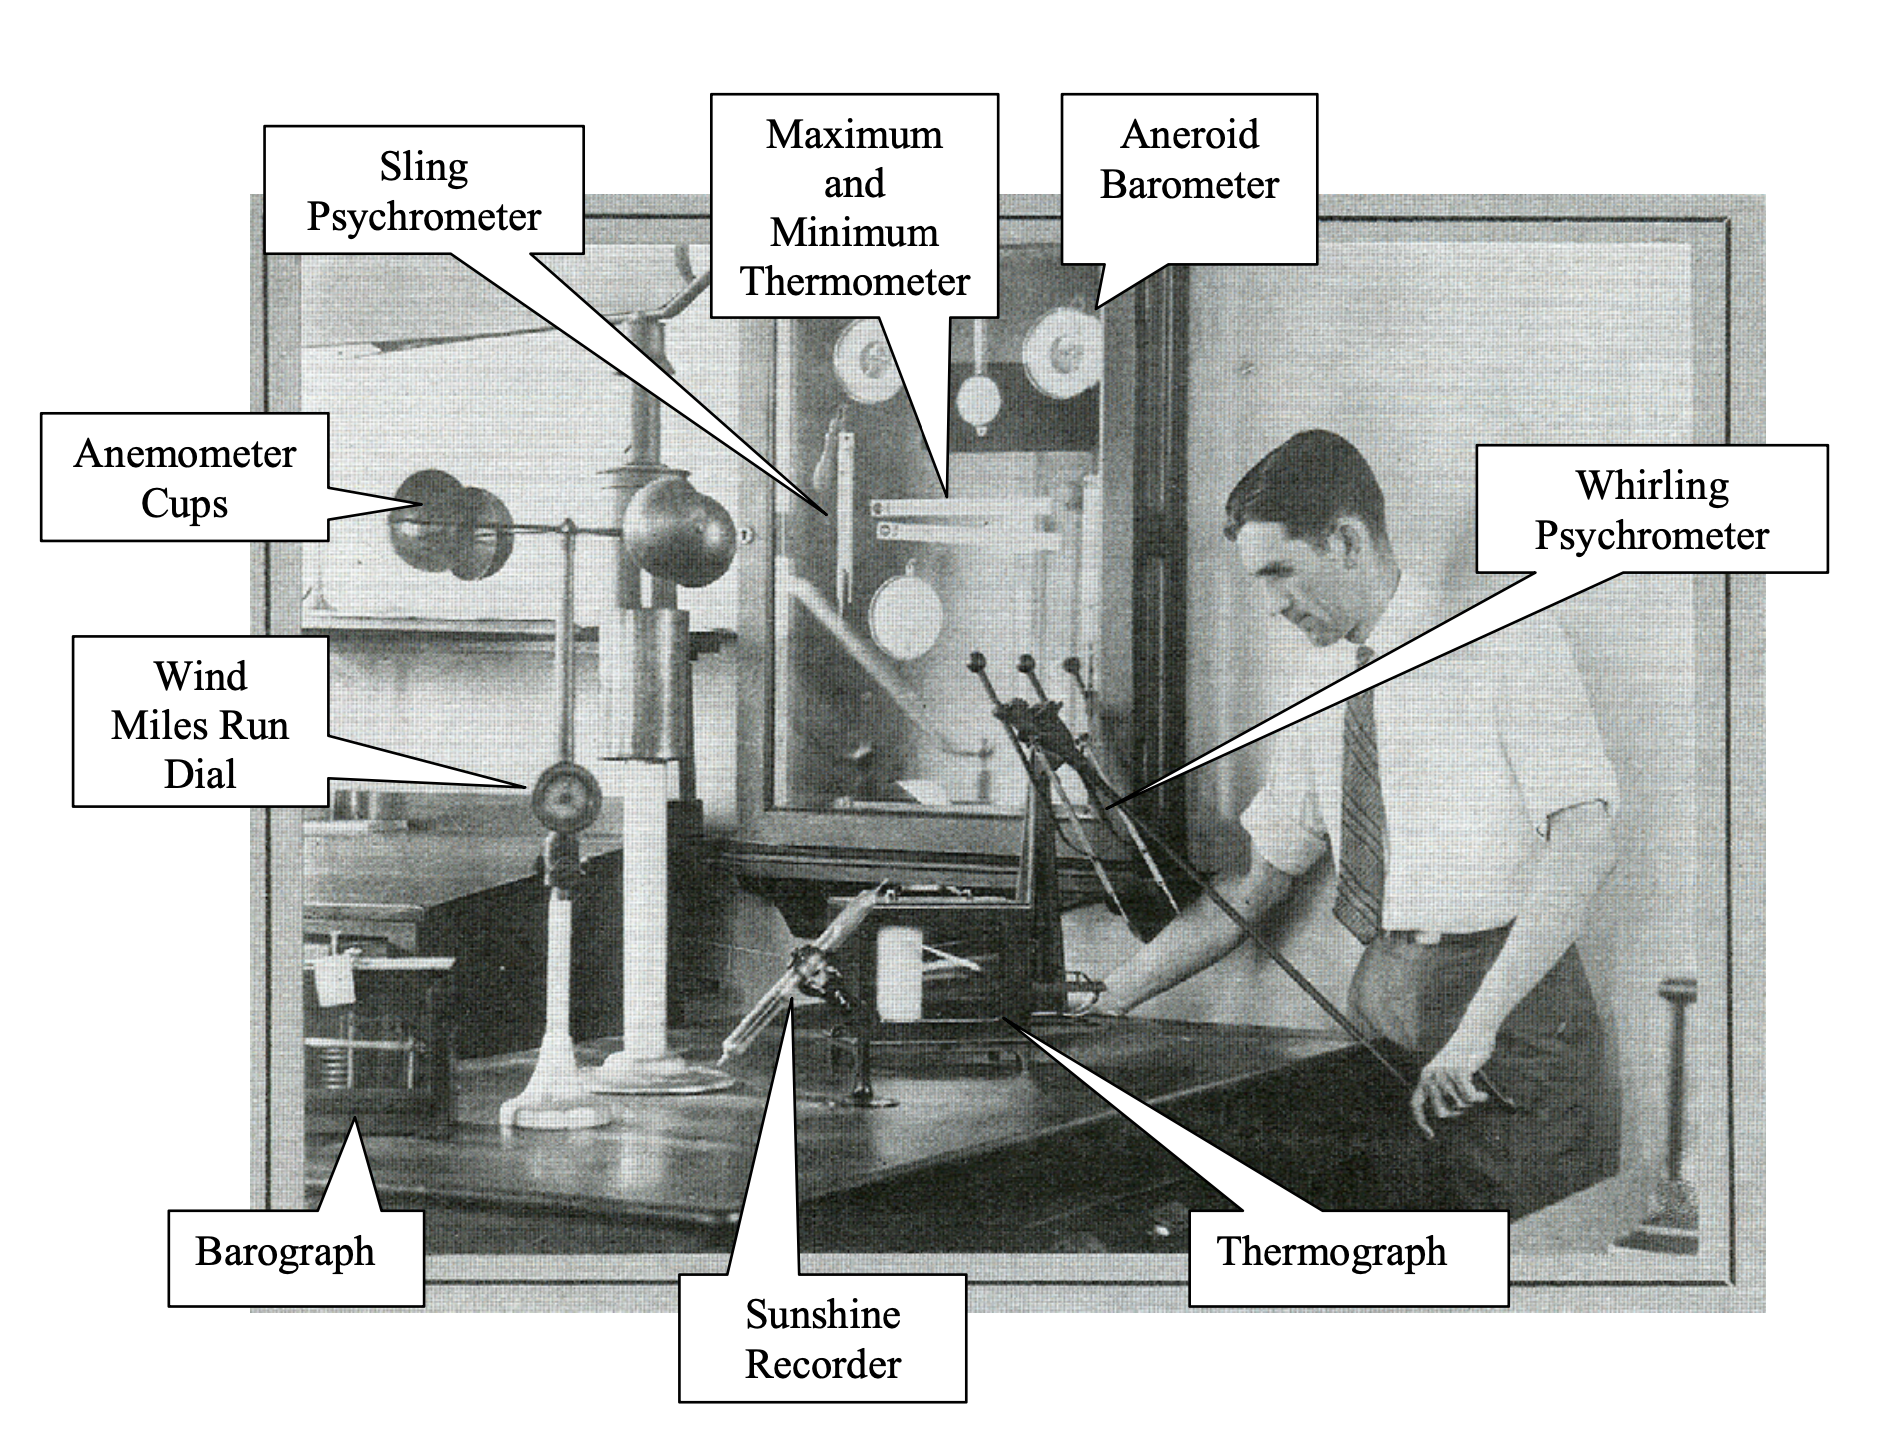 An example of the various instruments used at the Weather Bureau Office in 1926. Image provided by the National Archives and Records Administration Photograph Collection.
 To ensure reliability, a series of quality control tests and procedures were applied to confirm that the digitized data accurately reflects the observations recorded in the original, handwritten logs. Comprehensive metadata was also created to track changes in instrumentation and observation methods—from the station name and location to barometer corrections and other instrument adjustments, if available.
Through the MRCC’s website, users can now access the following.
- Daily weather data that’s been quality-controlled data by FORTS station and can be downloaded in .CSV format (including data and metadata).
- Image inventories of scanned data sheets, accessible from the National Centers for Environmental Information page.
- PDF station historieswith maps of the observation stations, photos, illustrations and detailed chronologies of locations and elevations.
- Project status lists that show which stations are digitized and quality controlled.
- Standard observation forms used in the 19th century to search records based on desired weather observation types or periods.
- 3297 data files that consist of quality-controlled weather data for individual stations, each stored in .DAT format and including various meteorological variables.
- 3200 data files that contain quality-controlled or non-quality-controlled weather data, depending on the individual station.
Data with real-world impact
The users of CDMP FORTS data are as varied as the weather itself—climatologists, historians, cryptographers, authors and even mystery-solvers.
For some, the data opens new doors to understanding how weather conditions impacted Civil War battles. For others, it helped fill in the gaps left by fragmented or incomplete weather diaries.
“By combining the MRCC records with other weather records, I have a much clearer picture of past weather events and climate. I can use the MRCC stations as a reference to other locations,” said user Herb Close, Jr. “This information helps to reconstruct weather conditions, patterns, anomalies and events back to the early nineteenth century.”
Others use the archive to extend climate observation windows, allowing for more precise assessments of the climate’s current state, especially when analyzing temperature and precipitation extremes.
“Sometimes, we use these early values in agricultural models to ensure infrastructure like irrigation can handle known extremes,” emphasized John Christy, Alabama state climatologist at the University of Alabama in Huntsville.
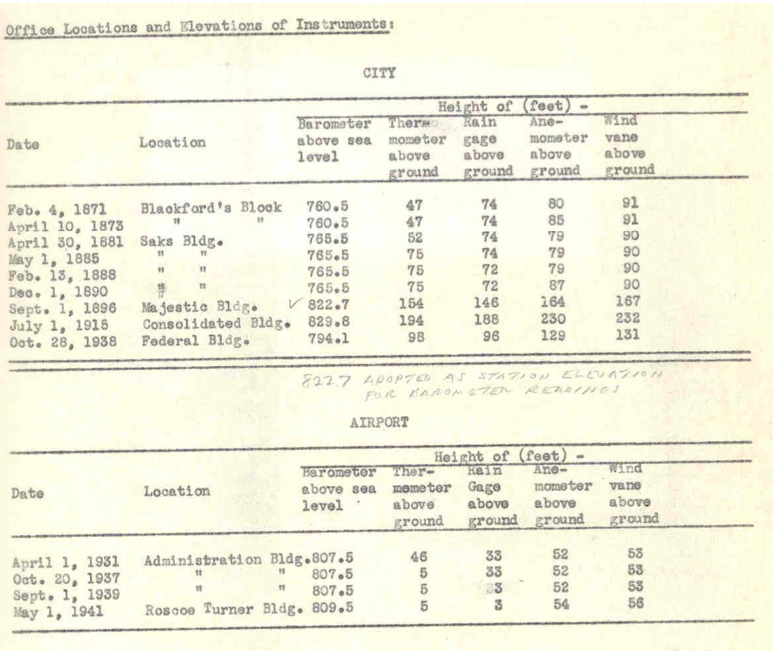 A summary of instrument elevation data for the Downtown Indianapolis and airport observation stations, originally included in a station history prepared in 1949. The scanned copy is provided by the NWS Forecast Office in Indianapolis.
 With the FORTS data now easier to access than ever before, I’m really looking forward to seeing all the ways people put this data to use. Our rich weather history comes to life when you make the data easy to find and use.” - Melissa Widhalm, associate director and regional climatologist at the MRCC
Explore the database and learn more at MRCC’s FORTS webpage.
Featured Stories

Channing Arndt, research professor in agricultural economics and director of the Global Trade...

Daniel Szymanski and his former postdoctoral scholar Youngwoo Lee, lead author on their paper...
The Costa Rica Rainforest Experience study abroad trip allowed students to experience the wonders...

Trask is writing a new narrative about rats, birds and people as he pursues his doctorate in...

Several Forestry and Natural Resources students, staff and recent alumni have been recognized for...
A plume of contamination spreads underground. A building's foundation weakens. A wetland...