Dairy and Milk Markets in 2021-2022
January 13, 2022
PAER-2022-6
Author: Nicole Olynk Widmar, Professor of Agricultural Economics


The end of 2021 marks a 6 month run of declining U.S. milk cow numbers; U.S. milk cow numbers have declined each month since June 2021. From mid-June to early June 2021 the federally inspected dairy cow slaughter activity was up over corresponding weeks in 2020, but recently is below corresponding weeks in 2019. As of October 2021 the year-over-year growth in milk supply fell below October 2020 after sluggish growth numbers foreshadowed in August and September. For 2021 Q4 dairy cow numbers are projected to average 9.395 million head. Average milk per cow in Q4 is projected down 10 pounds per head from November’s forecast. Taken all together the all U.S. milk production forecast has been lowered for 2021 and 2022, while prices are forecasted higher, according to the latest USDA Economic Research Service Situation and Outlook report (Dec 2021).
Last year’s concerns in dairy markets were heavily fueled by COVID-19 associated closures, short-lived but highly publicized milk dumping, and food away from home versus at home consumption. In 2021 the domestic use varied significantly across types of dairy products, with significant decreases reported for dry skim products and the largest increase in domestic use for Q3 being reported in November for butter, up 10.1% year-over-year.
Fat Content and Fluid Milk
While perhaps not headline leading specifically in 2021, fluid milk consumption trends remain a heavily debated aspect of milk demand and markets. A recent report, Examining the Decline in U.S. Per Capital Consumption of Fluid Cow’s Milk, 2003-2018 was released by USDA, ERS researchers delving into milk uses and consumption by children, teenagers, and adults. U.S. per capital consumption of fluid cow’s milk was been in decline for over 70 years, falling at an average rate of 1% per year during the 2000s and 2.6% per year in the 2010s. Investigating fluid beverage milk data available from Dairy Data files from USDA ERS , it is suggesting that the overall sales quantities by fat content may be worthy of investigation.
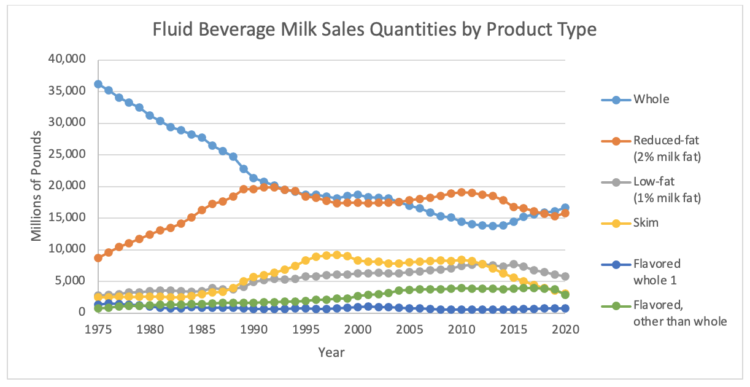
Figure 1: Fluid Beverage Milk Sales Quantities by Product Type
While the decrease in whole milk is evident over the time period shown, the more recent upward turn in total whole milk sales may be of interest, especially in light of recommendations for milk fat consumption by children by the American Academy of Pediatrics.
Fluid milk and dairy products are often associated with children’s diets, spurring our recent investigation into consumer purchases in households with and without children present. We have found that households with children indeed bough dairy differently, buying not only higher total quantities of milk but also milk with higher fat content. Nonetheless, debates continue surrounding milk fat consumption, and given the ongoing economic and political concerns surrounding school meals and milk provision, especially considering school closures (or the threats of school closures) due to the ongoing pandemic.
Dairy Markets
Overall 2021 export projections are higher, by approximately 2.5 billion pounds (on a milk-fat basis); exports of cheese, butter, dry skim products, whey, and lactose are expected to remain strong. Imports are raised slightly on a milk-fat-basis, largely due to imports of cheese and butterfat. ERS is forecasting lower ending stocks on a milk-fat basis and domestic use up 0.3 billion pounds on a milk-fat basis. Taken all together we can summarize as higher use, lower ending stock projects, lower cow numbers and production … all factors expected to exert upward pressures on prices. All-milk for 2021 Q4 was projected in the ERS Dec 2021 report at $20.45 per cwt, which is an increase of $0.45 over the November forecast. All 2021 all-milk is forecasted at $18.60 per cwt, which is an increase of $0.10 over November’s forecast. Currently the 2022 all-milk forecast is $20.75 per cwt, which is up $0.50 from November’s forecasted price and is bolstered by expected hither Class III and Class IV price projections.