December 11, 2023

Corn and Soybean Basis Levels Remain Weaker than Normal but are Strengthening

by Nathanael Thompson

Corn and soybean basis remains weaker than normal in many parts of the United States. For example, in Central Indiana corn basis the first week of December was $0.45/bu. under March ‘24 corn futures. This is $0.36/bu. weaker than the three-year historical average basis level for the same time and region. In fact, this year’s corn basis levels are the weakest we have seen this late in the year since the beginning of the trade war in 2018. However, note that despite weaker than normal basis levels, corn basis in Central Indiana has strengthened $0.24/bu. relative to March ’24 futures in just the last two weeks.
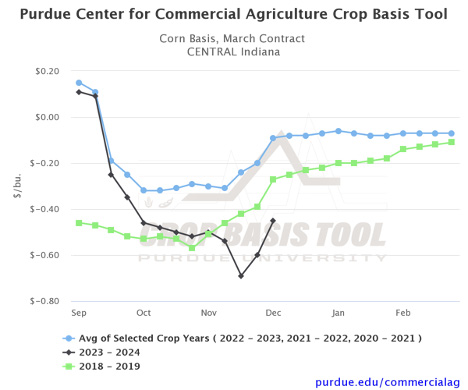
Corn Basis, March Contract for Central Indiana. Source Purdue Center for Commercial Agriculture Crop Basis Tool.

Soybean basis in Central Indiana the first week of December was $0.47/bu. under March ‘24 soybean futures. This is $0.28/bu. weaker than the two-year historical average basis level for the same time and region. Again, these are the weakest soybean basis levels we have seen this late in the year since the 2018 trade war. However, notice that weaker than normal basis levels this year are still quite a bit stronger than 2018 levels given the disproportionate effect of the trade war on soybeans. Despite weaker than normal soybean basis levels, soybean basis has been steadily strengthening at a similar rate to the two-year historical average since October.
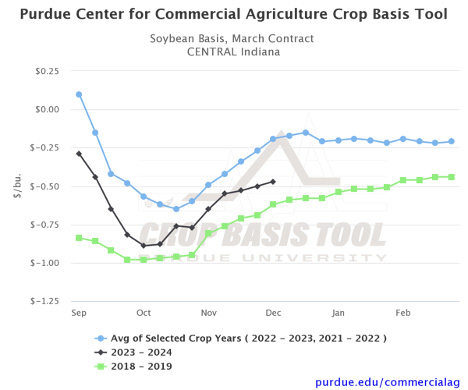
Soybean Basis, March Contract for Central Indiana. Source Purdue Center for Commercial Agriculture Crop Basis Tool.

Our research suggests that this weakness in basis levels is likely to persist for the next 8 to 12 weeks. In other words, if you are forecasting basis between now and February 2024 you would likely want to adjust historical averages to reflect current weakness. After that, our results suggest that reverting to the historical averages, ignoring current weakness, would be the best forecast of corn and soybean basis levels. For more insight on determining the best basis forecast for corn and soybeans check out this article.

As always, be sure to visit the Purdue Center for Commercial Agriculture Crop Basis Tool to check current corn and soybean basis levels and historical basis trends in your local area.

TAGS:

TEAM LINKS:

RELATED RESOURCES

Corn Basis Is Doing Something Unusual This Summer

June 30, 2026

Corn and soybean basis strengthened across much of the Eastern Corn Belt over the past month — a surprising shift from the typical seasonal pattern of basis weakening heading into June. Josh Strine breaks down the latest corn and soybean basis trends, how current basis levels compare with historical averages, and what strengthening basis could mean for grain marketing decisions heading into July.

READ MORE

June Crop Basis Update: Region-Wide Strengthening Continues

June 19, 2026

Corn and soybean basis strengthened broadly across the Eastern Corn Belt over the past month, breaking from typical seasonal trends. Indiana and Ohio continue to show some of the strongest basis levels in the region, while recent gains in Iowa have narrowed historical gaps. Use the Purdue Crop Basis Tool to monitor local opportunities as summer marketing decisions approach.

READ MORE

Basis Gains Slow as Historically Suggested Volatility Looms

May 14, 2026

Corn and soybean basis strengthened across much of the Eastern Corn Belt through late April and early May, though gains slowed significantly in recent weeks. Purdue’s May 2026 Basis Update examines regional basis differences, historical trends, and what producers may expect as volatility potentially increases heading into June.

READ MORE

UPCOMING EVENTS

We are taking a short break, but please plan to join us at one of our future programs that is a little farther in the future.

2026 Crop Cost and Return Guide

September 16, 2025

The 2026 Purdue Crop Cost and Return Guide provides estimated costs and net returns for planting, growing, and harvesting corn, soybeans, and wheat in the upcoming year. Cost and return information presents information for low, average, and high productivity soils. Early projections point to slightly higher breakeven prices.

READ MORE

2025 Farmland Values & Market Trends

September 9, 2025

Purdue ag economists Todd Kuethe and Michael Langemeier as they discuss Indiana farmland values on this, the first of two episodes reviewing the 2025 Purdue Farmland Values and Cash Rental Rates survey results. The survey shows Indiana land prices continue to rise and are anticipated to continue a modest increase for the rest of 2025 for most of the state.

READ MORE

Farmland Prices Increase Despite Downward Pressure, Purdue Ag Econ Report August 2025

August 19, 2025

Indiana farmland prices have continued the trend of record highs in 2025, according to the latest Purdue Farmland Value and Cash Rents Survey results. The average price of top-quality farmland reached $14,826 per acre, a 3.0% increase from June 2024. Statewide, cash rents increased from 1.5 to 1.7% for poor-, average-, and top-quality land.

READ MORE