August 21, 2026
August brings late-summer weakening while Iowa soybean basis surges
by Josh Strine


Since the third week of July, corn basis across the Eastern Corn Belt has weakened. This marks a reversal of the broad strengthening that occurred in the region the previous month. However, as we noted in July, this was not entirely unexpected given historical August trends. By contrast, soybean basis movement remains more variable. Across the region, we see pockets of basis increases and decreases in each state except Michigan. The most notable soybean basis strengthening came in Iowa, with gains as high as $0.24/bu over the past month. These gains deviate from seasonal trends, which also suggested weakening into the end of the marketing year.
Corn Basis Trends
Since the third week of July, corn basis has decreased in 30 of the 41 crop reporting districts tracked in the Crop Basis Tool. However, the weakening was not uniform across the region. The largest drop occurred in Southeast Indiana, where basis fell by $0.27/bu to -$0.32/bu (Figure 1). The current basis in the district is the lowest for this time of year since the 2009-2010 marketing year. Other areas that saw sharp declines over the last month include Southern Illinois, Indiana, and Ohio; West Central Michigan; and Central Ohio. Losses in the southern parts of the region align with a large decrease in basis along the Ohio River, a loss of $0.26/bu over the past five weeks (Figure 2).
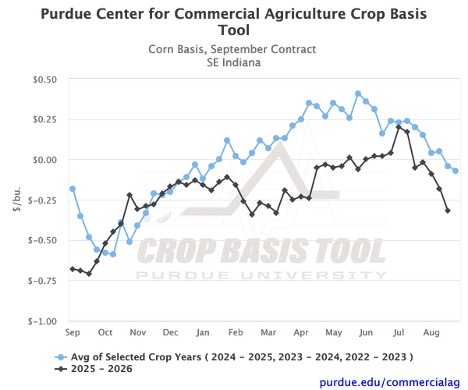
Figure 1. Corn Basis, September Contract for Southeast Indiana, Purdue Crop Basis Tool
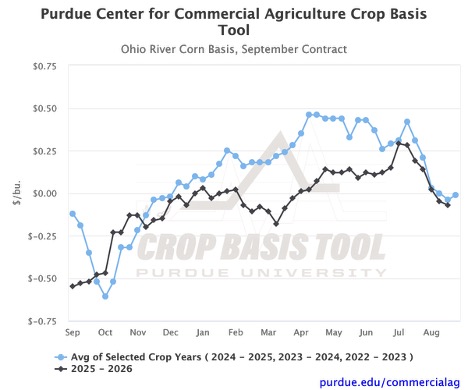
Figure 2. Ohio River Corn Basis, September Contract, Purdue Crop Basis Tool
Iowa has seen the most positive movement over the past month, with basis increasing in 6 of the 9 crop reporting districts. However, gains were modest. For example, in Central Iowa, corn basis to September futures increased by $0.03/bu since the third week of July (Figure 3). The greatest basis gains in the state were $0.04/bu over the past month. Overall, the state’s basis movement was the least variable, with the largest decrease in the state only $0.06/bu, significantly smaller than the losses in the other four states.
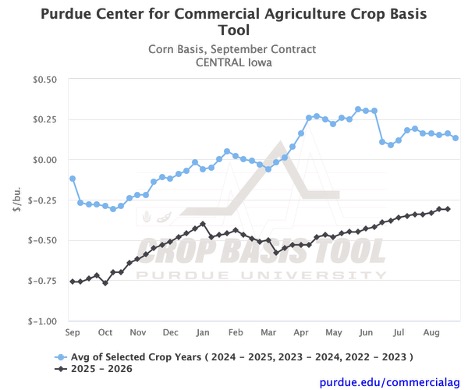
Figure 3. Corn Basis, September Contract for Central Iowa, Purdue Crop Basis Tool
While Iowa basis has been the most stable over the past month, current basis in the state still lags the rest of the region (Figure 4). Northeast Iowa currently has the lowest basis across the region at -$0.40/bu. Similar lows are seen in Iowa and Illinois. The benchmark continues to be set in central Ohio and Indiana, where basis is positive and as high as $0.17/bu. The recent weakening in the southern part of the region has pushed several positive basis levels in Illinois, Indiana, and Ohio to among the lowest in those states.
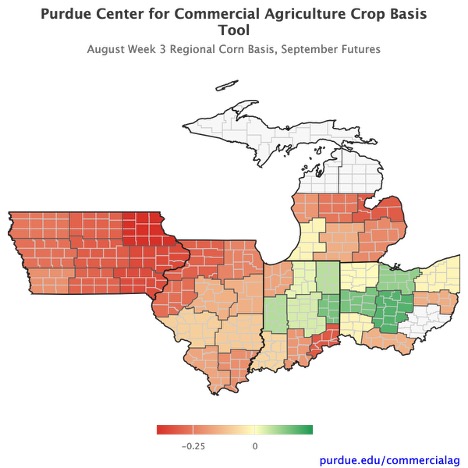
Figure 4. August Week 3 Regional Corn Basis, September Futures, Purdue Crop Basis Tool
Soybean Basis Trends
Soybean basis movement remains variable. Over the past month, basis increased in 17 districts and decreased in 23. While decreases reached as much as $0.20/bu, increases were more pronounced, up to $0.24/bu. Even within states, basis movement varies significantly. Only in Michigan did basis decrease in each crop reporting district, with declines ranging from $0.03/bu to $0.18/bu (Figures 5 and 6). Basis in Ohio showed the highest variability, with gains as high as $0.10/bu and losses as large as $0.20/bu. Similarly wide trend dispersion is observed in Indiana and Illinois.
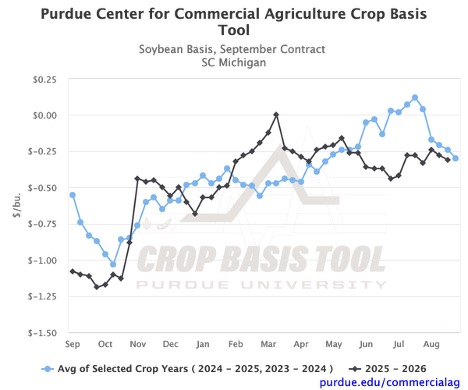
Figure 5. Soybean Basis, September Contract for Southcentral Michigan, Purdue Crop Basis Tool
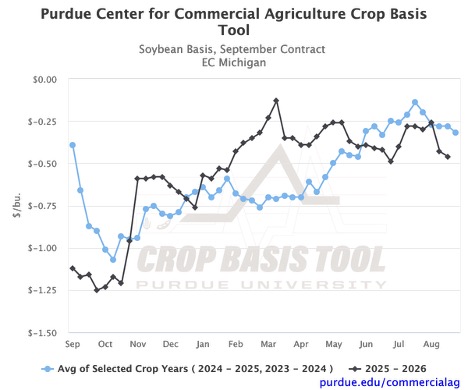
Figure 6. Soybean Basis, September Contract for Eastcentral Michigan, Purdue Crop Basis Tool
As with corn, Iowa offers the greatest positive basis gains. Since the third week of July, soybean basis has increased in 8 of the 9 crop reporting districts. East Central Iowa was the lone district where basis decreased by just $0.05/bu (Figure 7). However, the maximum gains within the state more than doubled those in the other four states. In all three of the western districts within the state, basis increased by $0.24/bu. In West Central, that pushed the basis to $0.05/bu (Figure 8). This is the first time this year that the soybean basis relative to the September futures has been positive. In a year when Iowa soybean basis has largely been below the two-year average, several districts of the state, especially in the western parts, are recording their highest basis levels for this time of year in over a decade. The strength in Iowa’s soybean market extended to the processing sector as well, where processor basis surged $0.41/bu over the month to $0.43/bu.
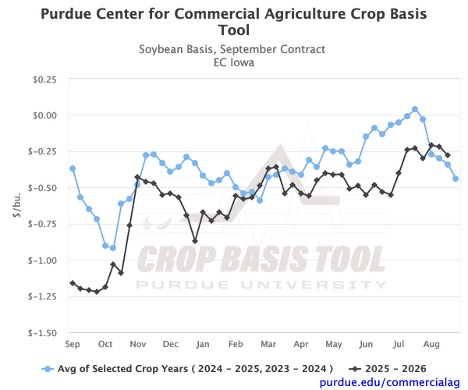
Figure 7. Soybean Basis, September Contract for Eastcentral Iowa, Purdue Crop Basis Tool
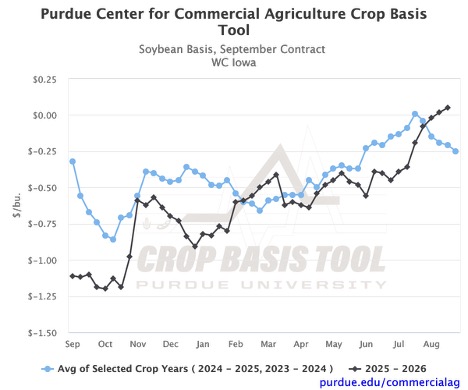
Figure 8. Soybean Basis, September Contract for Westcentral Iowa, Purdue Crop Basis Tool
Recent volatility has significantly altered the basis map (Figure 9). Through July, the entire state of Iowa had some of the lowest basis in the region. However, recent gains in the western part of the state have pushed the basis into positive territory and now make it comparable to the southern parts of Illinois, Indiana, and Ohio, which previously had the highest basis. The strongest basis has shifted north and is now observed in the central parts of Illinois, Indiana, and Ohio. Despite some weakening across the region, the basis map is broadly more positive than the July map. However, it is important to note that the reference futures contracts have shifted from August to September.
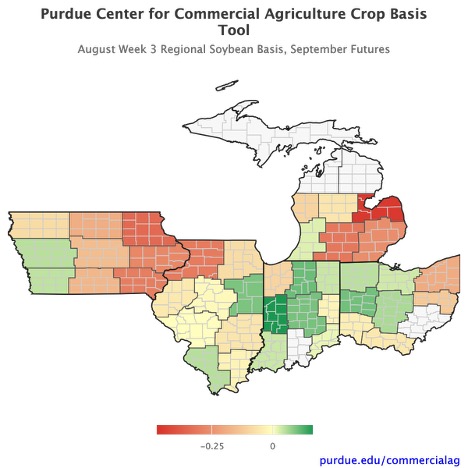
Figure 9. August Week 3 Regional Soybean Basis, September Futures, Purdue Crop Basis Tool
Looking Ahead
As we move into September, our focus turns to the 2026-2027 marketing year. Next month, we will be able to observe the starting point for local basis in the new year. As we saw this year, early indicators can provide meaningful insight into spatial variation throughout the year. For example, Iowa had one of the lowest bases last year, and that remained true through this summer. Only in the past month did we see Iowa soybean basis approach the highs observed in other states. To get a first look at the new crop basis in the coming weeks or to see where basis closes in August, you can visit the Purdue Center for Commercial Agriculture’s Crop Basis Tool.
TAGS:
TEAM LINKS:

RELATED RESOURCES
UPCOMING EVENTS
Join educators from across the Midwest to build skills for communicating soil health concepts on Nov. 4-5, 2026. In the field, we’ll evaluate the relationship between soil health and water management focusing on irrigation and edge of field practices. The in-service will have both classroom and on farm demonstrations.
The Land of Opportunity: A Conference for Farmland Owners will be held at two locations on October 5 and October 6, providing farmland owners with valuable information and resources to help them make informed decisions about their land. The conference will feature keynote presentations, educational breakout sessions, and networking opportunities designed specifically for those who own, manage, or have an interest in farmland.