June 13, 2025
Prospects for Swine Feed Costs in the Second Half of 2025
by Michael Langemeier
![]()
![]()
![]()
![]()
![]()
Indiana corn prices averaged $4.27 per bushel in 2024, before increasing to an average price per bushel of $4.58 in the first quarter of this year. The most recent WASDE report projected that corn price per bushel would average $4.20 for the marketing year that starts in September. Based on historical prices, the actual corn price could easily be 10 percent above or below estimates made at this time of the year. How do these projections impact feed costs in the second half of this year? To address that question, this article examines trends in feed costs as well as the impact of corn and soybean meal prices on feed costs for farrow-to-finish and swine finishing operations.
It is important to note that the swine finishing enterprise represented in this article assumes the finishing of an early-weaned pig. The rations for the farrow-to-finish and swine finishing enterprises consist of corn, soybean meal, dry distillers’ grain, and supplements. Corn prices represent averages for Indiana as reported by USDA-NASS. Soybean meal and distillers’ grain prices are obtained from Feed Outlook, published monthly by USDA-ERS. Information from Agricultural Prices, a monthly USDA-NASS publication, was used to compute supplement prices. Early June futures prices for corn and soybean meal were used to project feed indices for the rest of 2025. Feed cost indices are reported on a closeout month rather than a placement month basis.
Corn and Soybean Meal Prices
Figures 1 and 2 report monthly corn and soybean meal prices from January 2007 to April 2025. Corn price averaged $4.72 per bushel from 2007 to the current month. Soybean meal price averaged $362 per ton from 2007 to the current month. Current corn and soybean meal prices are below the long-run averages. Futures prices suggest that corn and soybean meal prices are likely to remain below their long-run averages well into next year. The impact of these corn and soybean meal projections on feed costs are discussed below.
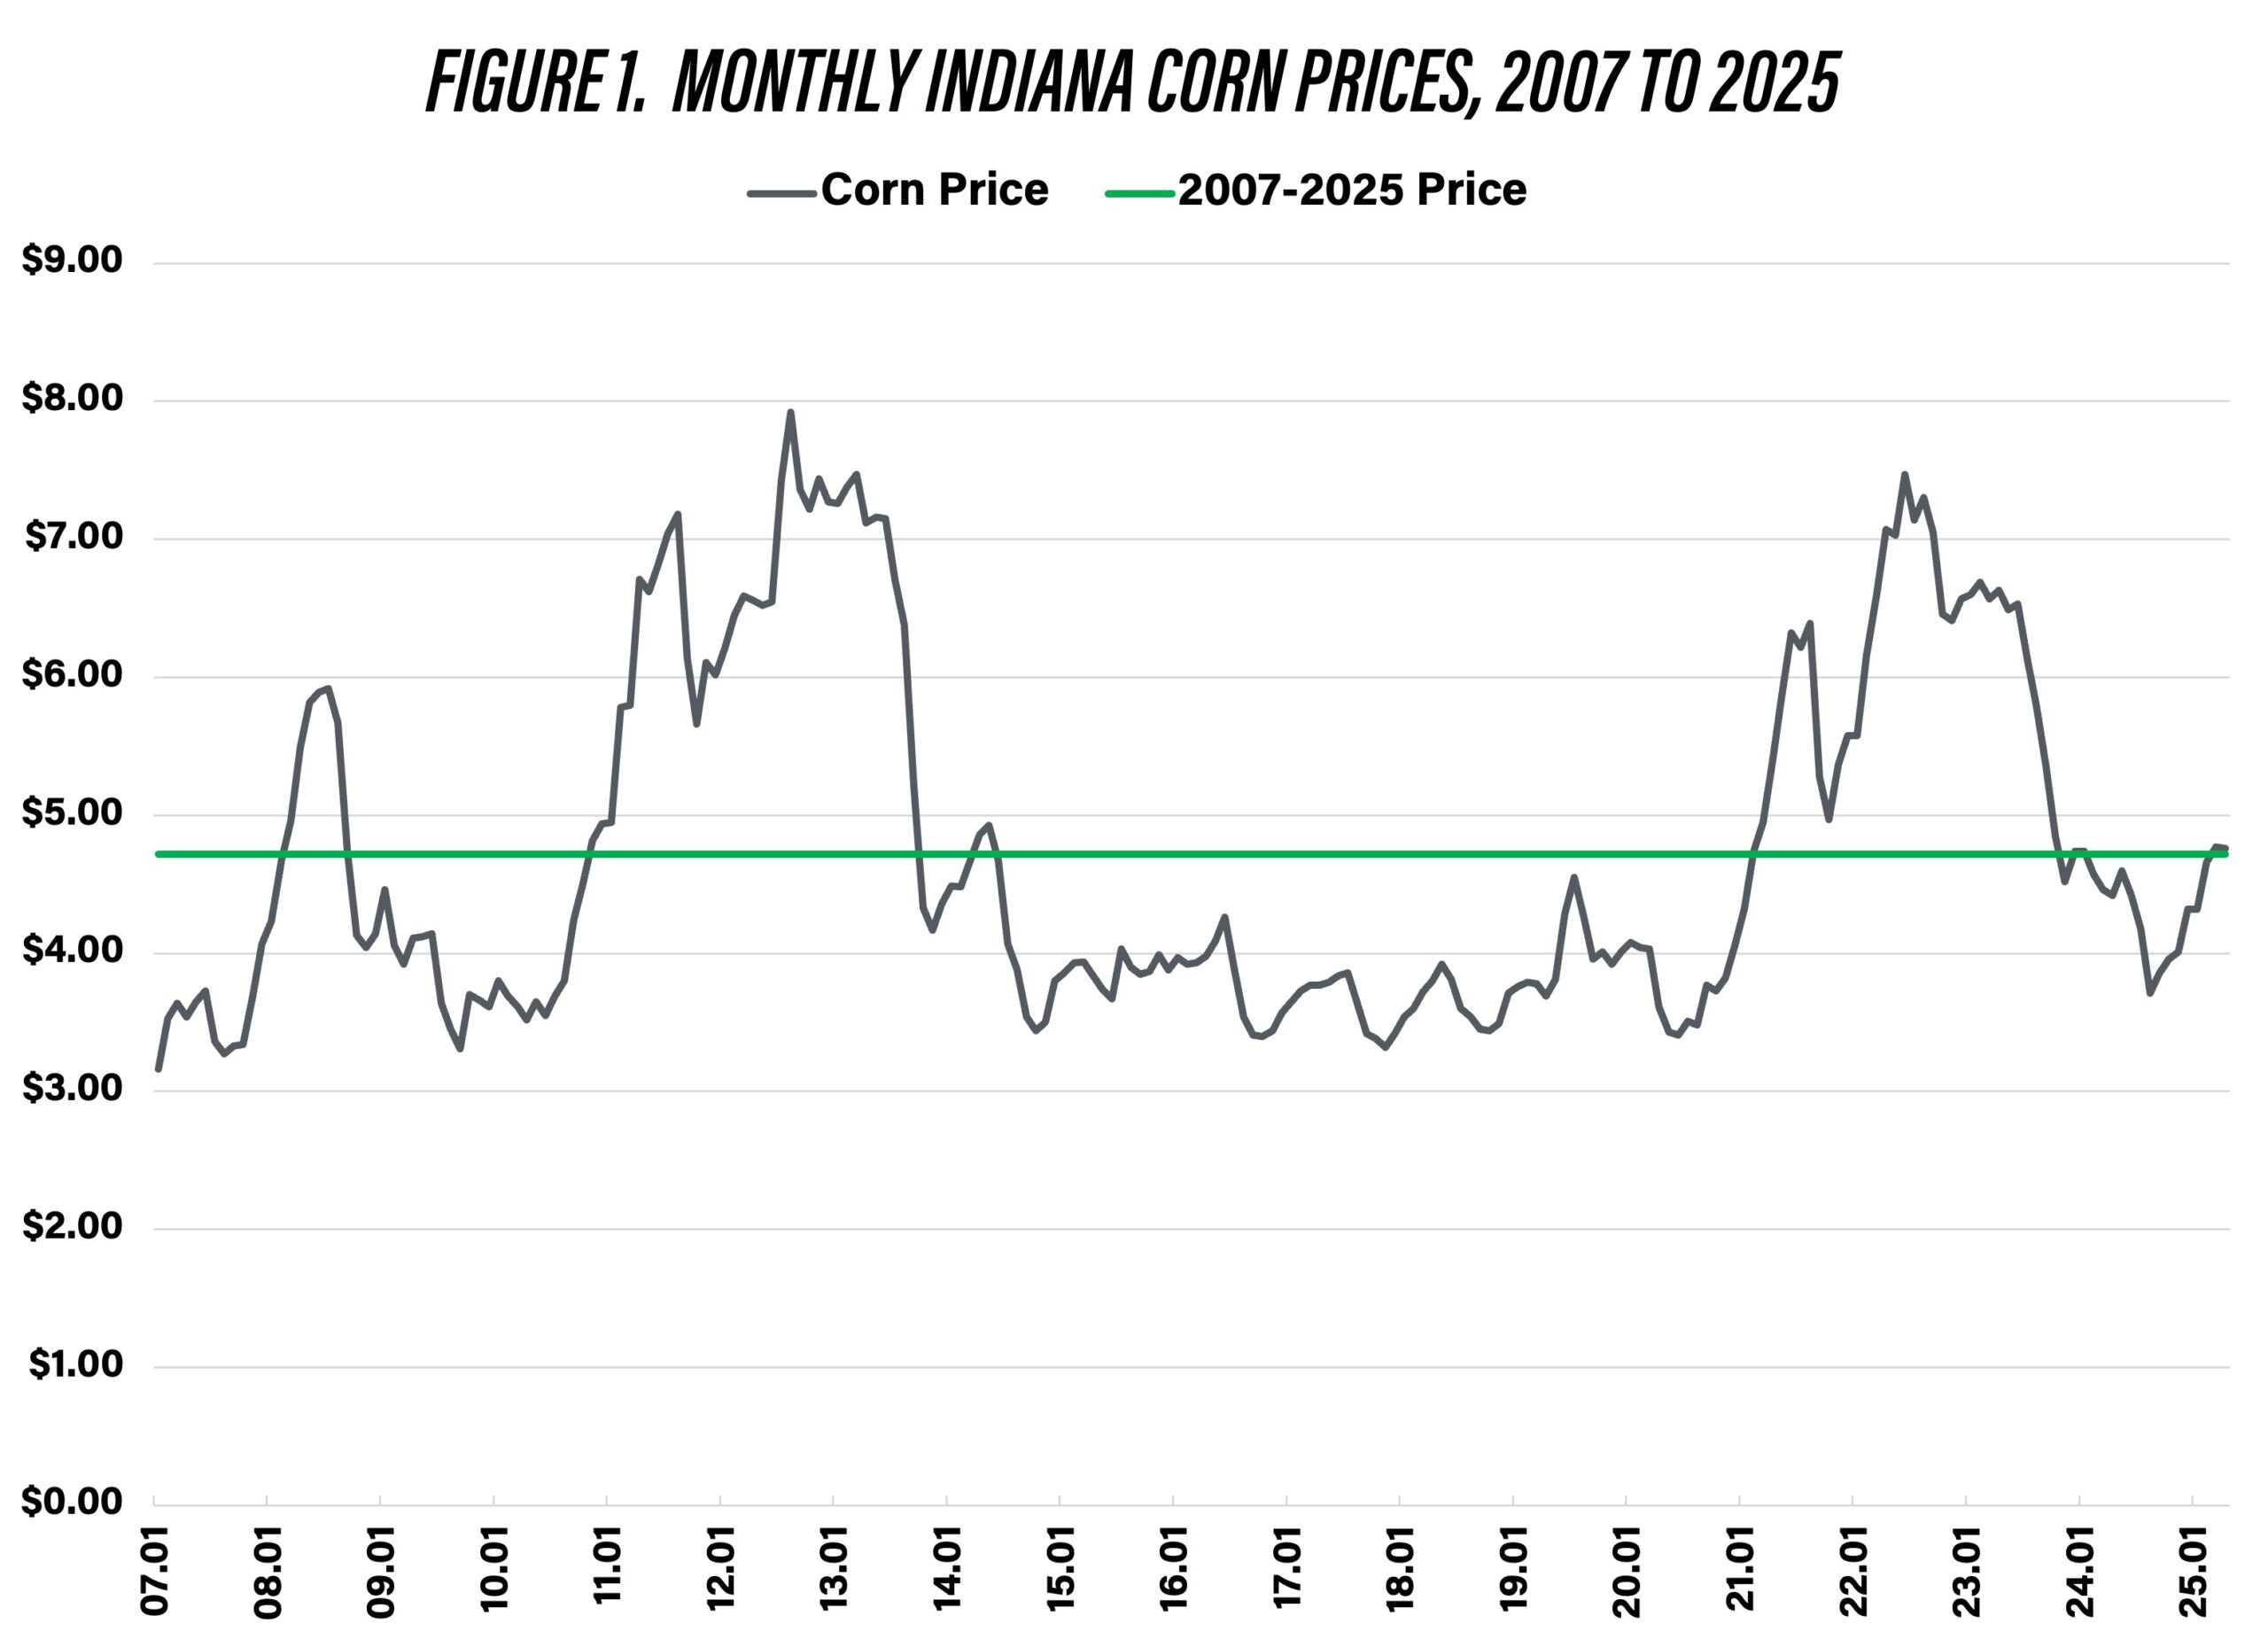
Figure 1. Monthly Indiana Corn Prices, 2007 to 2025
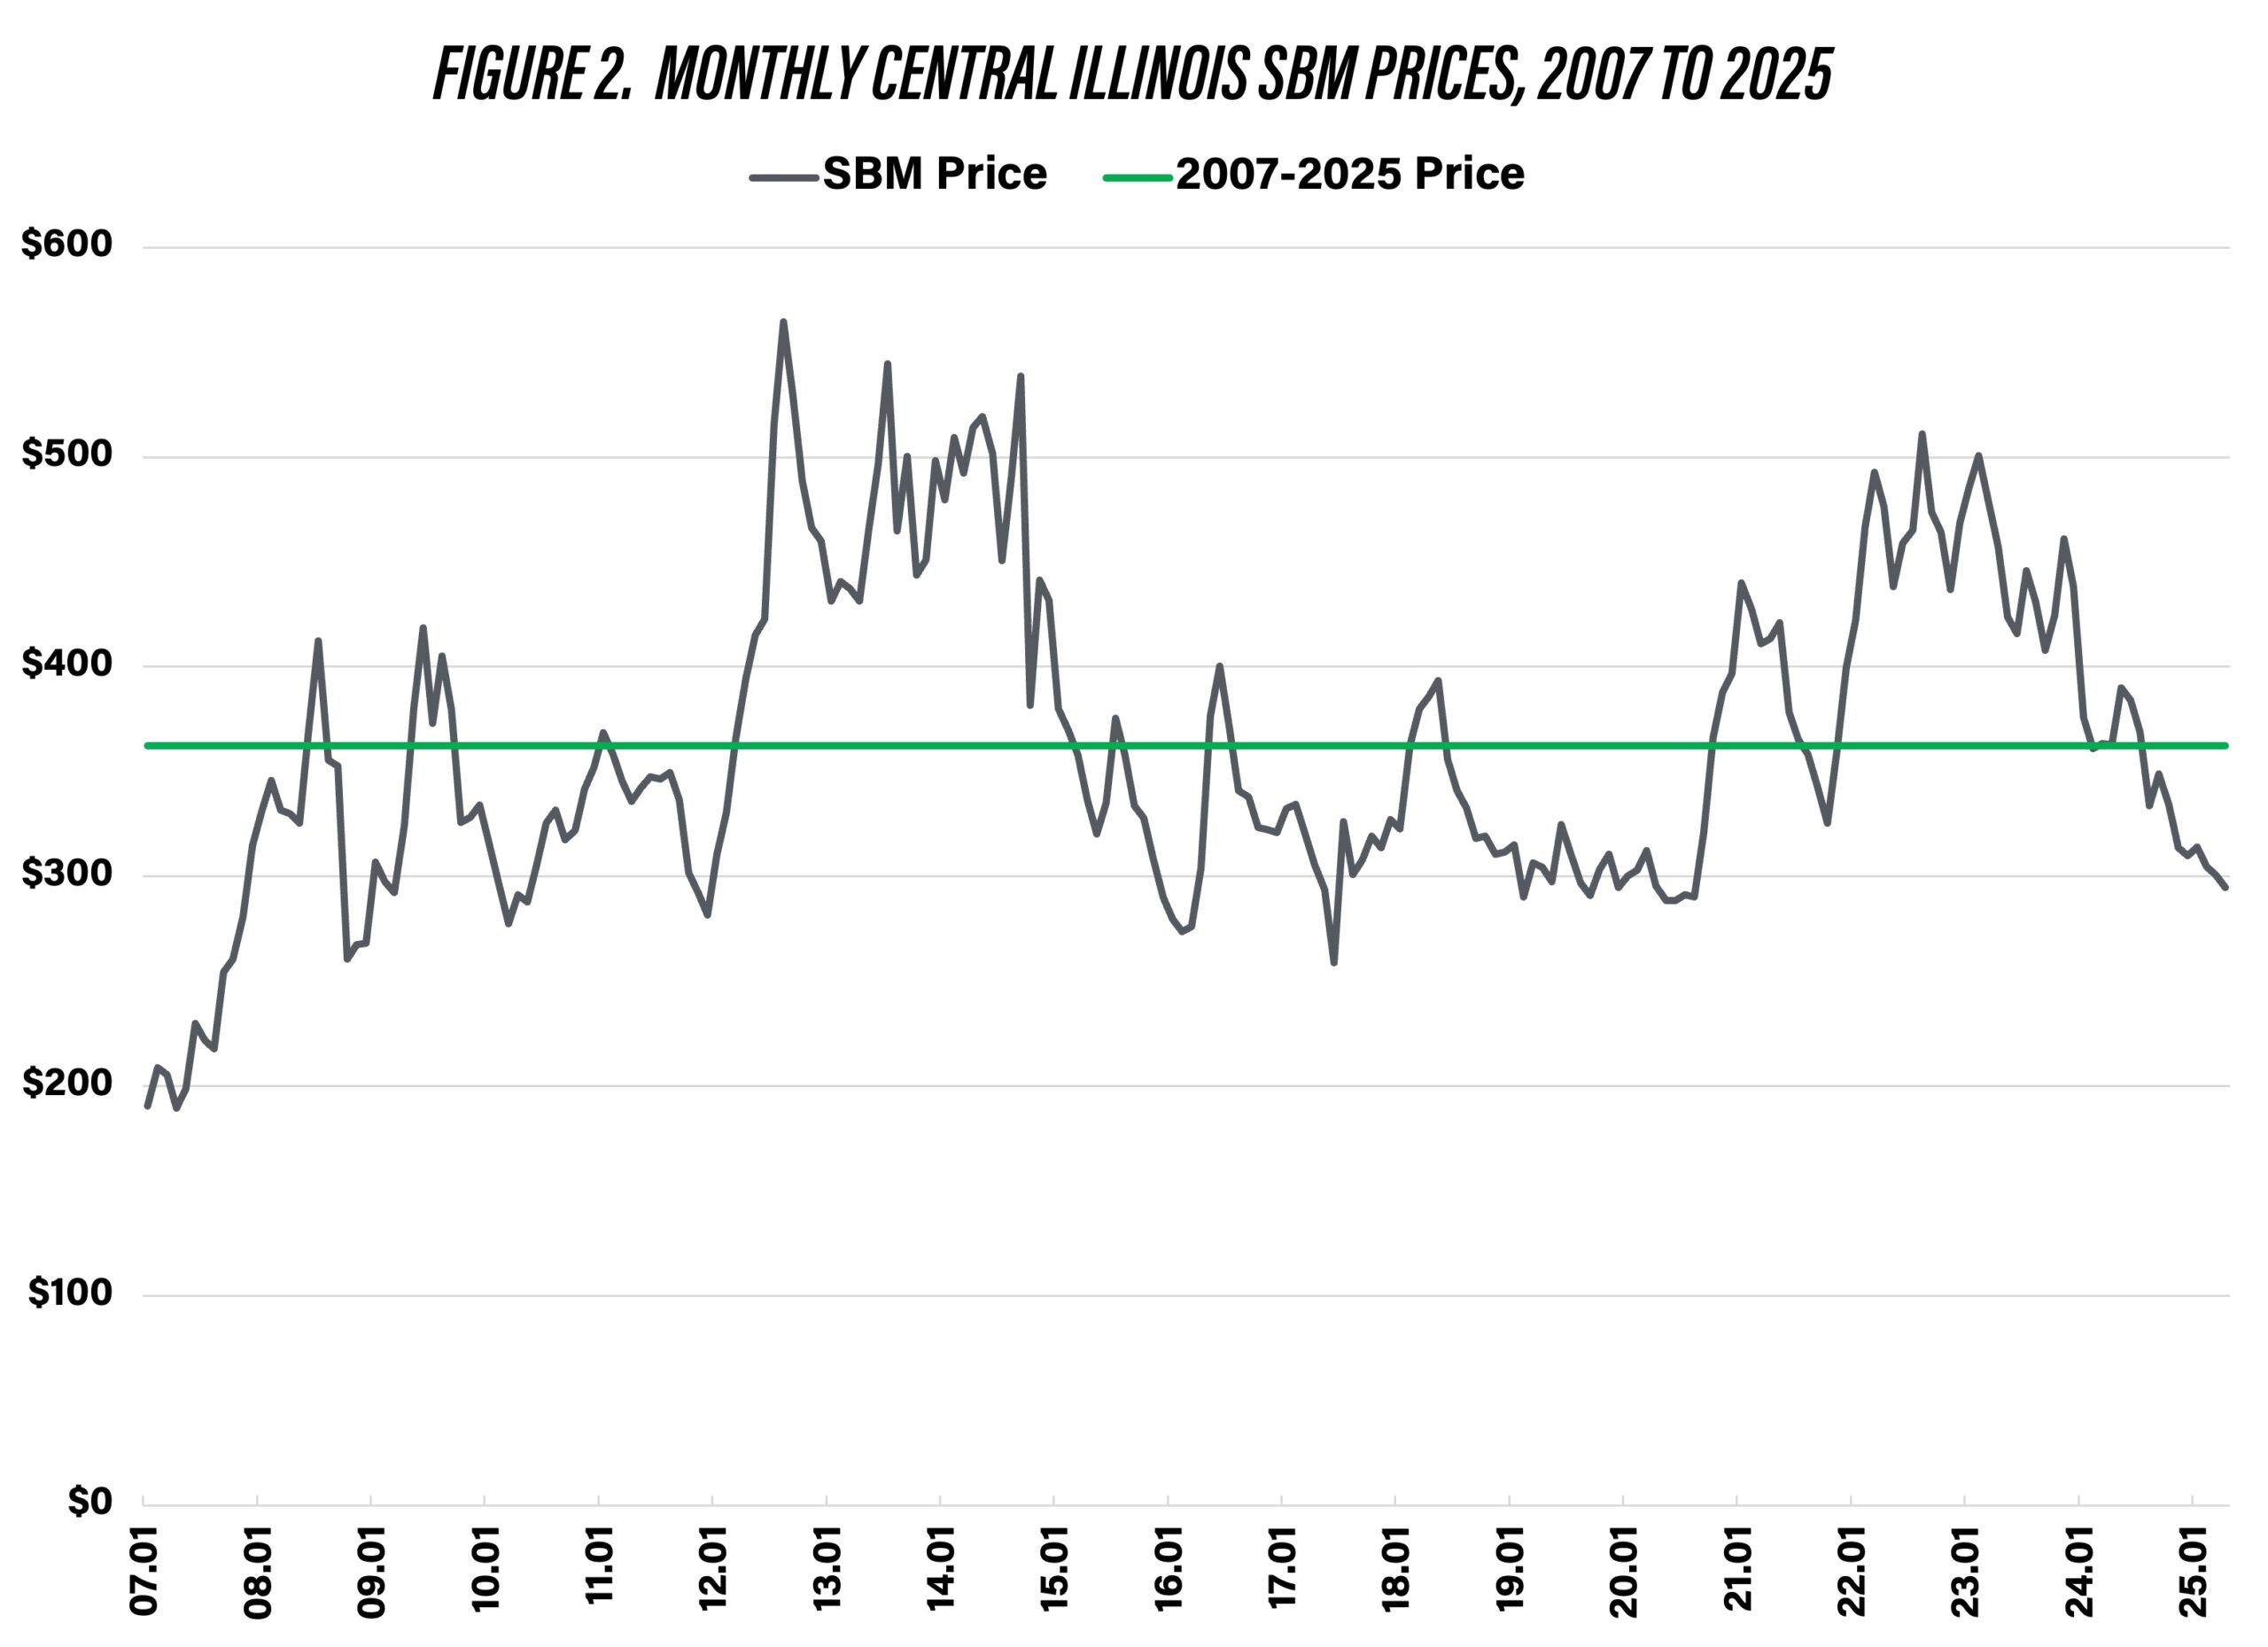
Figure 2. Monthly Central Illinois SBM Prices, 2007 to 2025
Farrow-to-Finish Enterprise
Figure 3 presents monthly farrow-to-finish feed cost indices from January 2007 to April 2025. The base year for the indices, 2024, has an index of 100 so all indices outside of this year are expressed in relative terms. The average feed cost index since 2007 is 97.7. The feed cost index for the first quarter of 2025 was 88.8. The feed cost index is projected to range from 90 to 94 for the rest of the year.
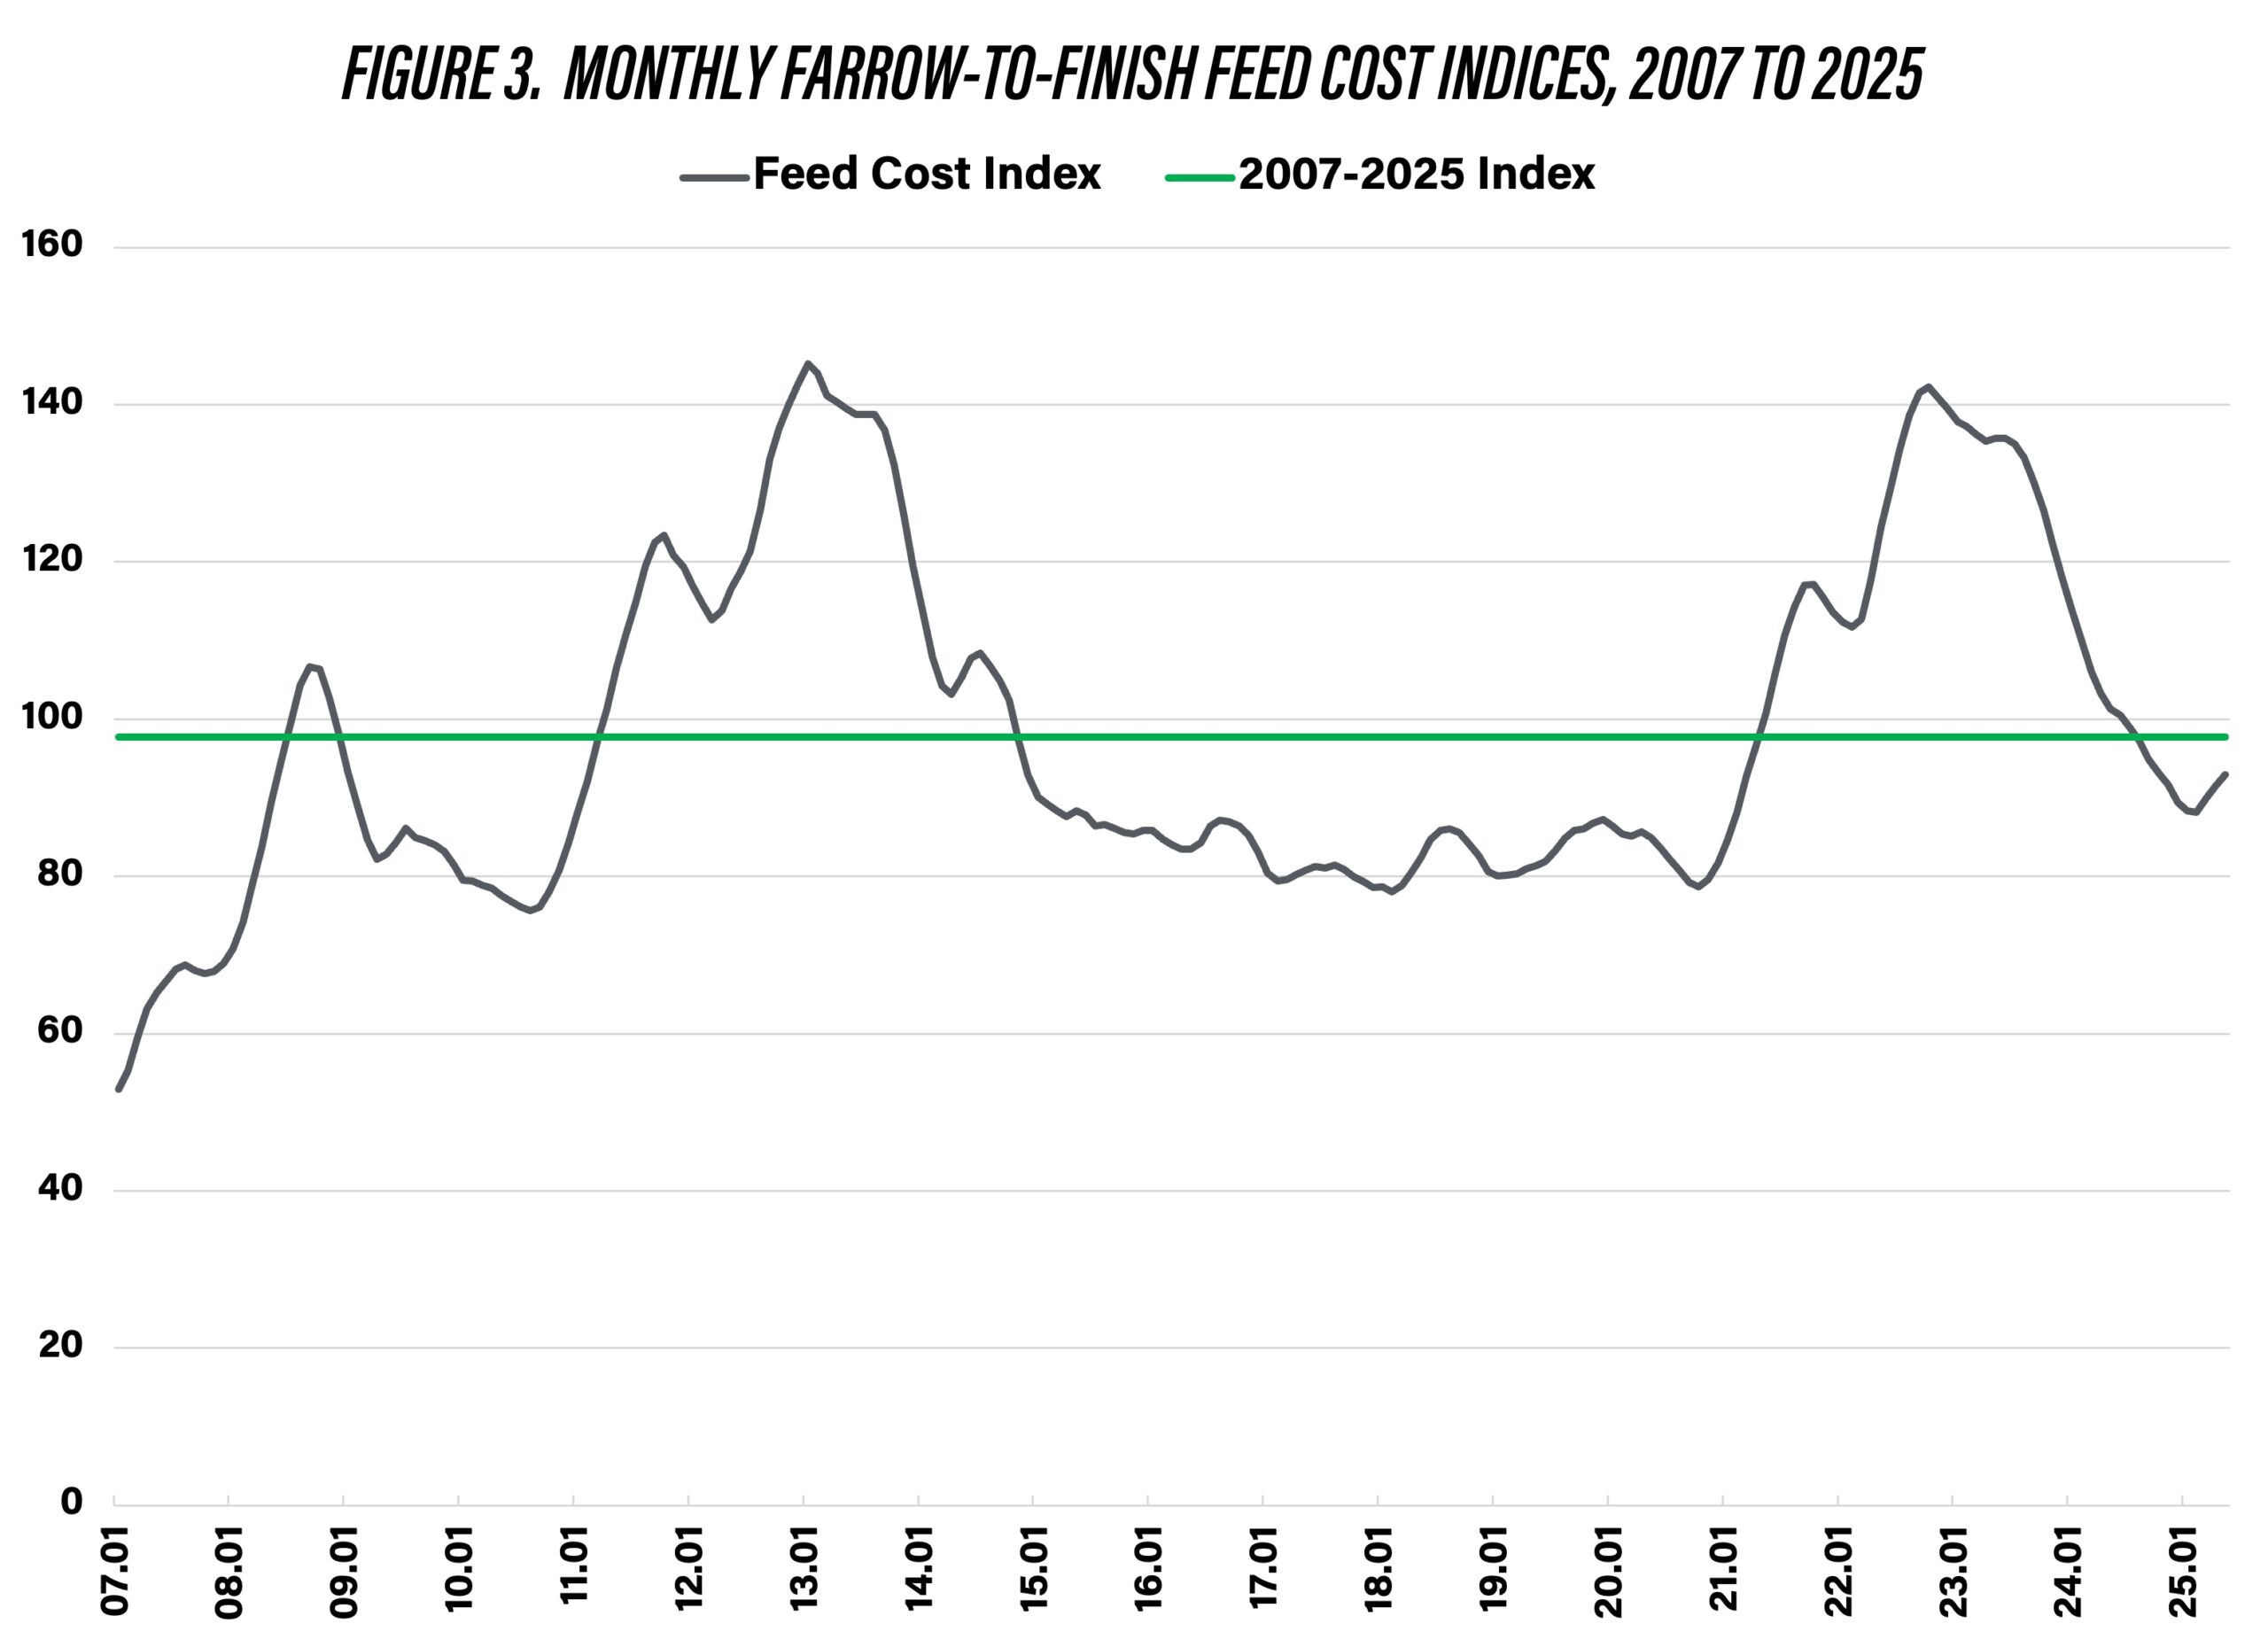
Figure 3. Monthly Farrow-to-Finish Feed Cost Indices, 2007 to 2025
Annual farrow-to-finish feed cost indices are presented in figure 4. The projection for 2025 used corn and soybean meal futures prices in early June. The projected feed cost index for 2025 is 92, which indicates that feed costs in 2025 are expected to be 8 percent lower than they were in 2024.
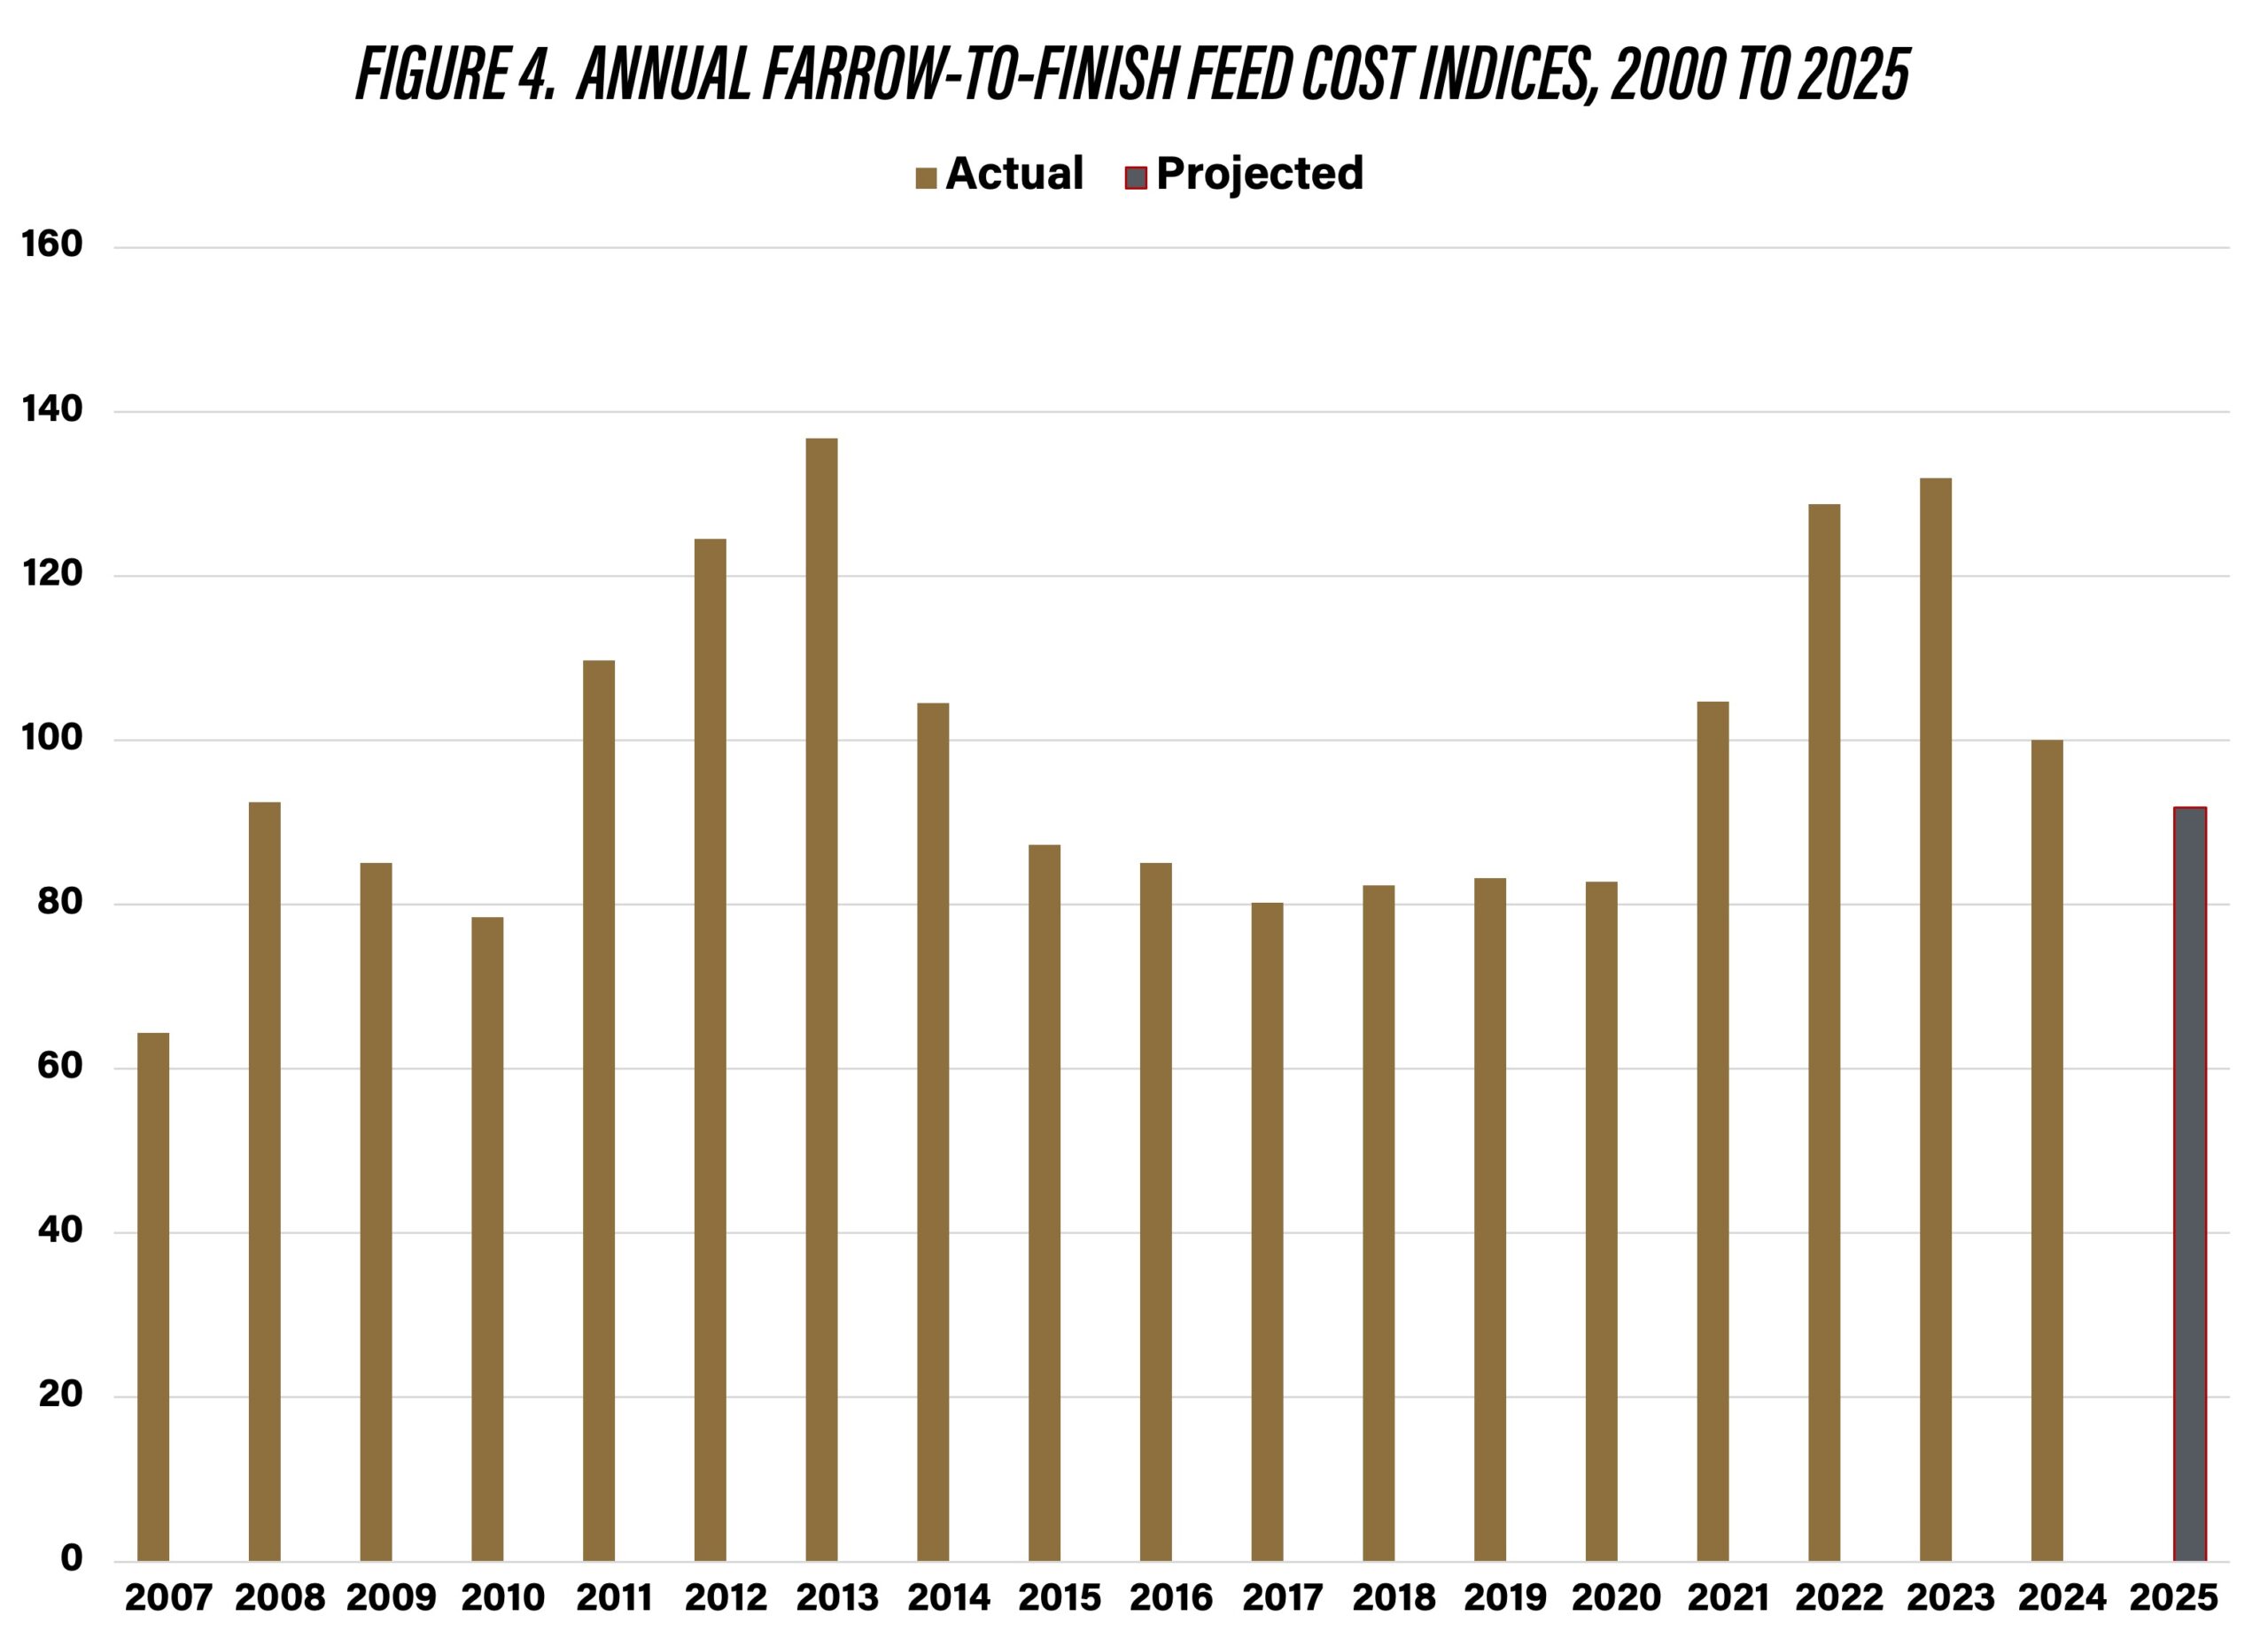
Figure 4. Annual Farrow-to-Finish Feed Cost Indices, 2000 to 2025
Swine Finishing Enterprise
Figure 5 illustrates monthly swine finishing feed cost indices for the January 2007 to April 2025 period. The base year, 2024, has an index of 100 so all indices outside of this year are expressed in relative terms. The average index for the period beginning in 2007 is 96.8. After averaging 90.4 in the first quarter of this year, the swine finishing feed cost indices are expected to range from 91 to 95 the rest of the year. Annual swine finishing feed cost indices are presented in figure 6. The projection for 2025 used corn and soybean meal futures prices in early June. The expected index for 2025 is 93, which if realized would be 7 percent below the average feed cost index in 2024.
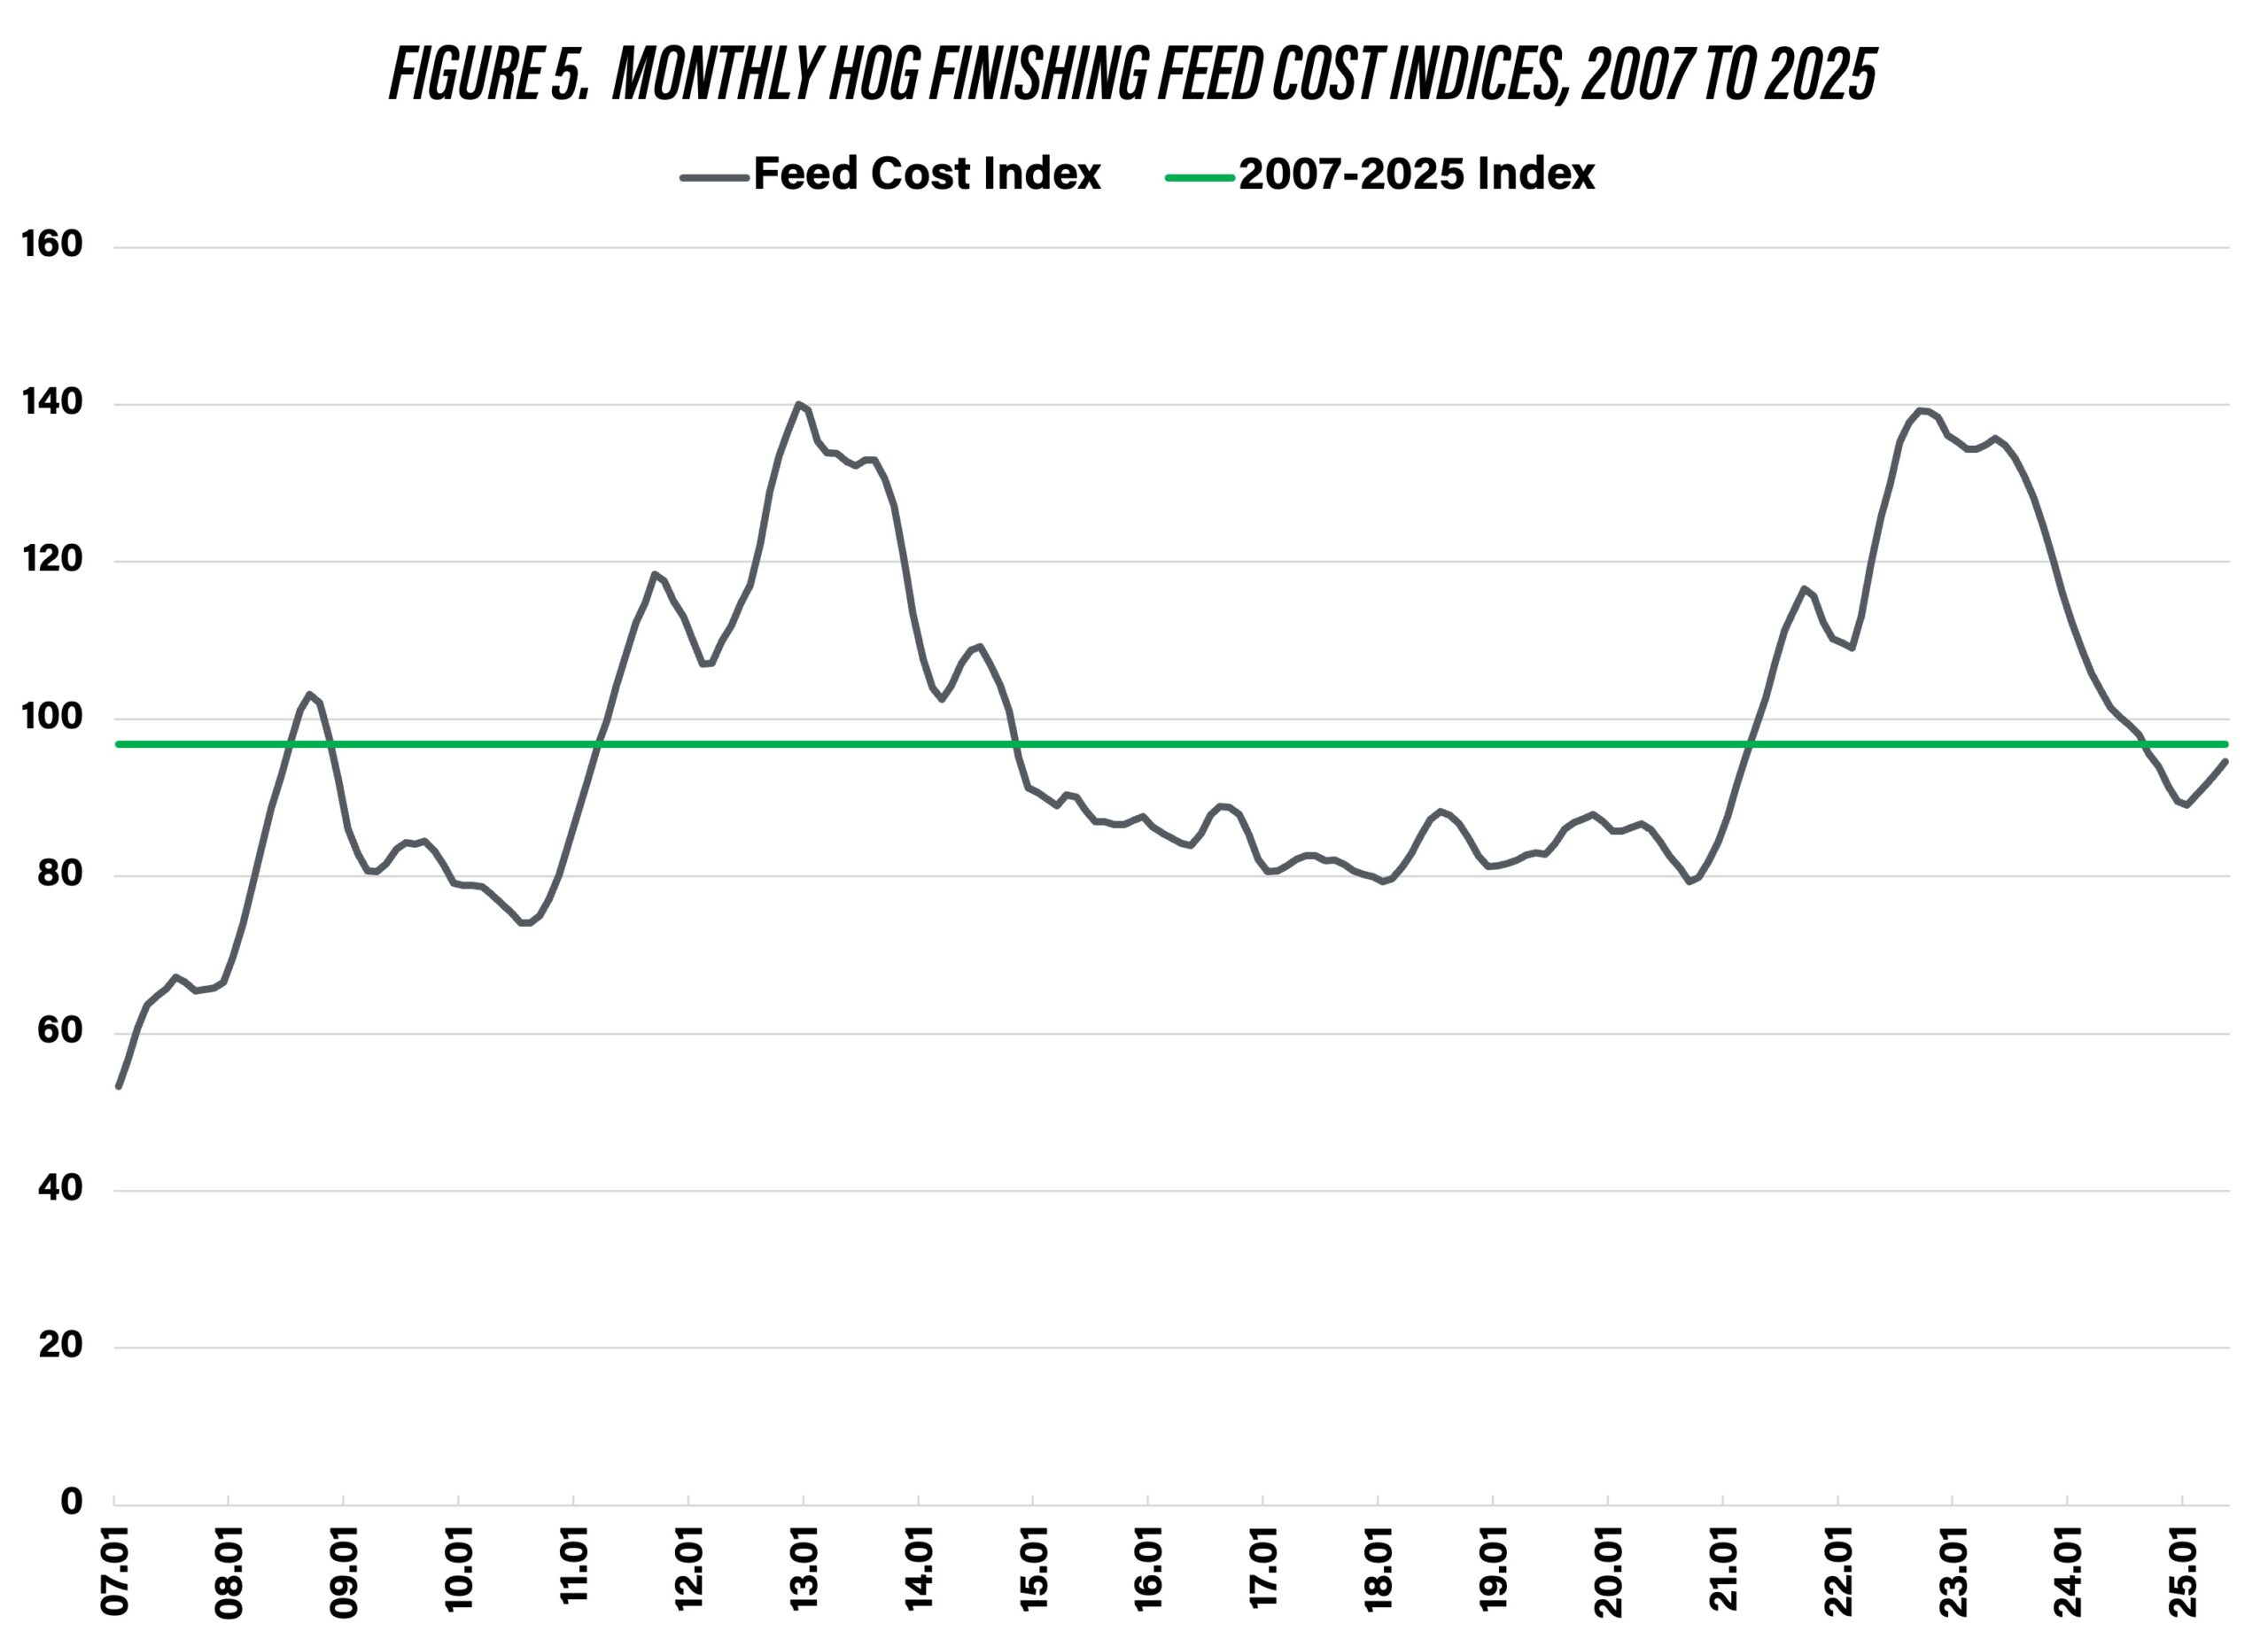
Figure 5. Monthly Hog Finishing Feed Cost Indices, 2007 to 2025
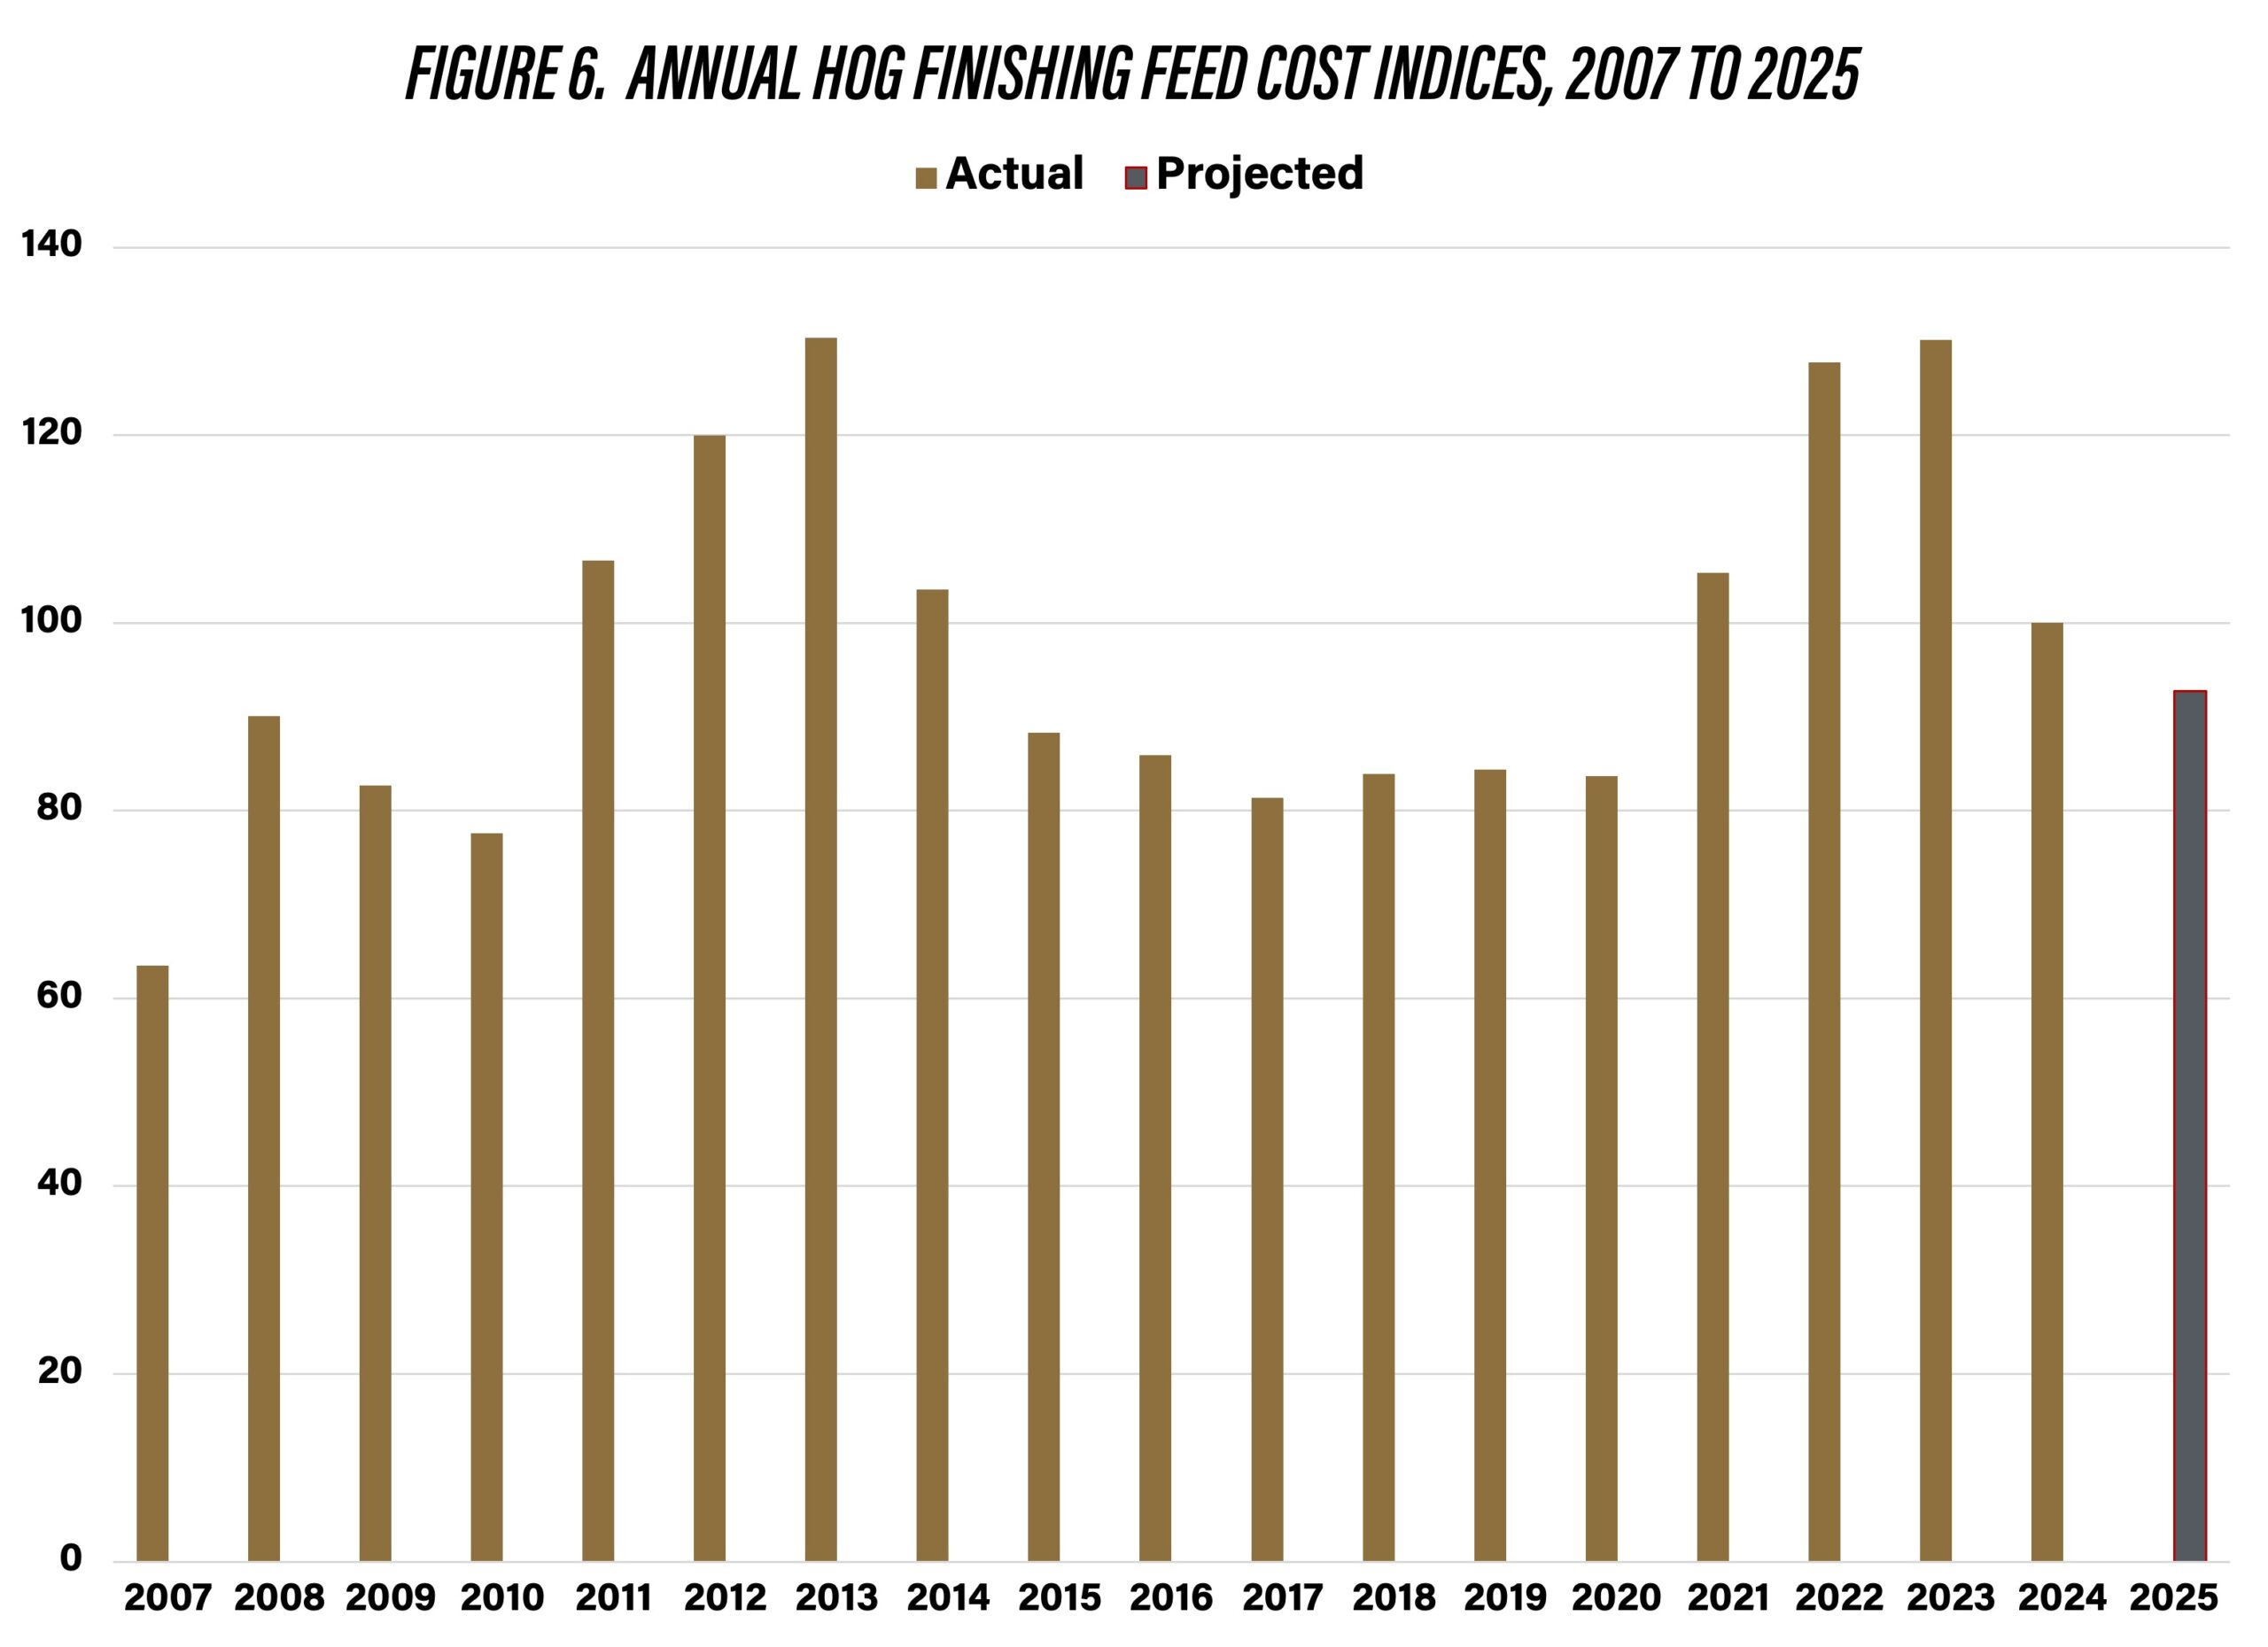
Figure 6. Annual Hog Finishing Feed Cost Indices, 2007 to 2025
Feed costs are sensitive to changes in corn and soybean meal prices. Regression analysis was used to examine the relationship between swine finishing feed cost, and corn and soybean meal prices during the January 2007 to December 2024 time period. Results are as follows: each 0.10 per bushel increase in corn prices increases feed cost per cwt. by $0.43, and each $10 per ton increase in soybean meal prices increases feed cost per cwt. by $0.38.
Current feed cost is approximately $36 per cwt. Table 1 presents feed cost per cwt. for a range of likely corn and soybean prices in the first and second quarters of next year. Corn prices range from $4.00 to $5.00 per bushel and soybean meal prices range from $250 to $350 in the table. At the lower range of prices, feed cost per cwt. would be approximately $29. At the higher range of prices, feed cost per cwt. would be approximately $37.
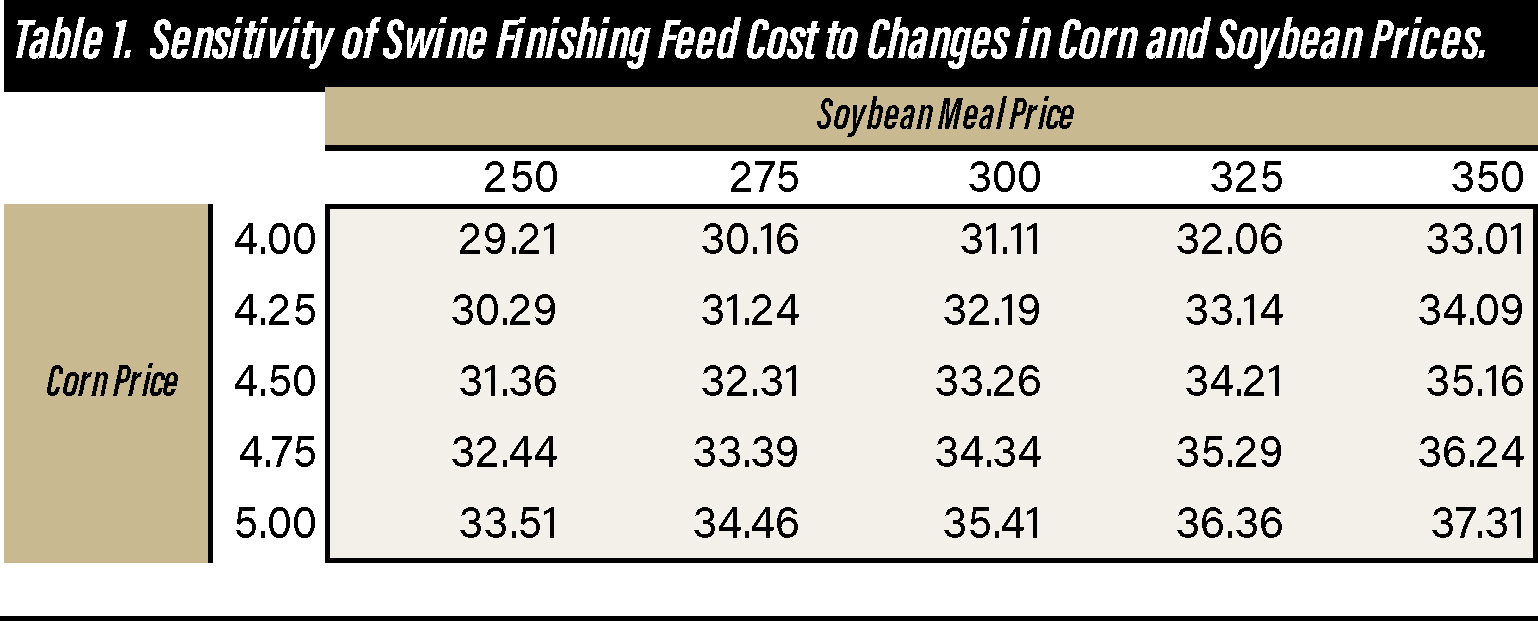
Table 1. Sensitivity of Swine Finishing Feed Cost to Changes in Corn and Soybean Prices.
Conclusions
This article discussed recent trends in feed costs for farrow-to-finish and swine finishing enterprises, and provided projections for the second half of 2025. Average feed costs in 2024 were substantially lower than feed costs in 2022 and 2023. Moreover, a further reduction in feed costs is expected for the upcoming year. Current projections use corn prices ranging from $4.25 to $4.50 per bushel, and soybean meal prices ranging from $275 to $325 per ton. Corn and soybean prices will be impacted by weather conditions around the world as well as other supply and demand factors. Given the volatility of feed ingredient prices, this article also examined the impact of changes in corn and soybean meal prices on swine finishing feed cost. Each $0.10 per bushel change in corn price, changes feed cost by $0.43 per cwt. Similarly, each $10 per ton change in soybean meal price, changes feed cost by $0.38 per cwt.
References
USDA-NASS. Quick Stats, accessed on June 3, 2025.
![]()
![]()
![]()
![]()
![]()
TAGS:
TEAM LINKS:

RELATED RESOURCES
U.S. farm income in 2026 appears stable, but increased government payments are masking weaker livestock receipts and rising costs. Indiana faces a sharper decline, with net farm income projected to fall 28%, highlighting tighter margins and growing financial pressure heading into 2027.
READ MOREUPCOMING EVENTS
We are taking a short break, but please plan to join us at one of our future programs that is a little farther in the future.