June 19, 2026
June Crop Basis Update: Region-Wide Strengthening Continues
by Josh Strine
![]()
![]()
![]()
![]()
![]()
Over the past four weeks, corn and soybean basis strengthened broadly across the Eastern Corn Belt. Corn basis to July futures increased in 38 of 40 tracked crop reporting districts, while soybean basis increased or held steady in all tracked districts. The increase in corn basis deviated from the historically observed trend of basis weakening between May and June in Ohio, Indiana, Illinois, and Iowa. Ohio and Indiana continue to set the benchmark in the region with the highest corn and soybean basis levels. While Iowa continues to have the weakest basis in the region, the state saw some of the largest monthly gains in soybean basis, and the basis is now above the historical average in several parts of the state.
Corn Basis Trends
Corn basis to July futures strengthened broadly between the third week of May and the third week of June. Of the 40 crop reporting districts tracked by the Crop Basis Tool, only two saw basis weaken over this period. South-Central Ohio fell $0.05/bu, and Central Michigan fell $0.01/bu. The greatest strengthening occurred in East-Central Ohio, where basis increased $0.21/bu to $0.13/bu above July futures (Figure 1). The $0.13/bu basis is the highest in the district at this time of year since the 2012-13 crop year. Northeast Indiana also had a strong basis increase of $0.14/bu to $0.07/bu above July futures and $0.10/bu above the three-year historical average (Figure 2).
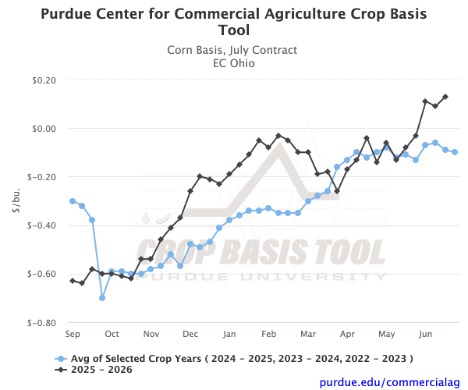
Figure 1. Corn Basis, July Contract for East Central Ohio
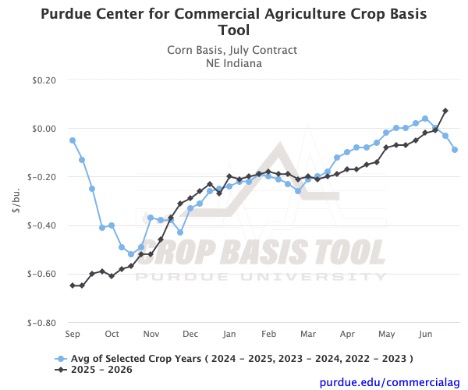
Figure 2. Corn Basis, July Contract for North Eastern Indiana
The Eastern states continue to have the strongest basis in the region. In Ohio, corn basis is $0.21/bu to $0.27/bu above the three-year historical average across all tracked districts (Figure 3). Indiana is also broadly above historical norms, with most districts $0.03/bu to $0.13/bu above their averages. Several districts in Ohio and Indiana carry positive corn basis. In Iowa, the picture is the opposite, with districts ranging from $0.19/bu to $0.37/bu below the three-year average. However, recent increases in Iowa basis have narrowed the gap relative to the historical average from last month, when it ranged from $0.29/bu to $0.57/bu.
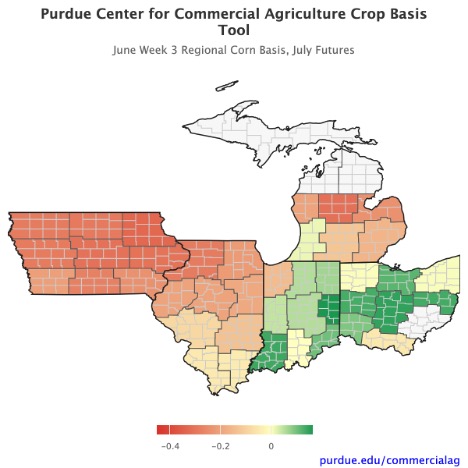
Figure 3. June Week 3 Regional Corn Basis, July Futures
Soybean Basis Trends
Soybean basis to July futures increased or held steady in all tracked crop reporting districts over the past four weeks. This is the first month of the marketing year with no weakening anywhere in the region. Iowa saw by far the largest monthly moves, though basis levels there remain the lowest in the region. In Central Iowa, soybean basis increased by $0.28/bu over the four-week period to -$0.41/bu (Figure 4). The district’s basis is now $0.09/bu above the two-year historical average. For many parts of the state, this is the first time soybean basis has been above the two-year average this year. More moderate strengthening can be found across the rest of the region as well. For example, in West-Central Indiana, basis increased $0.07/bu to negative $0.02/bu, $0.22/bu above the two-year historical average (Figure 5).
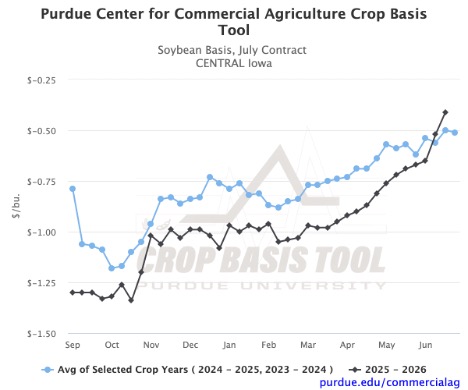
Figure 4. Soybean Basis, July Contract for Central Iowa
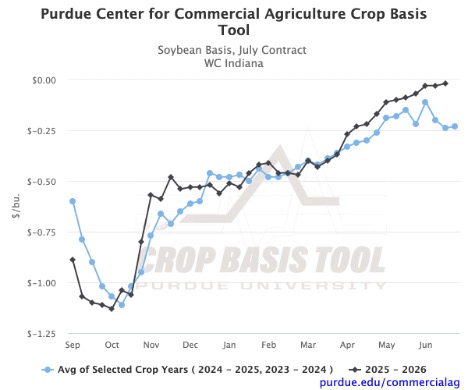
Figure 5. Soybean Basis, July Contract for West Central Indiana
Looking at the current basis across the region, Indiana has the strongest soybean basis relative to July futures (Figure 6). In Southwest Indiana, soybean basis is positive $0.09/bu, $0.10/bu above the historical average. Soybean processor bids also reflect this strength with a statewide average basis of $0.32/bu, $0.25/bu above the historical average. The Ohio River soybean basis is also elevated at $0.19/bu, $0.08/bu above the two-year historical average. Compared with district-level historical averages, Michigan has the strongest soybean basis in the region. Southeast Michigan basis stands $0.33/bu above the two-year average, and West-Central Michigan is $0.30/bu above average.
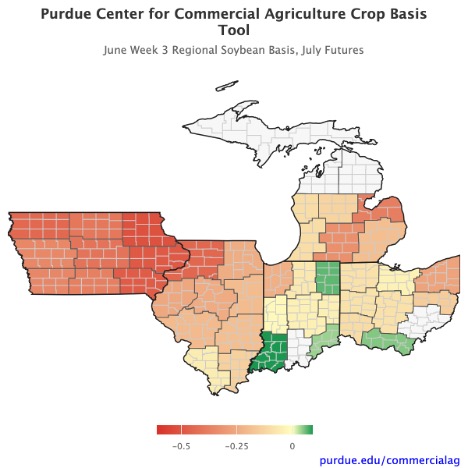
Figure 6. June Week 3 Regional Soybean Basis, July Futures
Looking Ahead
Turning our focus to September futures for corn and August futures for soybeans, historical trends suggest continued strengthening for both corn and soybean basis through the third week of July. Corn gains typically range from $0.01/bu to $0.13/bu over the next month. However, a handful of districts in Michigan and Northwest Indiana show flat to slightly negative historical trends. Soybean gains typically range from $0.03/bu to $0.16/bu across most of the region. For any remaining open marketing positions relative to July futures, historical trends suggest weakening in both corn and soybean basis over the next week. As always, it is important to monitor local basis conditions week to week, as monthly trends can mask meaningful short-term volatility. You can visit the Purdue Center for Commercial Agriculture’s Crop Basis Tool to track local basis conditions.
![]()
![]()
![]()
![]()
![]()
TAGS:
TEAM LINKS:

RELATED RESOURCES
UPCOMING EVENTS
We are taking a short break, but please plan to join us at one of our future programs that is a little farther in the future.