Trends in Farmland Price to Rent Ratios in Indiana (2026)
August 17, 2026
PAER-2026-25
Michael Langemeier, Director, Center for Commercial Agriculture & Professor of Agricultural Economics


Farmland prices in west central Indiana increased 6.0% in 2026 and are now 29.6% above the previous peak in 2014. Compared to the farmland price in 2007, current farmland prices in west central Indiana are 211% higher. Farmland prices are influenced by many factors, including net income, the growth in earnings, crop and livestock prices, interest rates, alternative investment returns, inflation, liquidity, agricultural policy, and land conversion. Cash rent, which is influenced by net return to land, along with interest rates, are often referred to as fundamental factors impacting farmland prices. Concerns are periodically expressed by many investment analysts that farmland prices are higher than justified by the fundamentals. One justification for this concern is that previous research has established the tendency of the farmland market to over-shoot its fundamental value.
A standard measure of financial performance used for stocks is the price-to-earnings ratio (P/E). A high P/E ratio sometimes indicates that investors think an investment has good growth opportunities, relatively safe earnings, a low capitalization rate, or a combination of these factors. However, a high P/E ratio may also indicate that an investment is less attractive because the price has already been bid up to reflect these positive attributes.
This paper computes a ratio equivalent to the P/E ratio for farmland, the farmland price-to-cash-rent ratio (P/rent), and discusses trends in the P/rent ratio. We use land value and cash rent data for the 1960 to 2026 period for west central Indiana to illustrate the P/rent ratio. Data from 1975 to 2026 were obtained from the annual Purdue Land Value and Cash Rent Survey. For 1960 to 1974, the 1975 Purdue survey numbers were indexed backward using the percentage change in USDA farmland value and cash rent data for the state of Indiana.
Price-to-Rent Ratio
The P/rent ratio for west central Indiana averaged 21.4 over the 66-year period from 1960 to 2026 (Figure 1). The peak P/rent ratio before 1990 occurred during the 1977 to 1979 period. The P/rent ratio dropped substantially from 1980 to 1986, reaching a low of 11.1 in 1986. The rise from around 15 in 1976 into the 20s and down to 11.1 in 1986 corresponds to what is viewed as the bubble in farmland prices that was followed by one of the most difficult periods in history for production agriculture (i.e., the early-to-mid 1980s).
Figure 1
Farmland Price to Cash Rent Multiple for West Central Indiana, 1960 to 2026
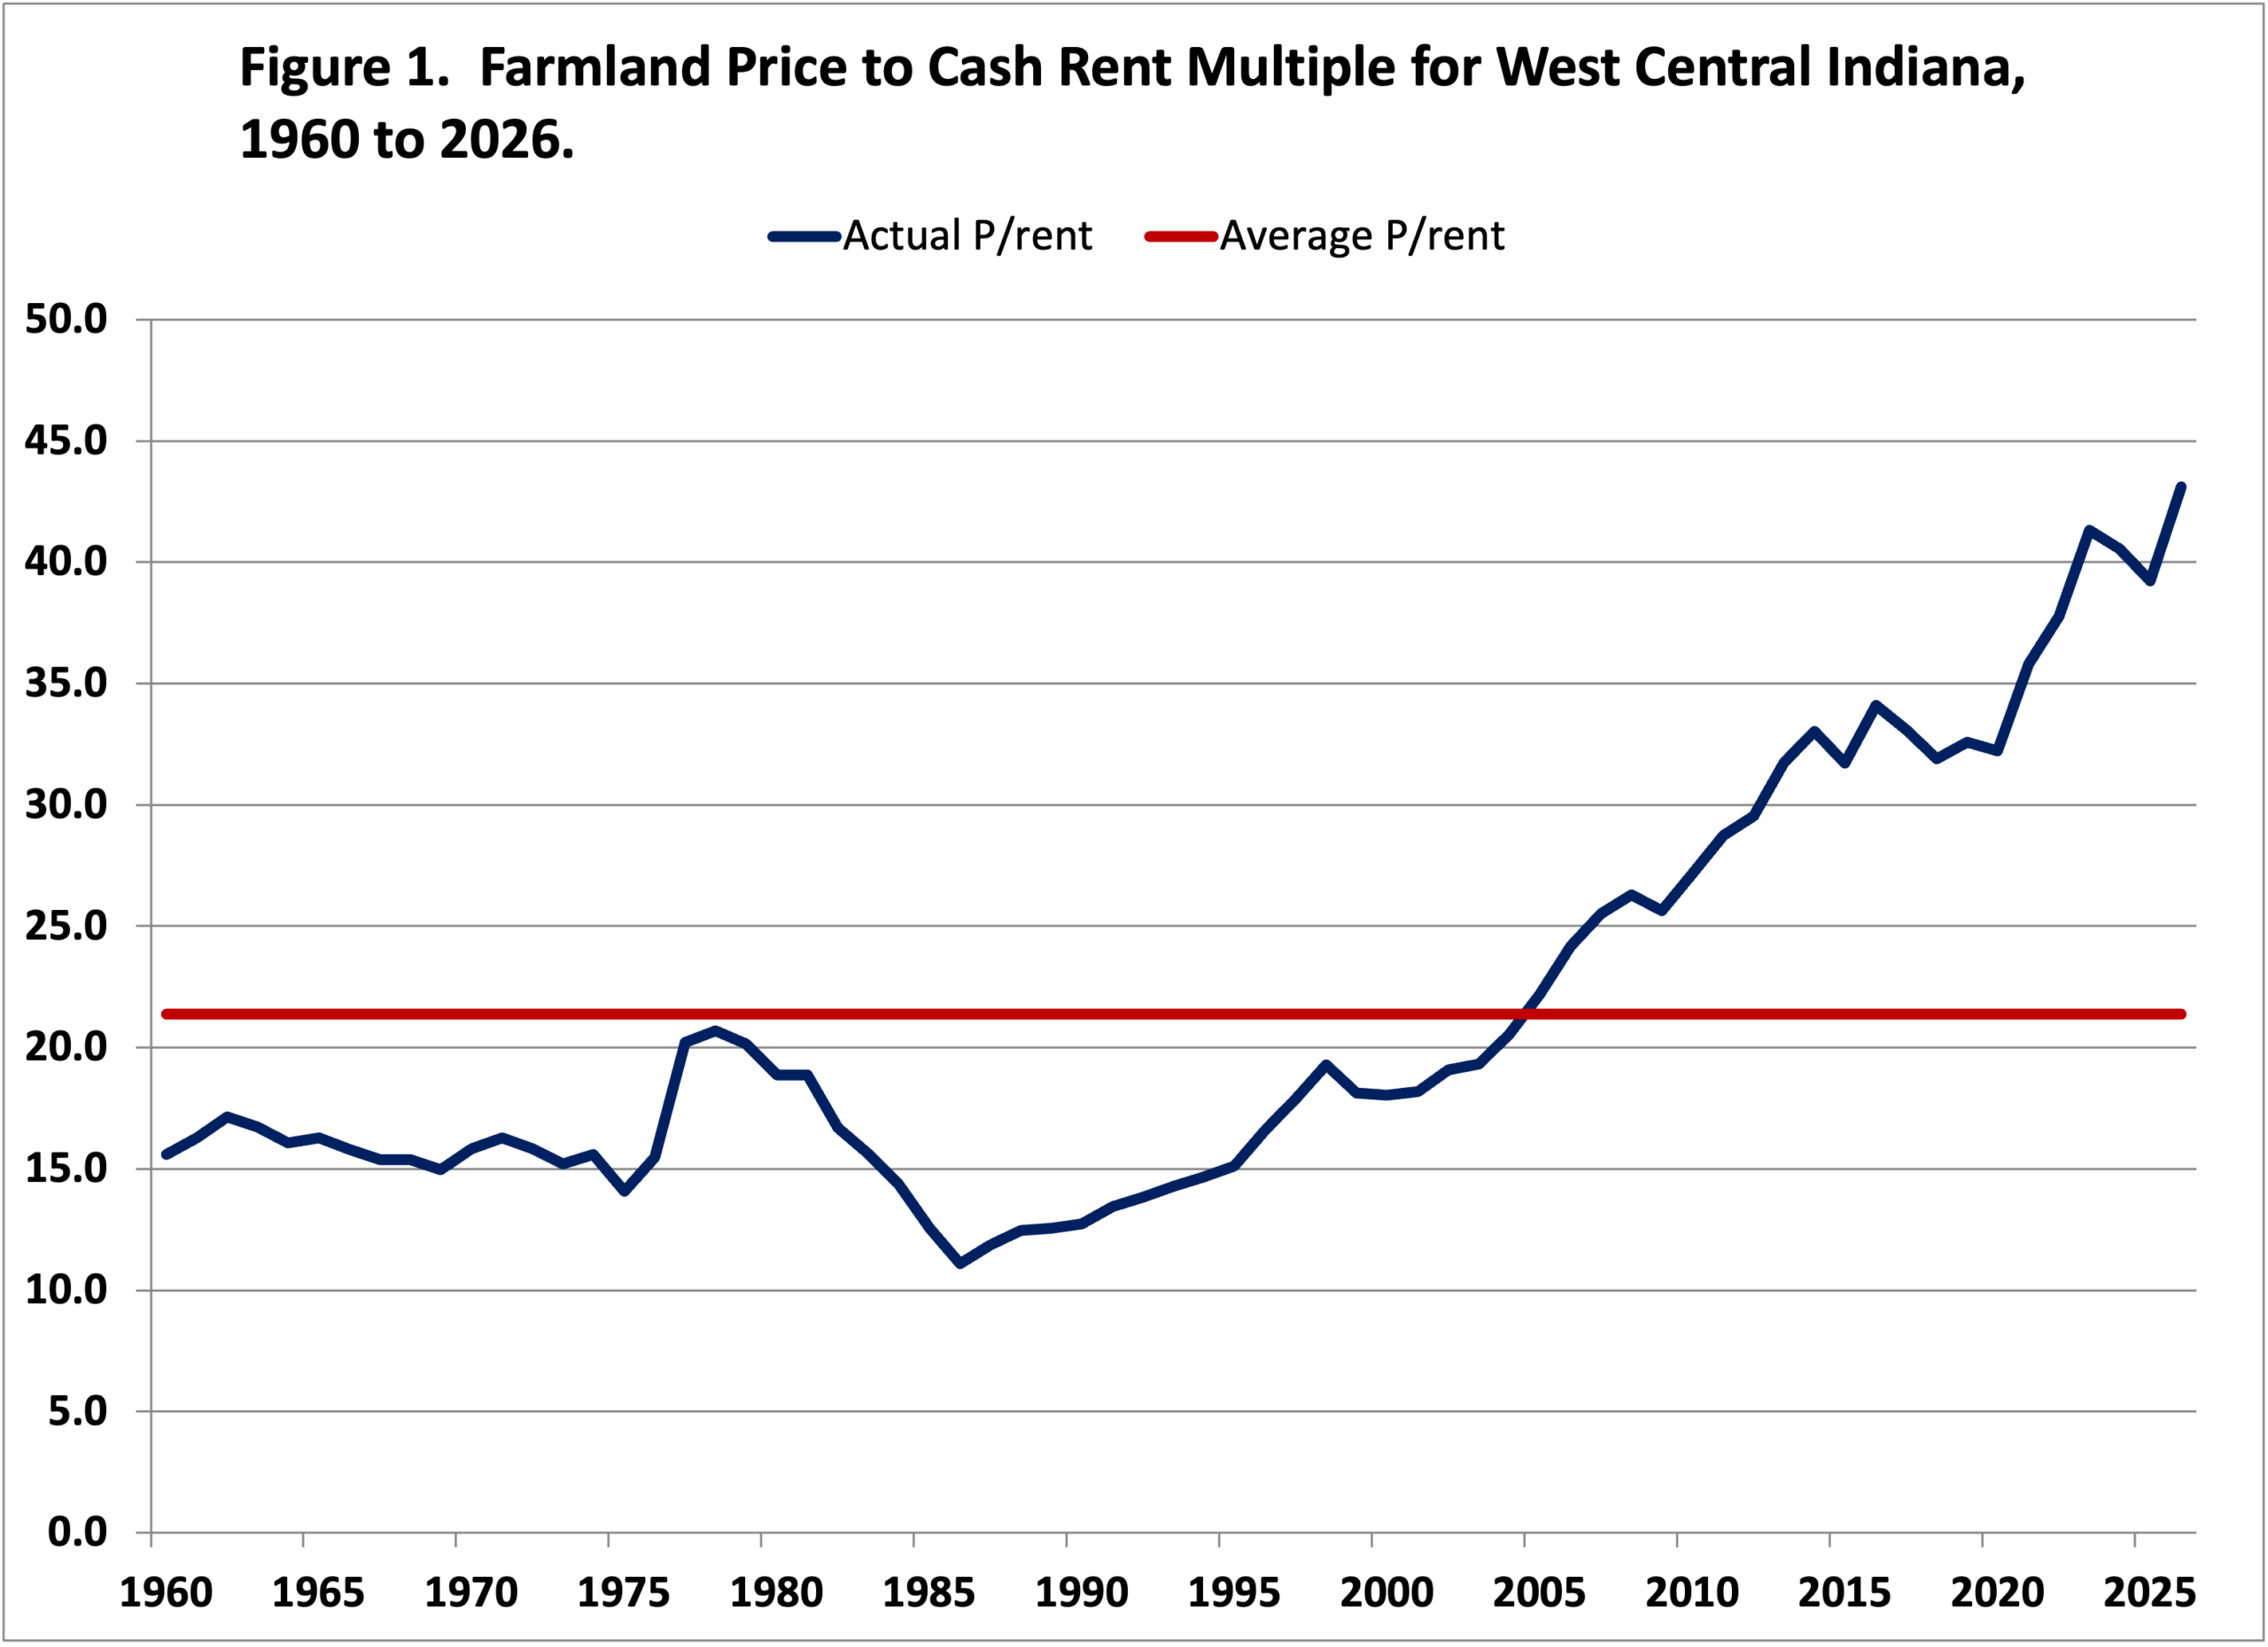
The P/rent ratio has been above the long-run average since 2004. From 2004 to 2014, the P/rent ratio increased from 20.6 to 33.0. Since 2014, the P/rent ratio has ranged from 31.7 in 2015 to 43.1 in 2026. The current value of 43.1 is substantially higher than the historic average of 21.4, and thus at least raises concerns that current farmland prices are overvalued in relation to returns. Having said that, one of the reasons often mentioned as a major explanatory factor associated with the recently high P/rent ratio is low interest rates. The average interest rate on 10-year treasuries from 1960 to 2026 was 5.9%. The interest rate on 10-year treasuries has been below its long-run average since 2001. However, after averaging less than 1.0% in 2020, the 10-year Treasury rate has been increasing. The average annual rate has been above 4% since 2024.
Over the 66-year period from 1960 to 2026, the P/E ratio for stocks is 20.4, which is similar to the long-run average P/rent ratio. Though the long-run averages are similar, the P/E and P/rent ratios do not necessarily track one another. The average correlation coefficient between these two measures is only 0.33. Though not the topic of this paper, diversification potential between the stock market and farmland is relatively high.
Cyclically Adjusted P/Rent
Shiller (2005; 2026) uses a 10-year moving average for earnings in the P/E ratio, often labeled either P/E10 or cyclically adjusted P/E (CAPE), to remove the effect of the economic cycle on the P/E ratio. When earnings collapse in recessions, stock prices often do not fall as much as earnings, and P/E ratios based on low current earnings can sometimes become very large. Similarly, in good economic times, P/E ratios can fall, and stocks can look cheap, simply because the very high current earnings are not expected to last, so stock prices do not increase as much as earnings. By using a 10-year moving average of earnings in the denominator of the P/E ratio, Shiller has smoothed out the business cycle by deflating both earnings and prices to remove the effects of inflation. Shiller also uses the P/E10 to gain insight into future rates of return. That is, if an investor buys an asset when its P/E10 is high, do subsequent returns from that investment turn out to be low, and vice versa?
The P/rent ratios reported thus far are the current year’s farmland price divided by the current year’s cash rent. Here, we model our P/rent10 after Shiller’s cyclically adjusted P/E ratio. Cash rent and farmland prices are deflated, and the 10-year moving averages of real cash rent are calculated. The P/rent10 ratio is computed by dividing the real farmland price by the 10-year moving average real cash rent. A similar computation is done for operator net returns (P/NR-10). We also compute a P/rent5 ratio by dividing real farmland price by a 5-year moving average of real cash rent.
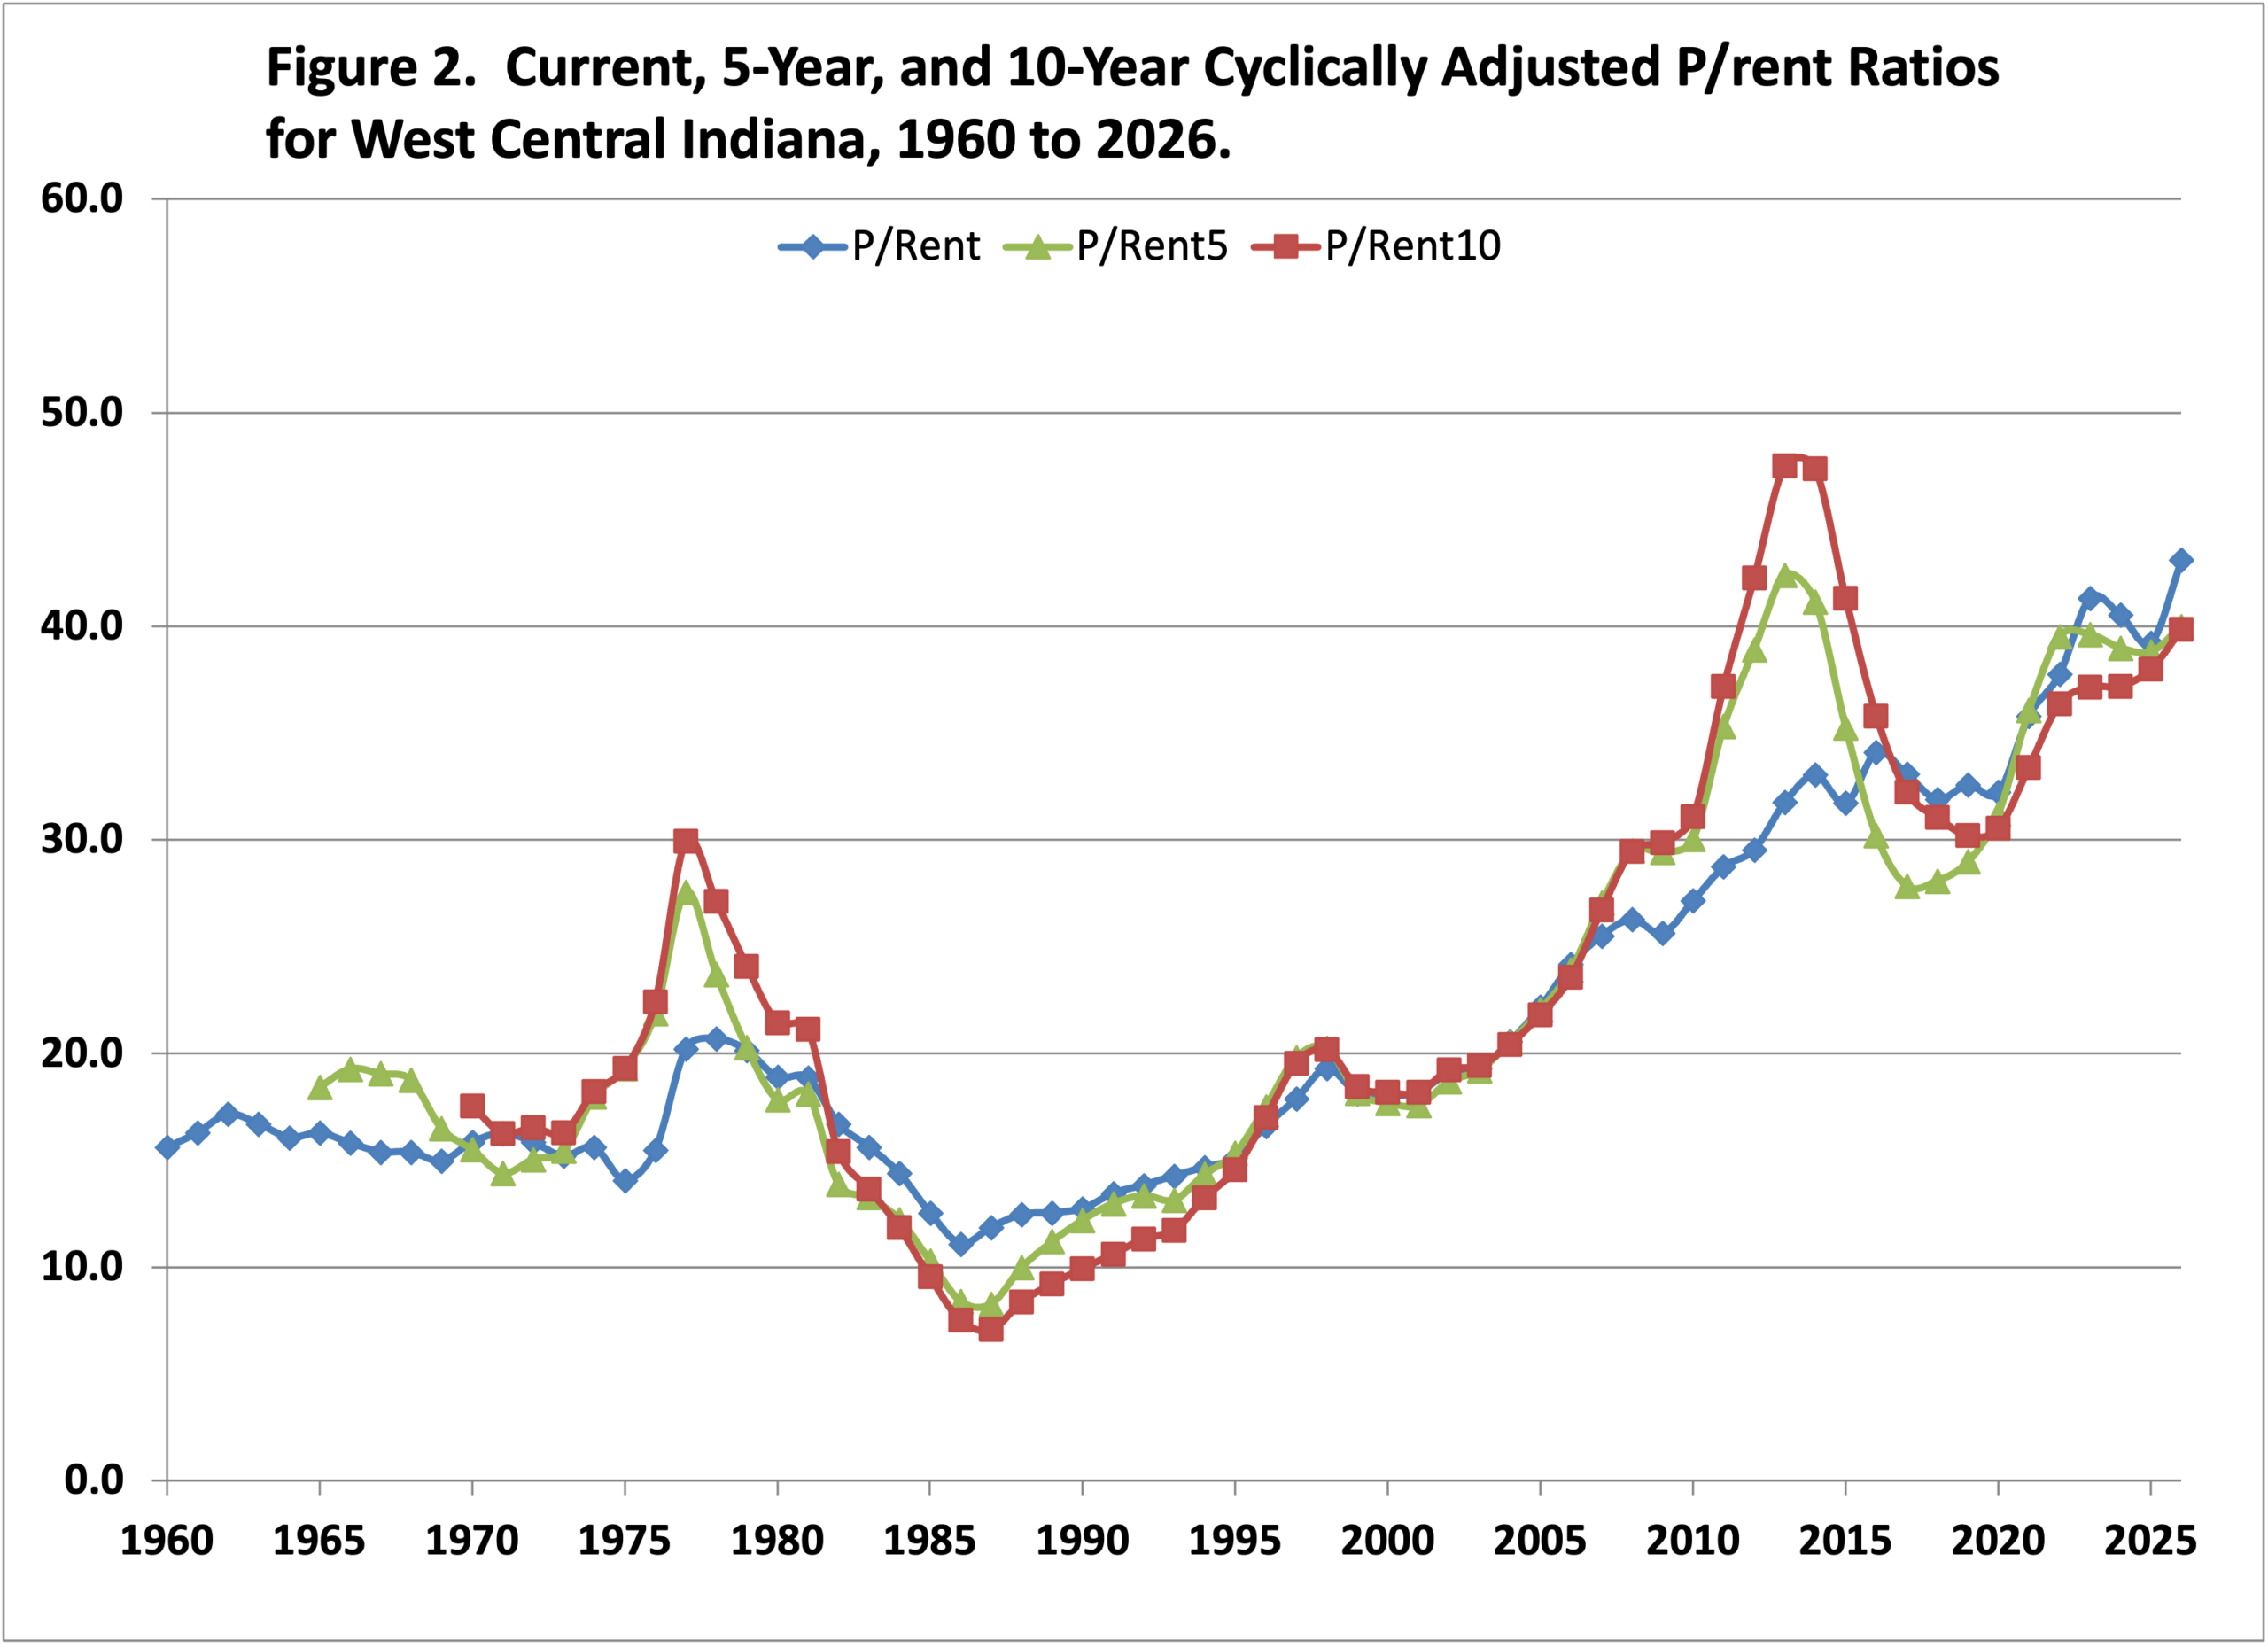
Figure 2 compares the current P/rent ratio with the P/rent5 and P/rent10 ratios. From 2011 to 2015, the P/rent10 ratio was substantially higher than the P/rent ratio. Essentially, during this period, current cash rent, used to compute the P/rent ratio, was higher than the 5-year average and 10-year average cash rent. Assuming that cash rent and interest rates were the primary drivers of farmland prices during this period, those purchasing farmland were likely using current cash rent rather than a longer-run average of cash rent when evaluating the expected long-run returns from owning land. From 2014 to 2019, a period of declining cash rent, the P/rent5 ratio was well below the P/rent ratio. Since 2020, the differences between P/rent, P/rent5, and P/rent10 have been relatively small.
Figure 2
Current, 5-Year, and 10-Year Cyclically Adjusted P/rent Ratios for West Central Indiana, 1960 to 2026
The P/rent10, P/NR-10, and Shiller’s P/E10 ratios are illustrated in Figure 3. The P/rent10 ratio peaked in 2013 at 47.5. The ratio then steadily declined, reaching a low of 30.2 in 2019. The ratio increased from 30.5 in 2020 to 39.9 in 2026. The current P/rent10 ratio (i.e., 39.9) is still relatively high compared to the long-run average (using 1960 to 2026 data) of 23.8. Does the current P/rent10 ratio signify a bubble or is something else going on? Regarding this question, we would like to make two points. First, though interest rates have increased recently, they are still low compared to the long-run averages since 2007. The rate on 10-year treasuries has averaged only 2.9% since 2007. Second, as we note below, the P/rent10 is currently similar to the P/NR-10 ratio, suggesting that we are in equilibrium.
Figure 3
Ten-Year Moving Average of Cyclically Adjusted P/rent, P/OO, and P/E Ratios, 1960 to 2026
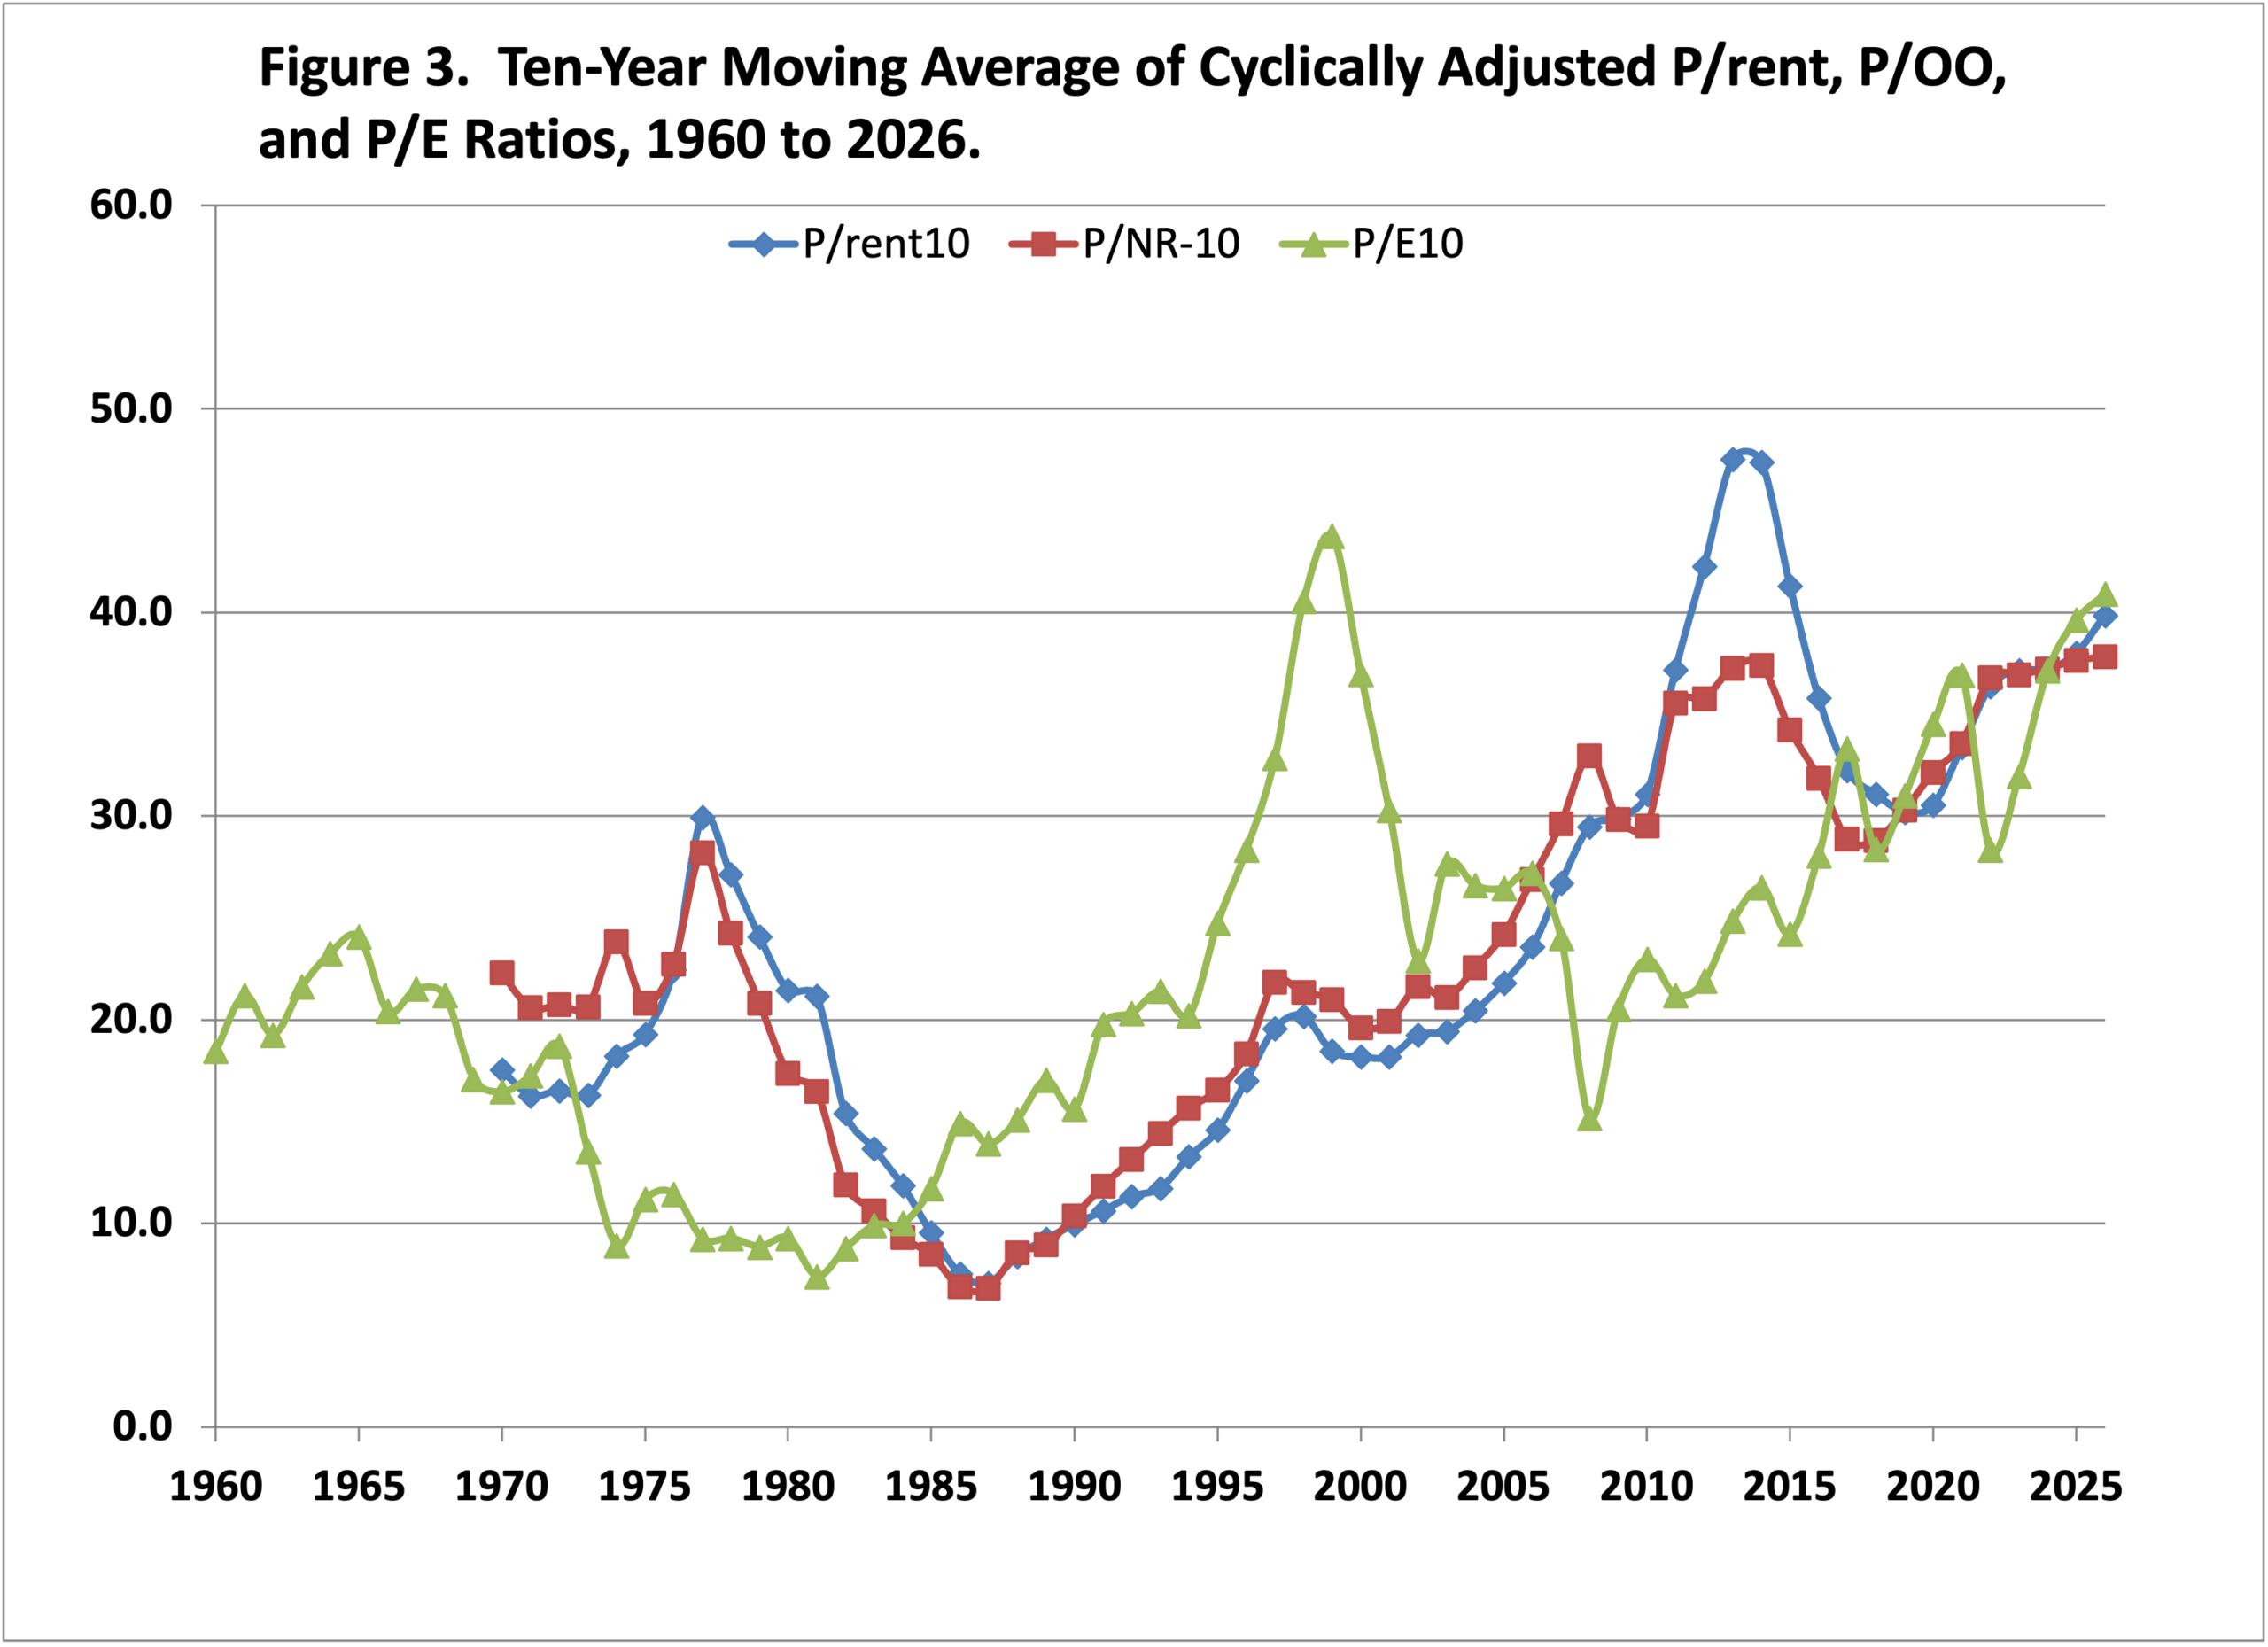
The P/NR-10 ratio fell through the first half of the 1970s when real returns grew faster than land values, increased from around 20 in the mid-1970s to 28.2 in 1977, and then fell to 6.8 in 1987. The P/NR-10 ratio then increased steadily until it reached an initial peak of 37.4 in 2014. The P/NR-10 ratio has ranged from 28.8 to 37.8 since 2014. From 2015 to 2018, the P/NR-10 ratio was smaller than the P/rent10 ratio, indicating that ten-year average cash rents were smaller than ten-year average net returns to land. From 2019 to 2025, the P/NR-10 ratio was similar to the P/rent10 ratio. Currently, the P/rent10 ratio is slightly higher than the P/NR-10 ratio, indicating that the ten-year average net return to land is slightly higher than the ten-year average cash rent. In the long run, you would expect the two ratios to be similar. In fact, the average P/rent10 and P/NR-10 ratios for the 1960 to 2025 period were 23.8 and 23.3, respectively.
It is evident from Figure 3 that there is not a close link between the P/E10 ratio and the P/rent10 ratio. The P/E10 ratio was much higher than the P/rent ratio from 1995 to 2002. In contrast, the P/E10 ratio was quite a bit lower than the P/rent ratio from 1976 to 1981, in 2008, from 2011 to 2015, and in 2022 and 2023.
Buy at a High Ratio: Get a Low Future Return?
Shiller also discusses the relationship between the P/E10 ratio and the annualized rate of return from holding S&P 500 stocks for long periods. In general, his results show that the higher the P/E10 ratio at the time of purchase, the lower the resulting multiple-year returns, like for the next 10 or 20 years. The west-central Indiana farmland and cash rent data from 1960 to 2026 are used to compute 10-year and 20-year annualized rates of return. Returns are the sum of the average of cash rent as a fraction of the farmland price each year, plus the annualized price appreciation over the holding period.
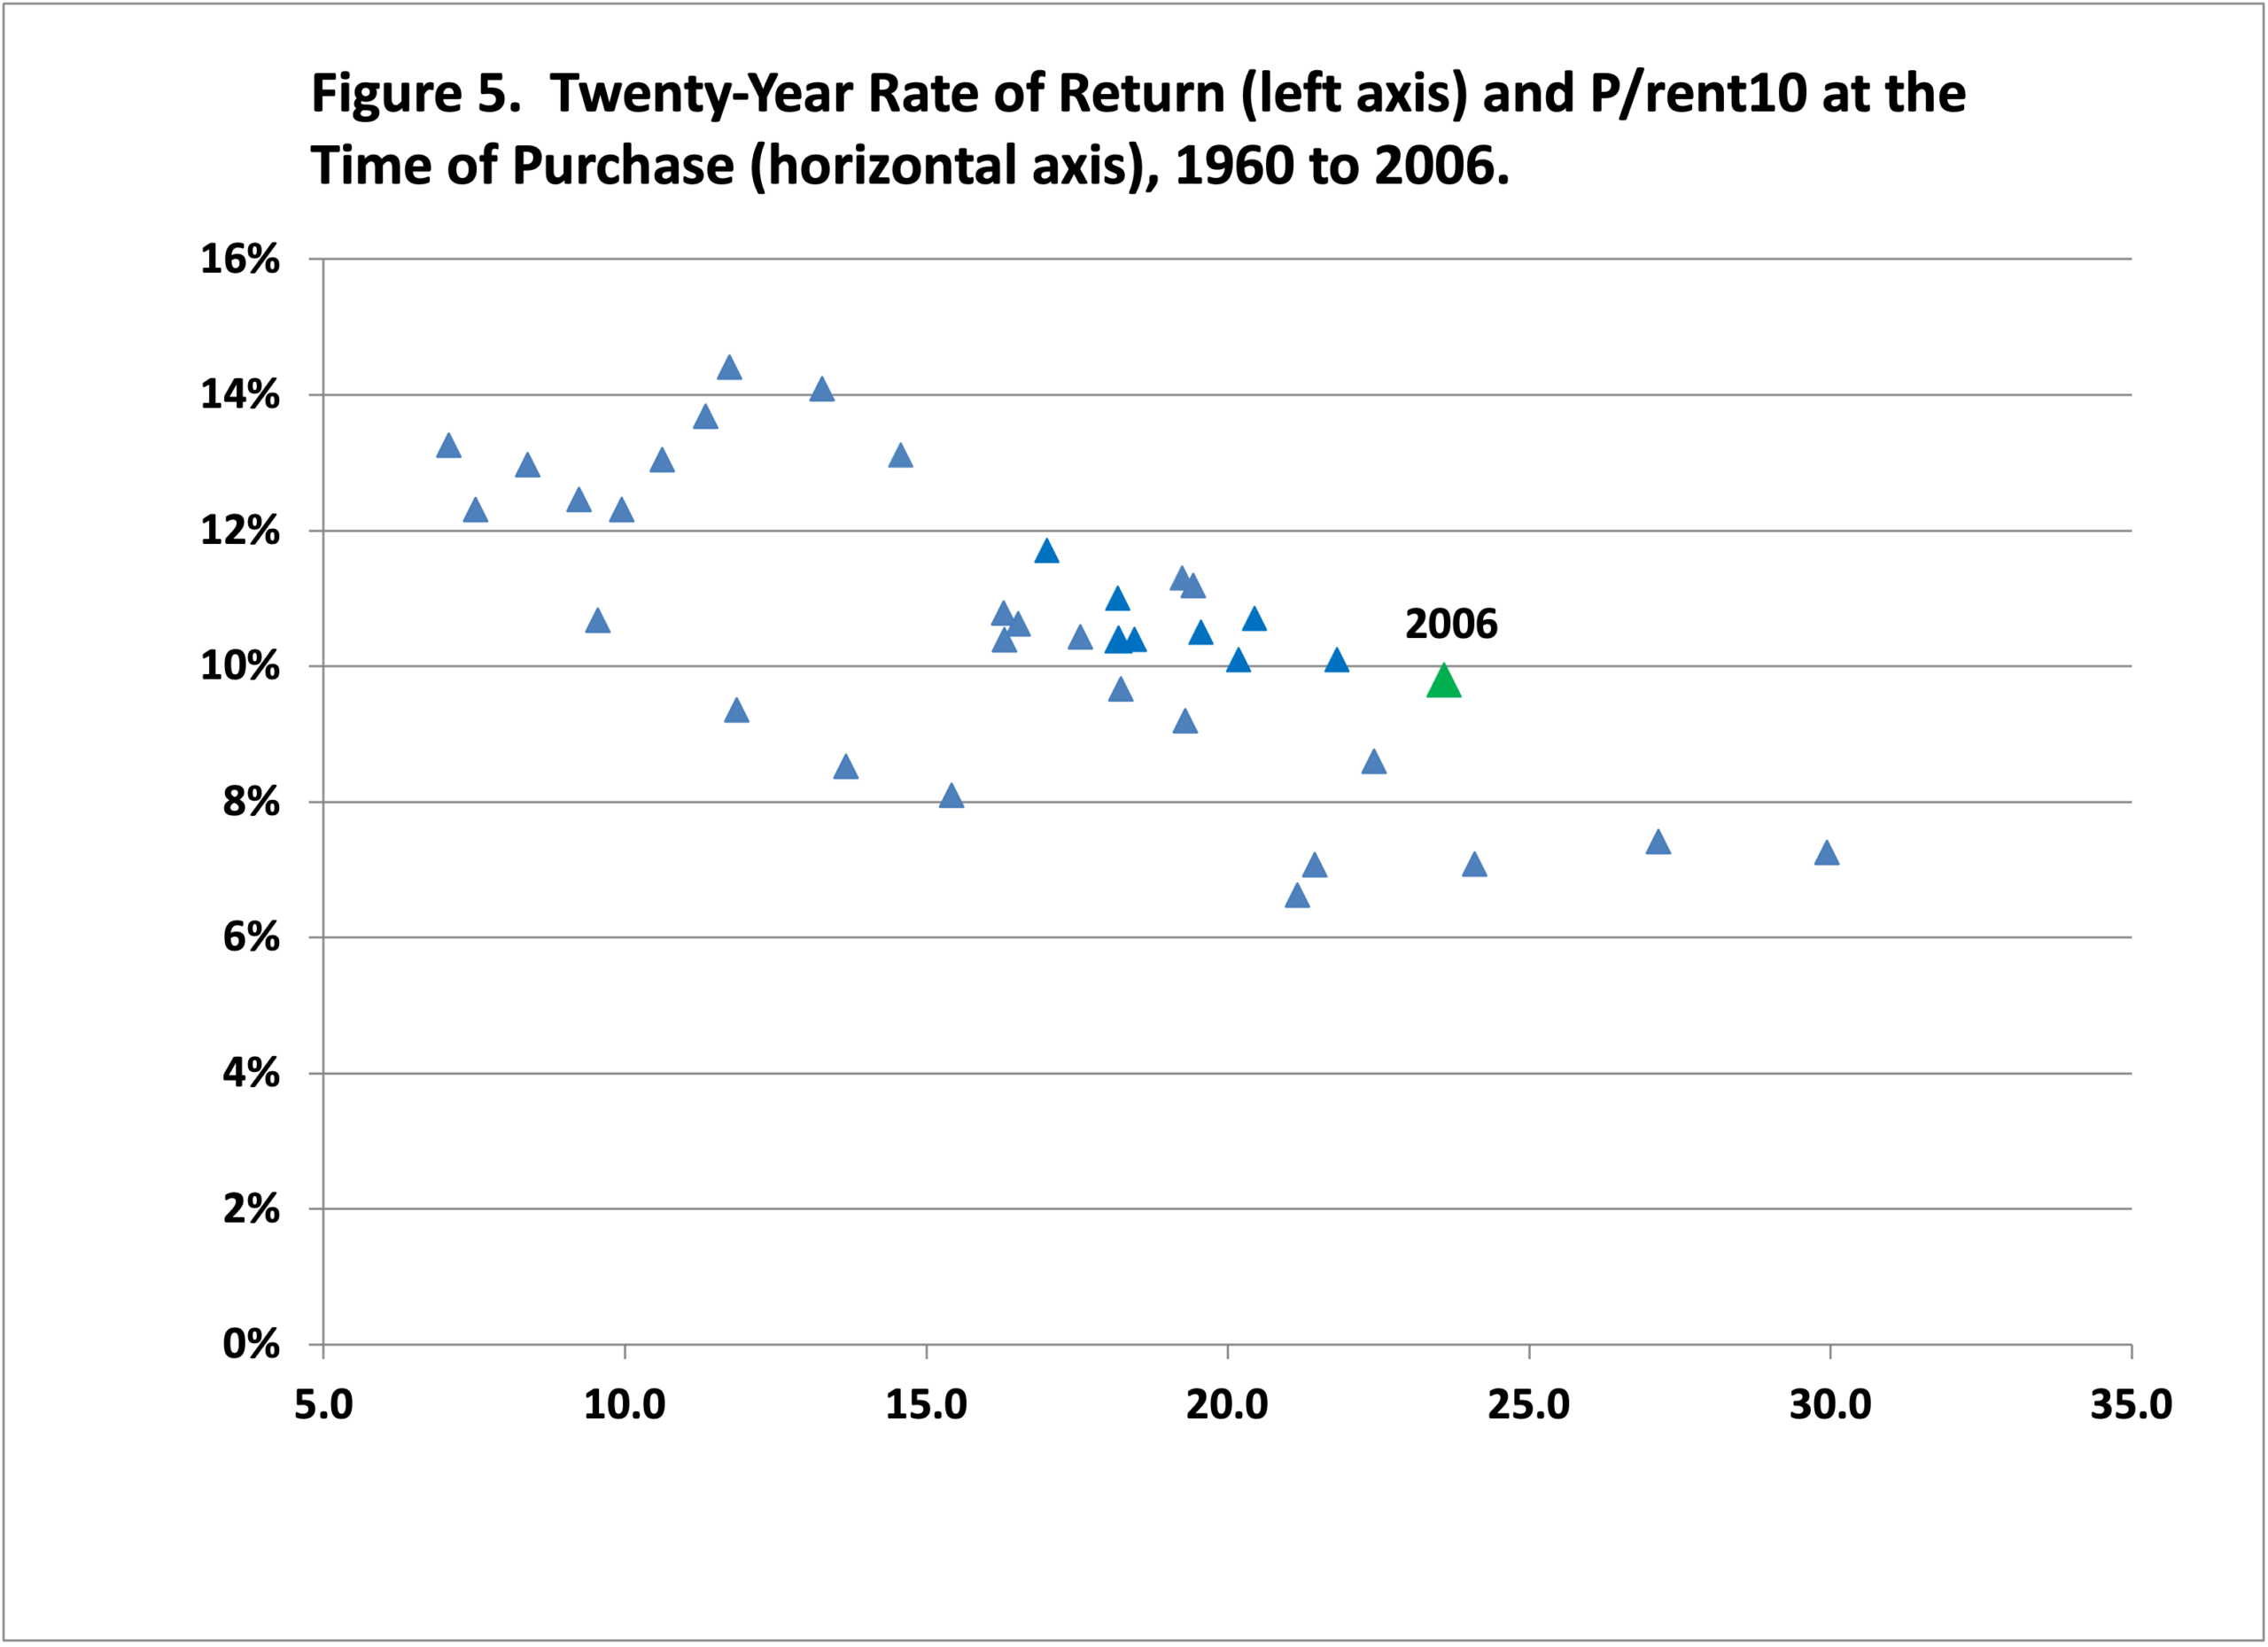
The results for farmland show a negative relationship like that exhibited in Shiller’s stock data. The 10-year holding period returns for farmland show a strong negative relationship (Figure 4). That is, if one purchased farmland when the P/rent10 ratio was very high, like now, they tended to have a low 10-year rate of return. Alternatively, if one purchased farmland when the P/rent10 was intermediate or low, they tended to have moderate to high 10-year returns. The 10-year returns ranged from a small negative to 20% and averaged 11.0%. The 20-year holding period returns also exhibit a strong negative relationship with the P/rent10 ratio (Figure 5). The 20-year holding returns ranged from 6 to 16% and averaged 10.9%.
Figure 4
Ten-Year Rate of Return (left axis) and P/rent10 at the Time of Purchase (horizontal axis), 1960 to 2016
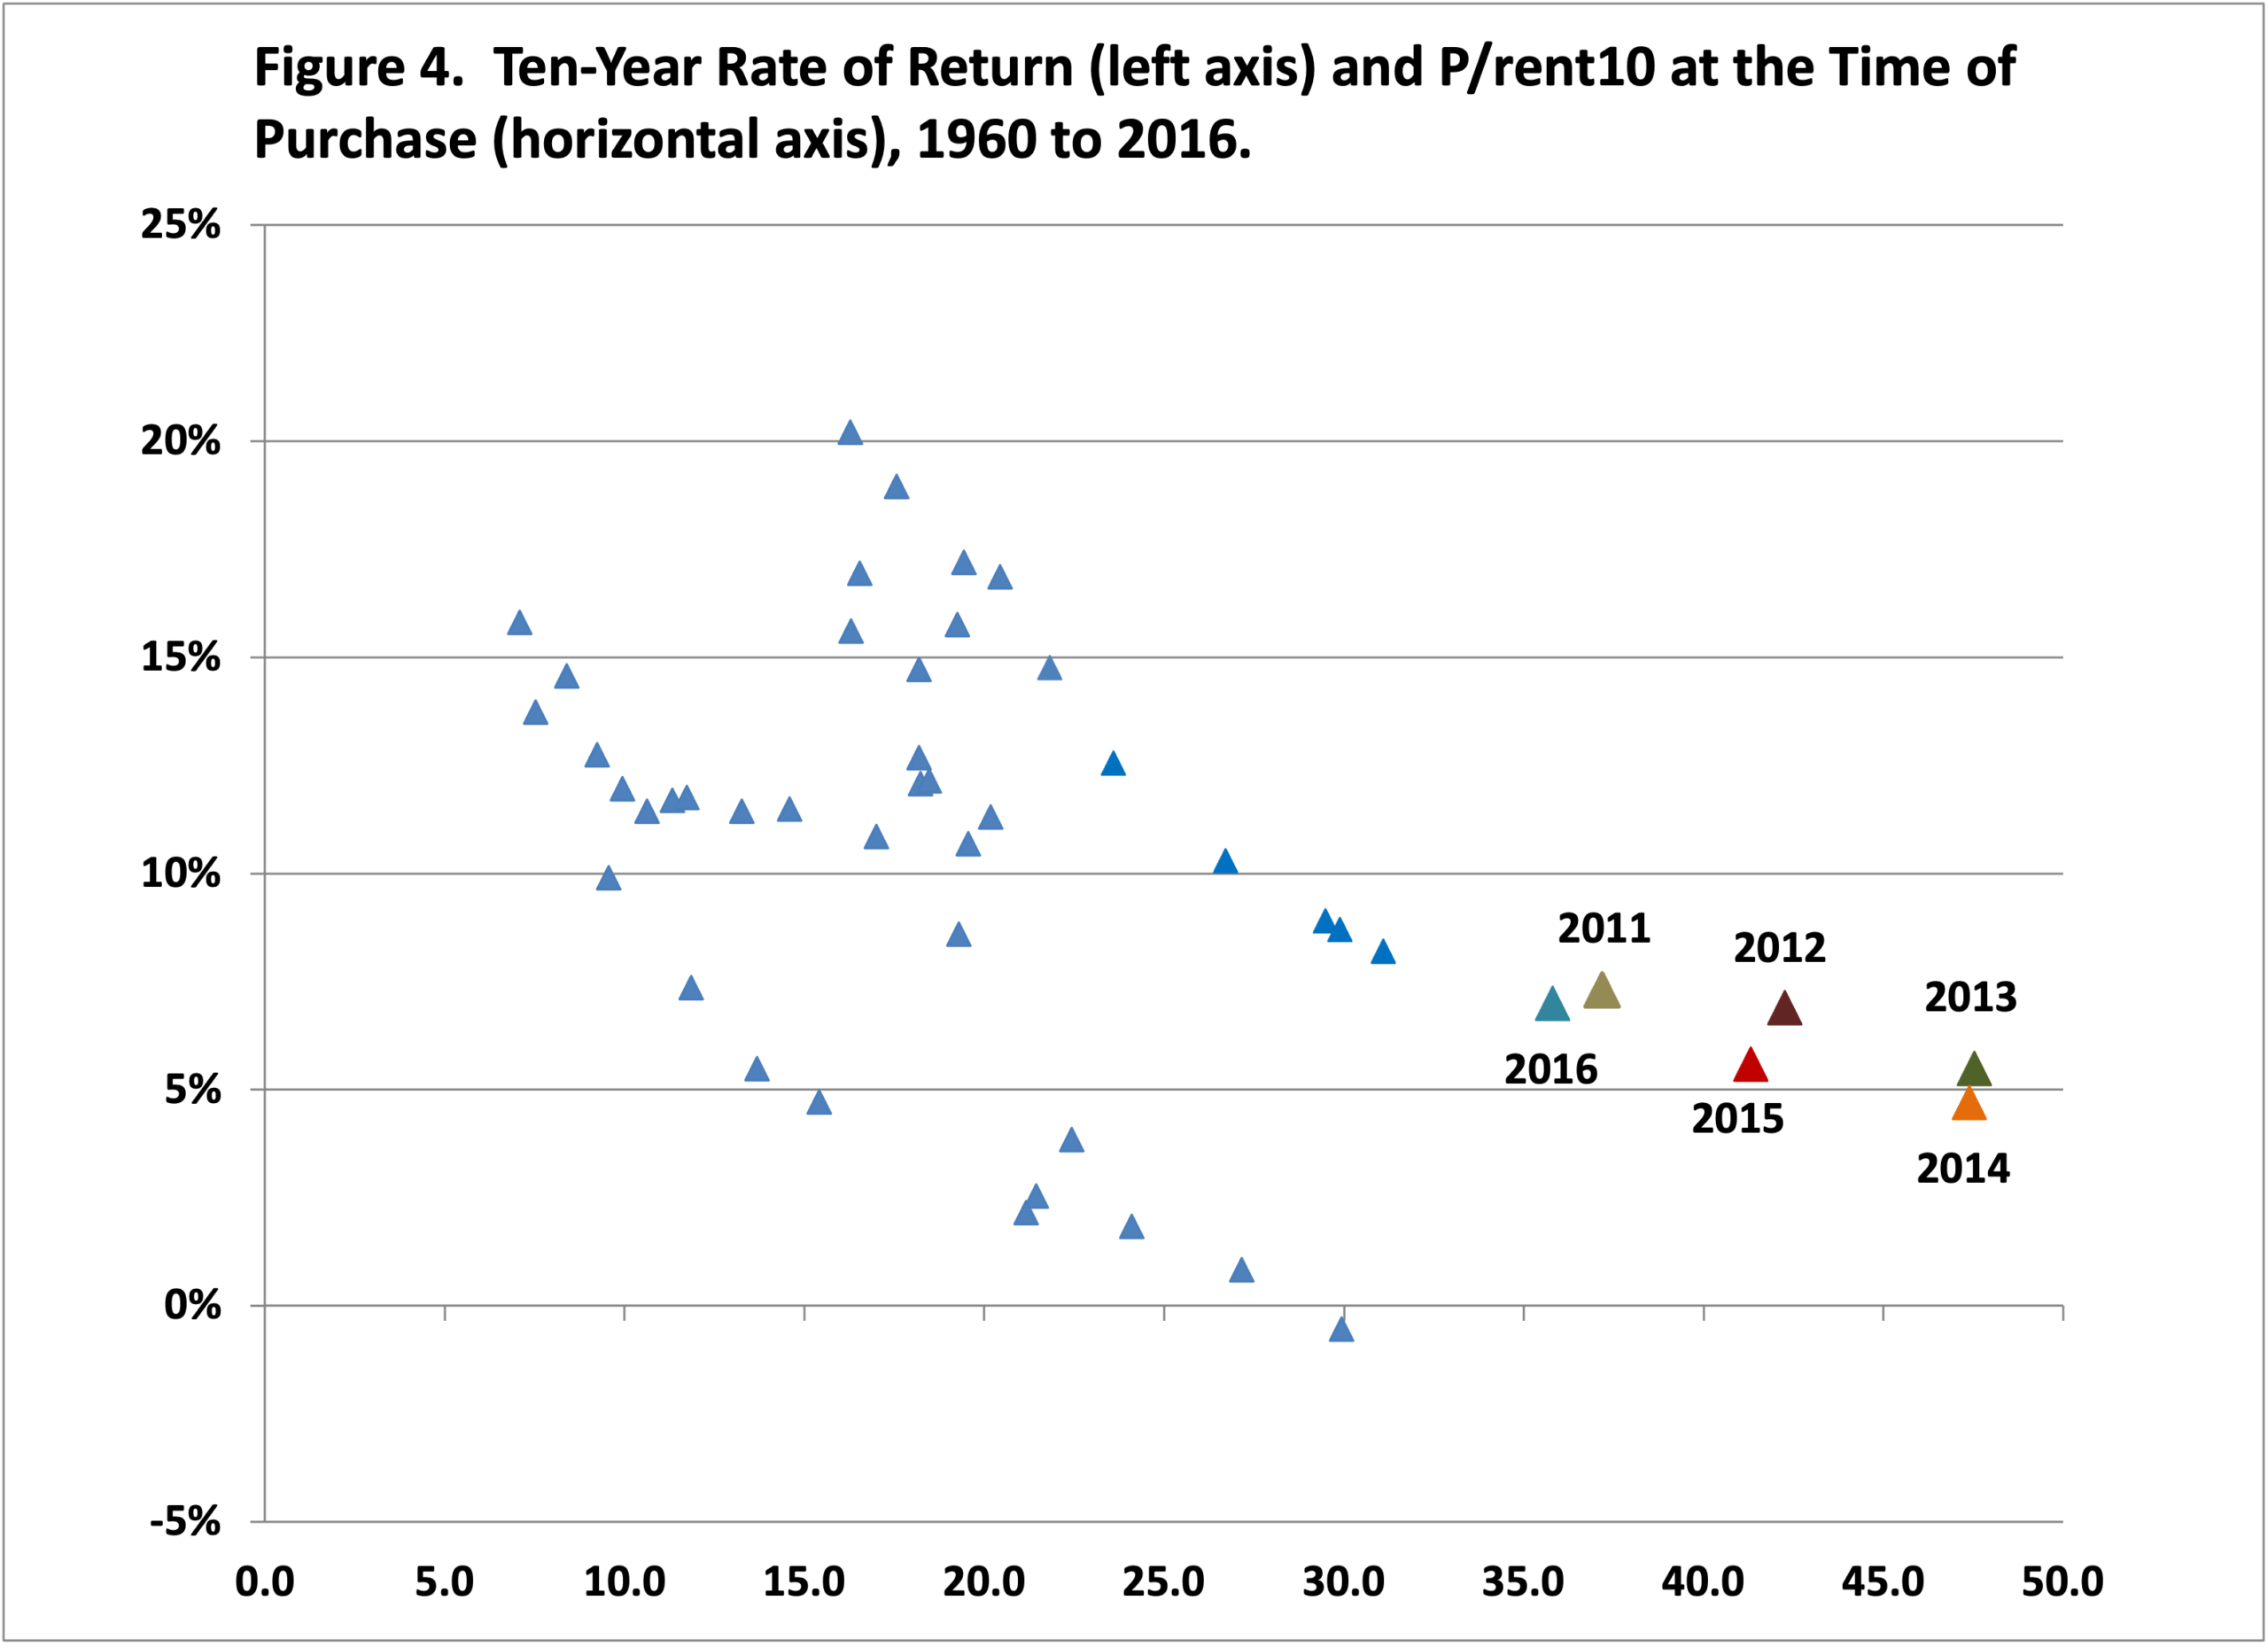
Figure 5
Twenty-Year Rate of Return (left axis) and P/rent10 at the Time of Purchase (horizontal axis), 1960 to 2006
As noted above, Figure 4 presents the ten-year rate of return for farmland and the P/rent10 ratio for land purchased in west central Indiana from 1960 to 2016. The P/rent10 ratio in 2016 (i.e., 35.8) represents the lowest ratio since 2011. The ten-year rate of return for farmland purchased in 2016 was 7.0%, up from a 5.7% rate of return the year before. From 2017 to 2026, the P/rent10 ratios range from 30 to 40. Will rates of return for land purchased since 2017 stay positive? The answer to this question depends on what happens to net returns to land and interest rates. If long-run net returns are strong and interest rates stay relatively low, the answer to the question is probably yes.
The 20-year rate of return for land purchased in 2006 is 9.8%, which is in the middle of the range of 20-year rates of return illustrated in Figure 5. Since 1996, the 20-year rate has been in a tight range (i.e., 10 to 12%). It will be interesting to see if the 20-year rate of return declines as the P/rent10 ratio increases in the next few years. For land purchased in 2007, the P/rent10 is 26.7. In the following three years (i.e., 2018 to 2020), this rate will increase to approximately 31. After 2010, the P/rent10 ratio ranges from 30 to 47.
Final Comments
Our analysis indicates that the P/rent ratio (price per acre divided by cash rent per acre) is substantially higher than historical values. To maintain the current high farmland values, cash rents would have to remain relatively high, and interest rates would also have to remain relatively low. Most agricultural economists expect crop net returns to be lower than the levels experienced in 2021 and 2022 in the next few years. What about the capitalization rate, which is computed by dividing cash rent by land values (i.e., the inverse of the P/rent ratio)? The implied capitalization rate in 2026 using west-central Indiana data is 0.023. Several factors impact the capitalization rate, including interest rates and macroeconomic factors such as rent growth, GDP, credit risk, and asset class. The relationship between the capitalization rate and interest rates is not a one-to-one relationship. Specifically, capitalization rates have a much narrower range than interest rates. Having said that, the recent increases in interest rates put upward pressure on the capitalization rates. This, along with lower net crop returns, suggests that the P/rent ratio should at least stabilize, and depending on the impact of interest rates on capitalization rates, could even decline in the near future.
We demonstrated that farmland values have tended to have a cyclical component in which farmland values move too high relative to the underlying fundamentals and then, over time, move too low relative to fundamentals. We use a cyclically adjusted P/rent ratio to show that a very high P/rent ratio, as we have now, tends to be associated with low subsequent returns. Simply stated, this means that the historical relationships show that those who bought farmland when the P/rent ratio was high tended to have low subsequent returns. On the other hand, those who bought farmland when the P/rent ratio was intermediate or low tended to have intermediate or high subsequent returns. The current record-high P/rent ratio could be a warning to current farmland buyers that their odds of favorable returns on these purchases are probably not high.
Our reading from examining 66 years of history is that the current relationship between farmland prices and cash rents suggests that farmland prices are elevated. If we are correct, this means that those purchasing farmland at current prices may experience “buyer’s remorse” in coming years. However, there remain some possible situations in which farmland values could be maintained or even increase. Positive influences on land include relatively low interest rates, the relatively small percent of land currently on the market, the attractiveness of farmland to pension fund managers, and the fact that land is a good hedge against inflation.
References
Shiller, R.J. 2005. Irrational Exuberance, Second Edition. New York: Crown Business.
Shiller, R.J. 2026. S&P 500 P/E Ratio. www.multpl.com, accessed August 3, 2026.