September 25, 2026
September 2026 Basis Update: The Harvest Dip
by Josh Strine


As harvest begins across the Eastern Corn Belt, we turn our focus to the 2026-2027 marketing year. While this year’s crop is just starting to come off, the September basis update can offer insight into where regional strength may persist through the rest of the year. As of the fourth week of September, nearby corn basis to December futures and soybean basis to November futures were strongest in parts of Indiana, Ohio, and Michigan and weakest in Iowa and Illinois. Over the past four weeks, basis has broadly weakened across the region, consistent with the typical harvest dip. However, corn basis in Iowa has stood out, showing consistent strengthening across the state. Evolving basis across the region may reflect a range of supply and demand dynamics, including local production, harvest progress, and end-user activity.
Corn Basis Trends
As of the fourth week of September, the strongest corn basis is in central Indiana and Ohio, while the weakest is in southern Indiana and Illinois. Basis is strongest in West Central Ohio (-$0.13/bu) and neighboring East Central Indiana (-$0.16/bu). Basis is weakest in Southeast Indiana (-$0.70/bu) and Southeast Illinois (-$0.66/bu). While these patterns align with what we saw at the end of the 2025-2026 marketing year, they still differ markedly from the three-year historical average (Figure 1). Local basis across Indiana, Ohio, and Michigan is generally above their historical averages, while Illinois and Iowa are weaker. In Southeast Iowa, corn basis of -$0.53/bu is the lowest on record for this time of year.
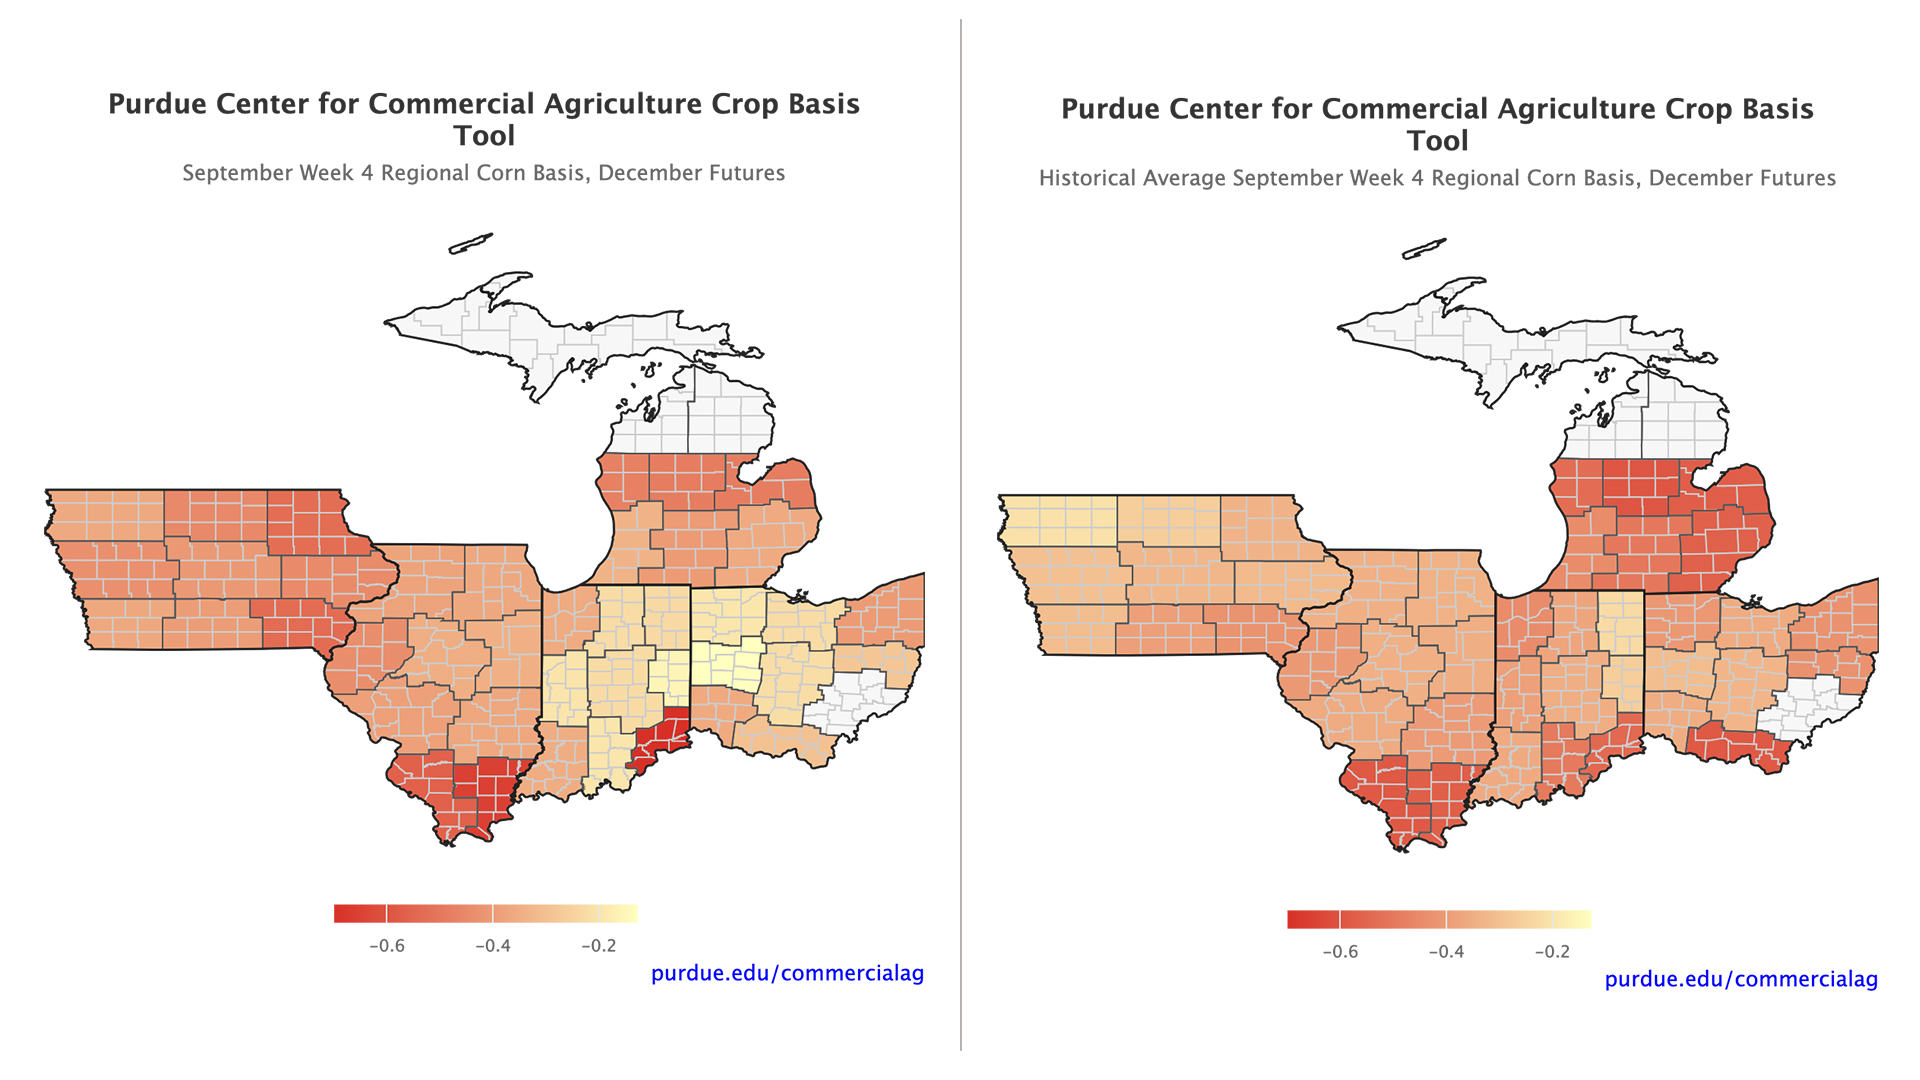
Figure 1. Corn basis to December futures, September week 4, and the historical average for the same week.
Spatial differences may be driven in part by trends in state-level corn production. According to USDA NASS Quick Stats (2026), Iowa is forecast to increase corn production for the fourth consecutive year (Figure 2). Production in Michigan and Indiana is expected to be down from last year and below the three-year average. Production doesn’t align with basis in Illinois, where basis is weak and production has decreased, or in Ohio, where basis is high and production has increased. Local demand may help explain Ohio’s strength, as ethanol plant basis in the state is +$0.10/bu, $0.20/bu above its historical average. Alternatively, it may reflect harvest progression.
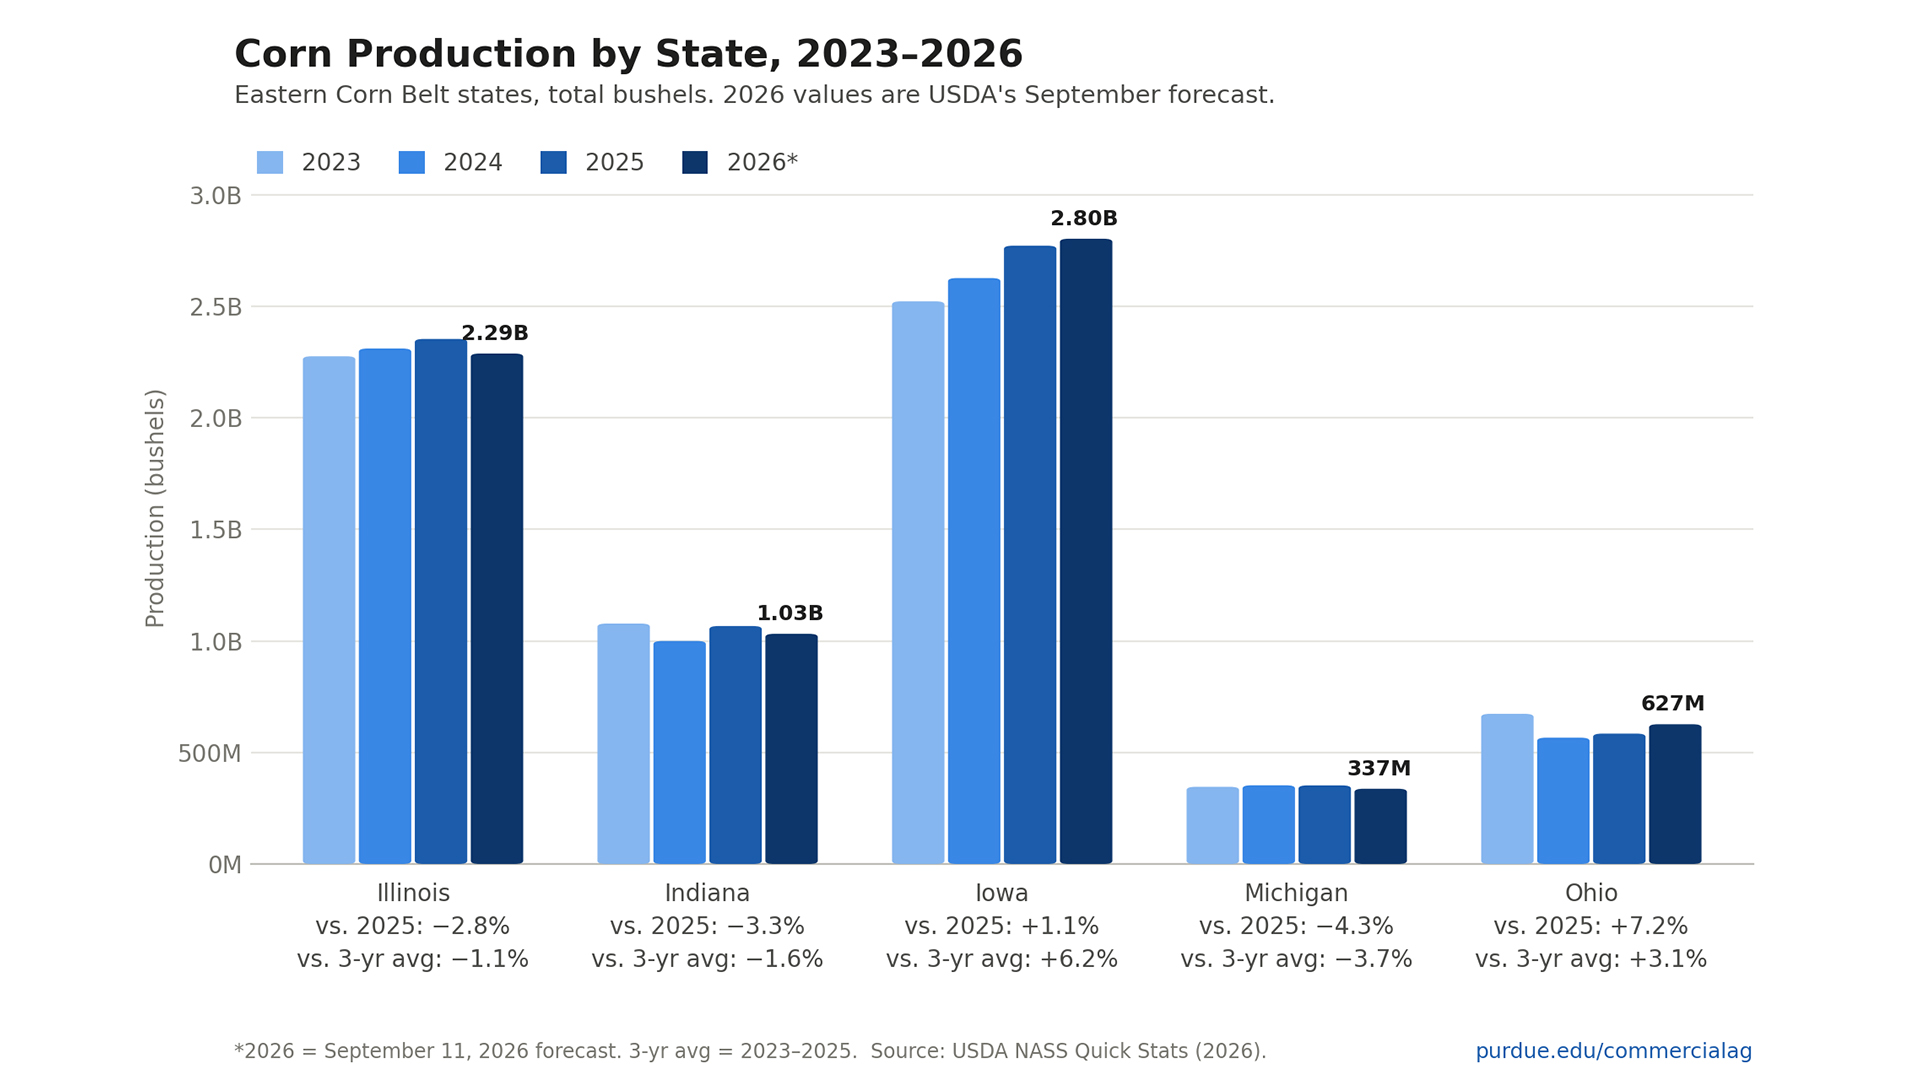
Figure 2. Corn production by state, 2023–2026. Source: USDA NASS Quick Stats (2026).
As of September 20, corn harvest is on pace or ahead of the five-year average in Illinois and Indiana and behind schedule in Ohio, Iowa, and Michigan (USDA NASS Quick Stats, 2026). Each fall, we observe a decline in basis across the region, coinciding with an influx of local supply from harvest. In states where harvest is ahead of schedule, we have already seen the largest declines in local basis. For example, basis has weakened by $0.26/bu in Southeast Illinois over the past four weeks (Figure 3). Sharp declines in southern Indiana and Illinois, including a $0.13/bu drop in Southeast Indiana, align with a $0.30/bu basis drop along the Ohio River, pushing it to -$0.67/bu, the lowest on record for this time of year (Figure 4). Basis weakening is not universal. In Iowa, where harvest is behind schedule, basis has increased in each crop reporting district. In Northwest Iowa, it is as much as $0.09/bu (Figure 5). Iowa ethanol plant basis also rose $0.14/bu, and Indiana ethanol basis edged higher.
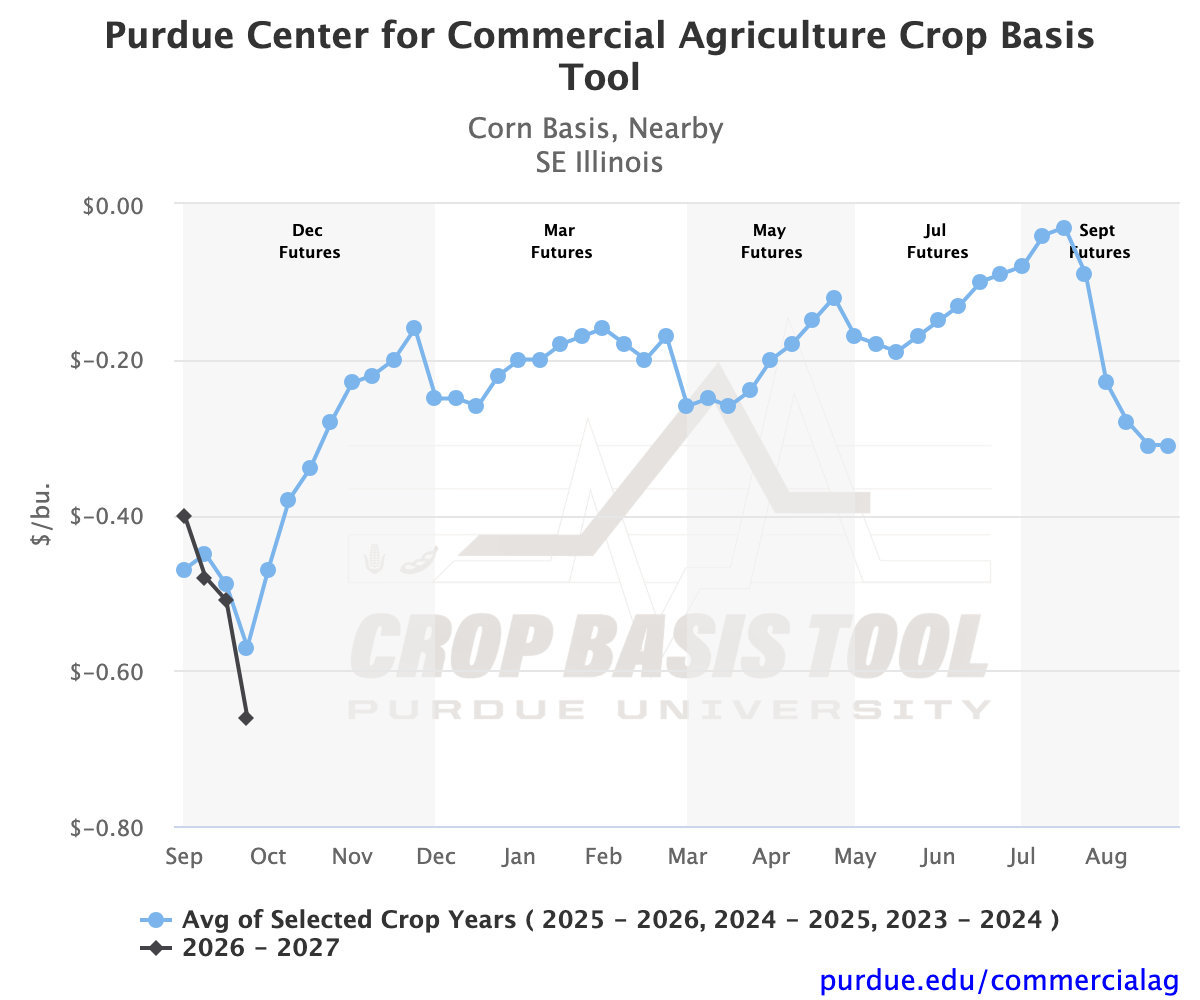
Figure 3. Southeast Illinois corn basis.
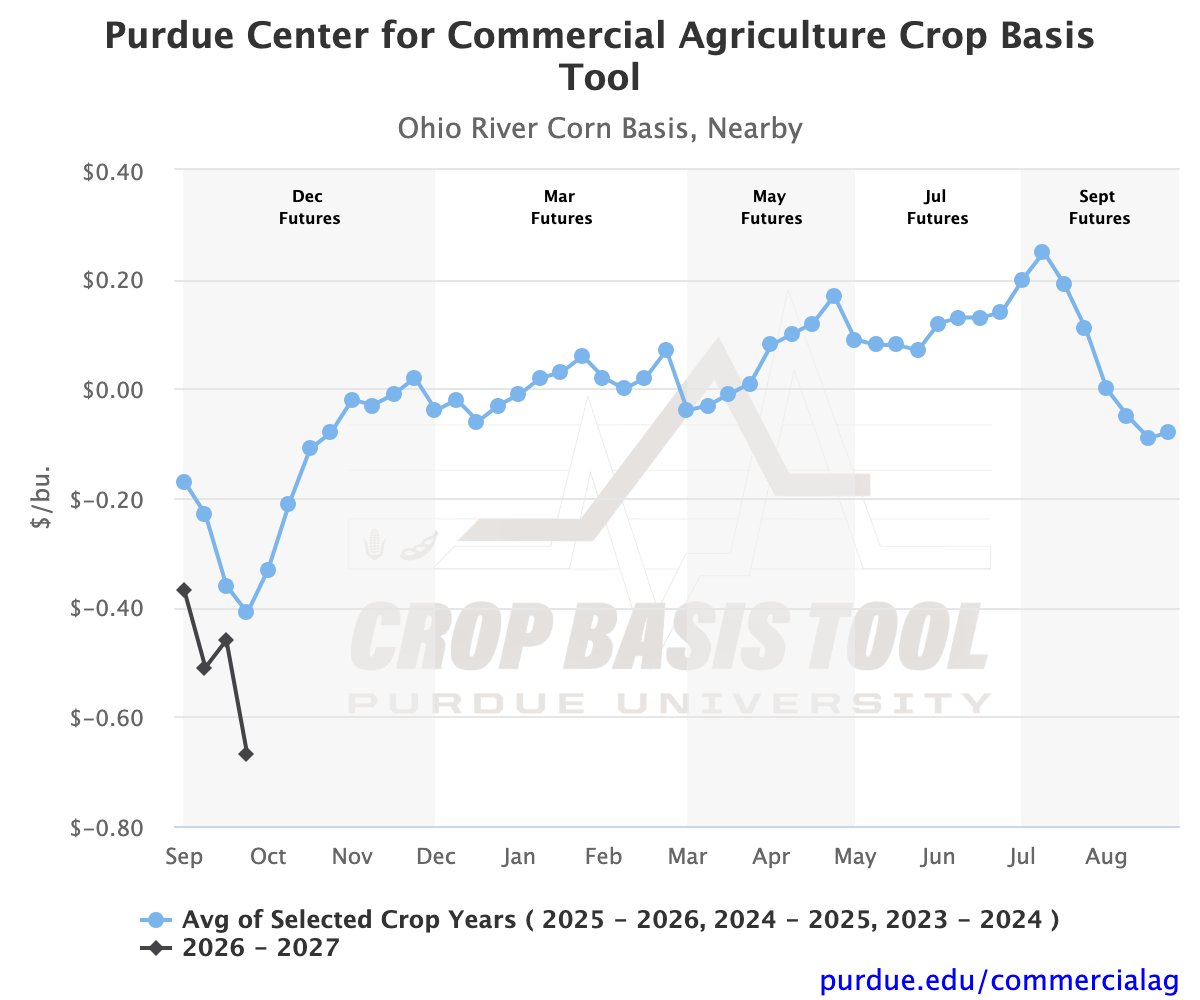
Figure 4. Ohio River corn basis.
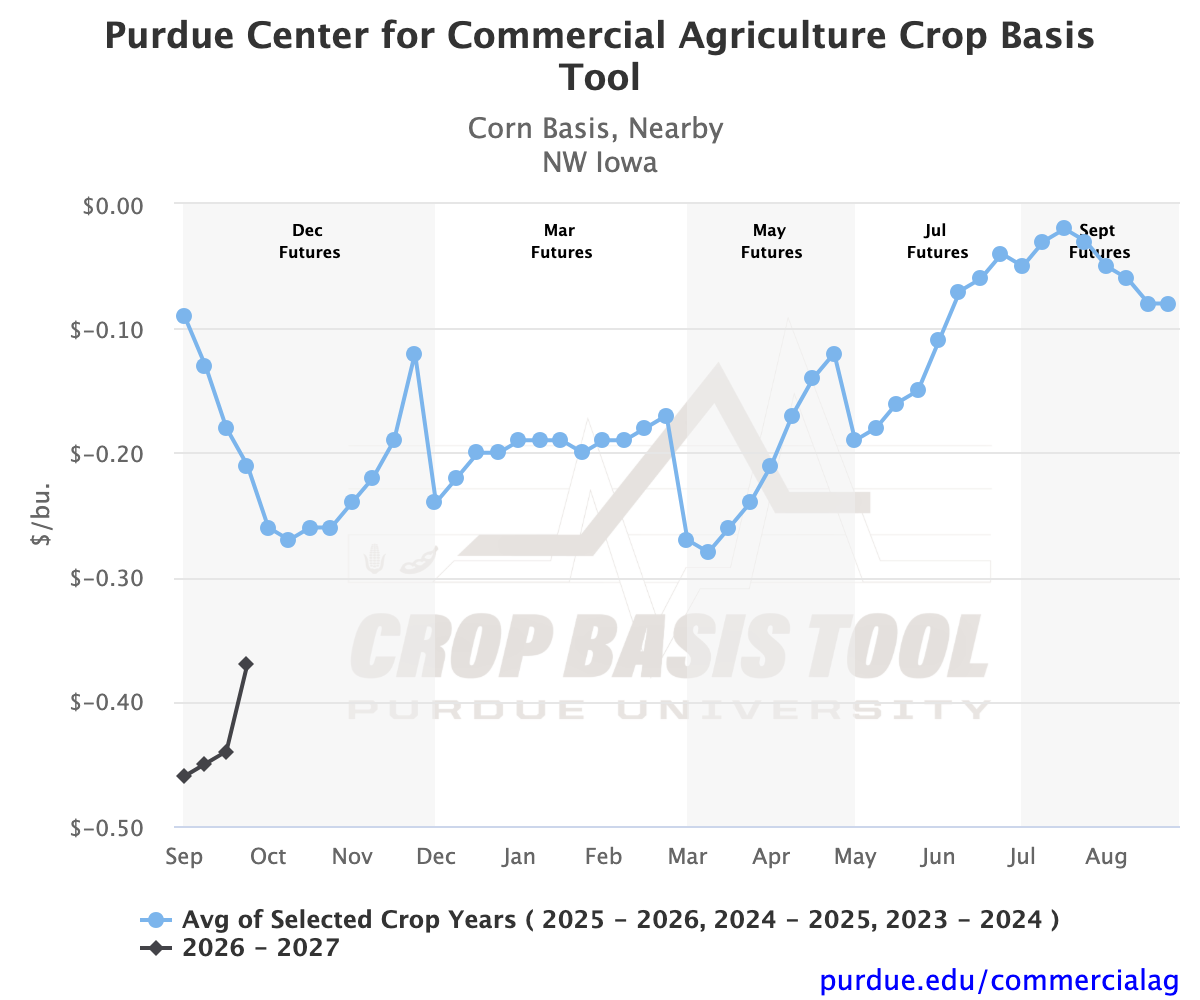
Figure 5. Northwest Iowa corn basis.
Soybean Basis Trends
Soybean spatial basis patterns are trending toward the historical average at the start of the marketing year. Basis strength is concentrated in Indiana, Michigan, and northern Ohio. West Central Indiana had the highest basis at -$0.14/bu to November futures. Basis weakness is more widely dispersed across the region. The lowest basis levels as of the fourth week of September were -$0.72/bu in East Central Michigan and -$0.70/bu in Northeast Iowa. While basis varies significantly, it is above the two-year historical average in all but three districts: Southwest Indiana, Southeast Indiana, and Southeast Illinois (Figure 6).
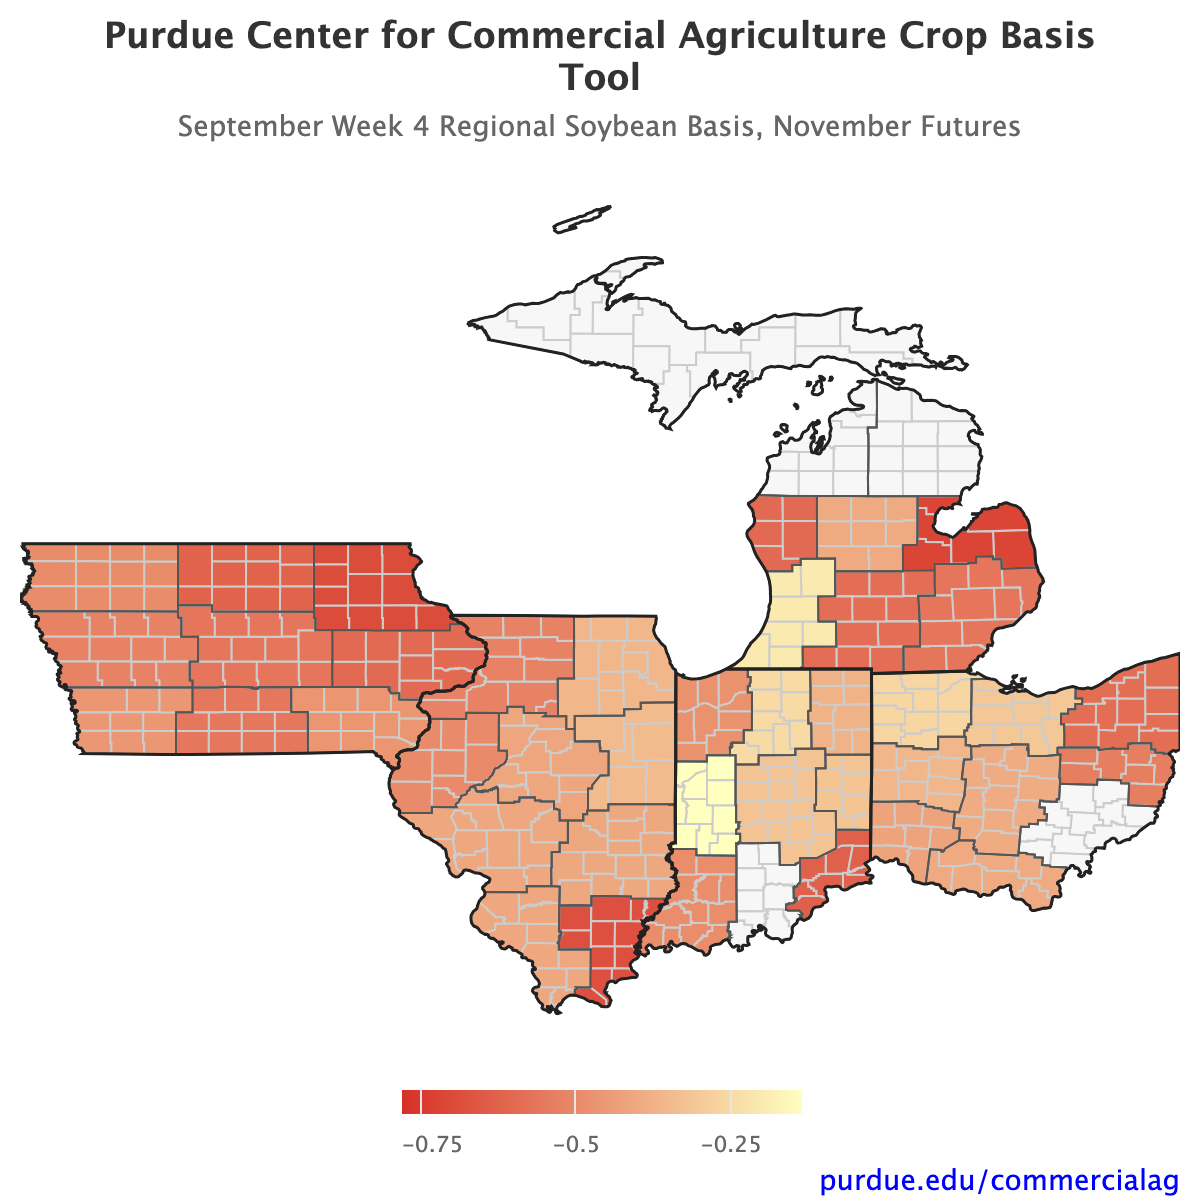
Figure 6. Soybean basis to November futures, September week 4.
Basis strength relative to the historical average cannot be explained away by production as easily as it can for corn. Across all five states, forecasted production is above the three-year average (USDA NASS Quick Stats, 2026; Figure 7). Additionally, harvest is at or ahead of the recent pace in Indiana and Illinois. Alternatively, evolving demand may be driving changes in basis levels. In Iowa and Ohio, the state-level basis from soybean processors has set seasonal records for the length of the data in the crop basis tool. In Ohio, local soybean processors averaged $0.43/bu above November futures (Figure 8). In Iowa, local soybean processors averaged $0.31/bu above November futures.
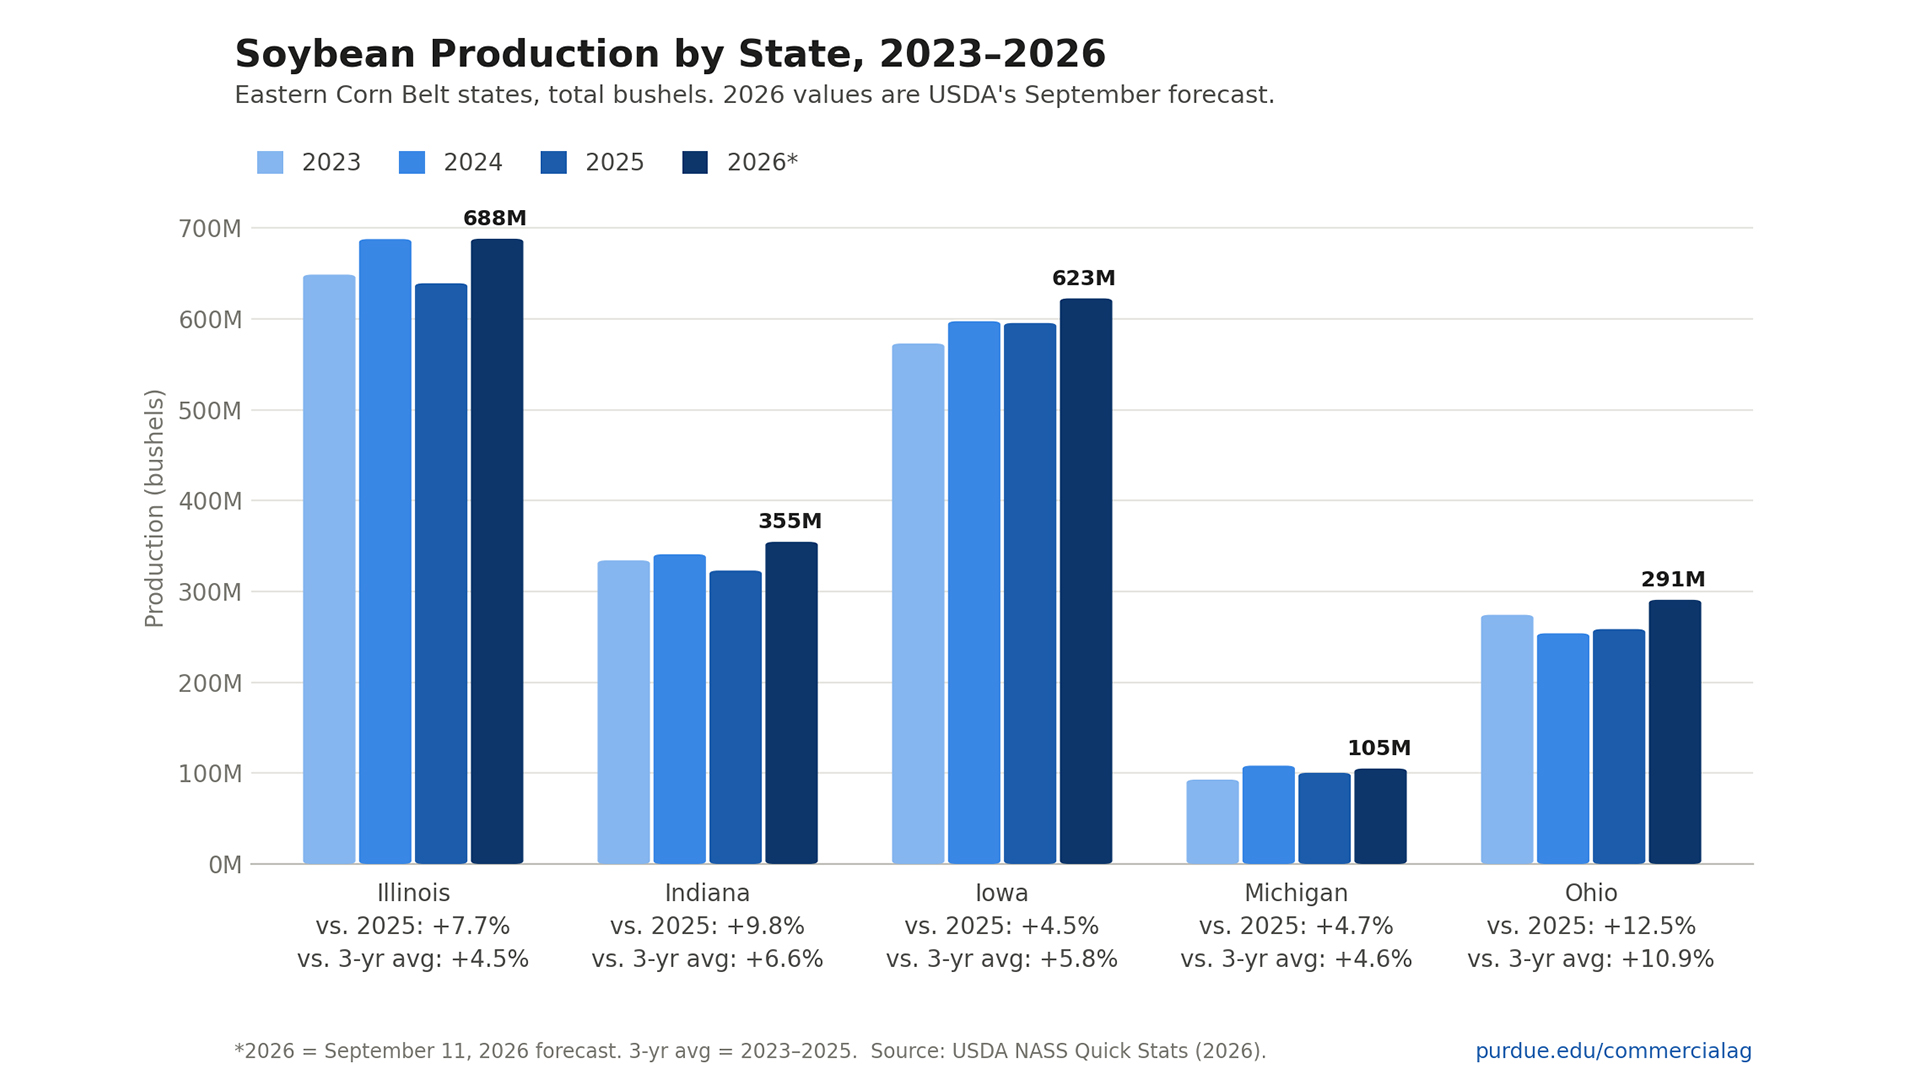
Figure 7. Soybean production by state, 2023–2026. Source: USDA NASS Quick Stats (2026).
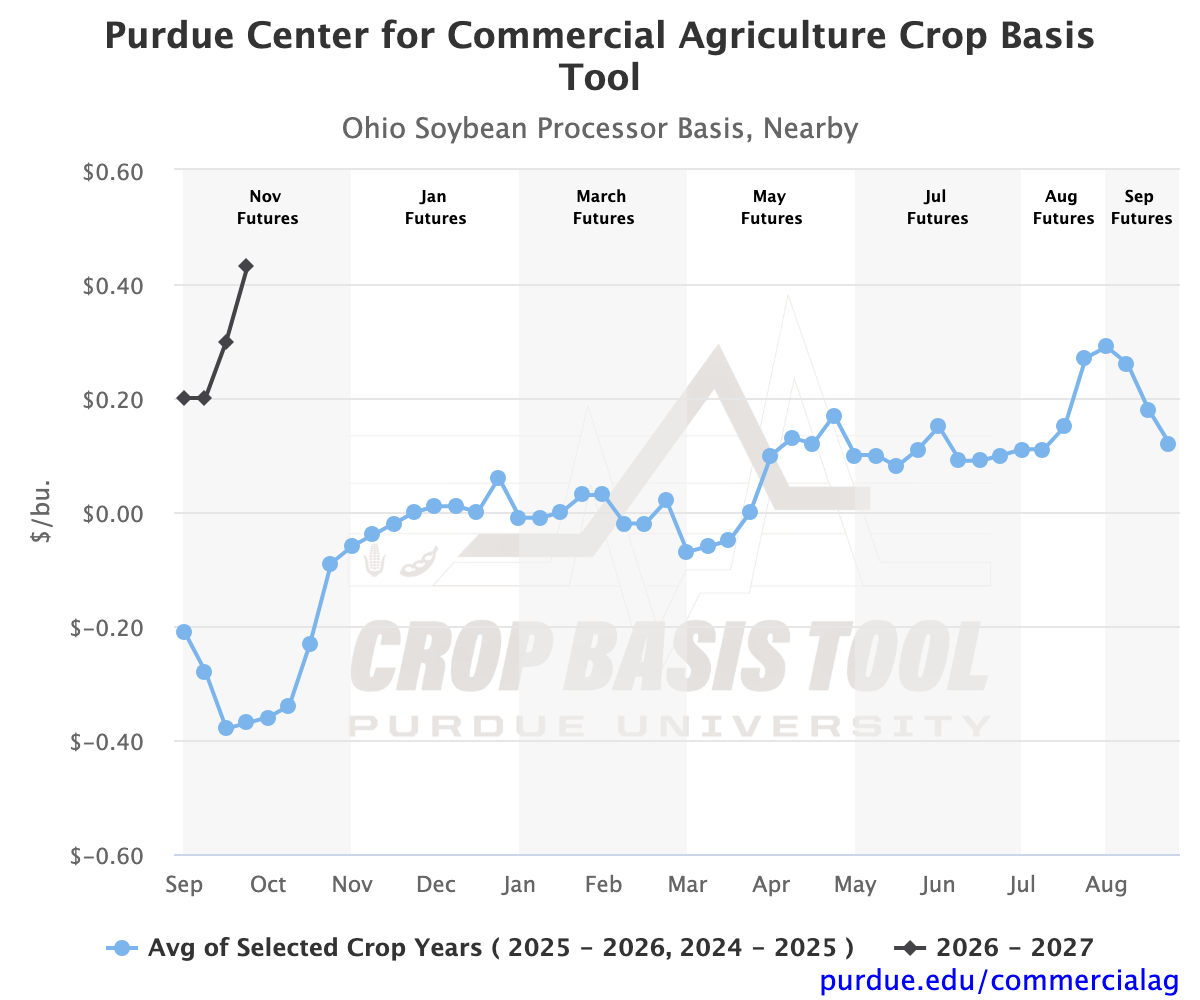
Figure 8. Ohio soybean processor basis.
While the harvest dip in corn basis has not yet affected the entire region, it has for soybeans. Only two crop reporting districts across the five states recorded higher basis over the past four weeks. In both Southeast Iowa and North Central Indiana, basis increased by $0.02/bu (Figure 9). Basis losses across the region are much more substantial. For example, East Central Iowa basis fell by $0.45/bu since the first week of September (Figure 10). Many other crop reporting districts saw declines of more than $0.20/bu.
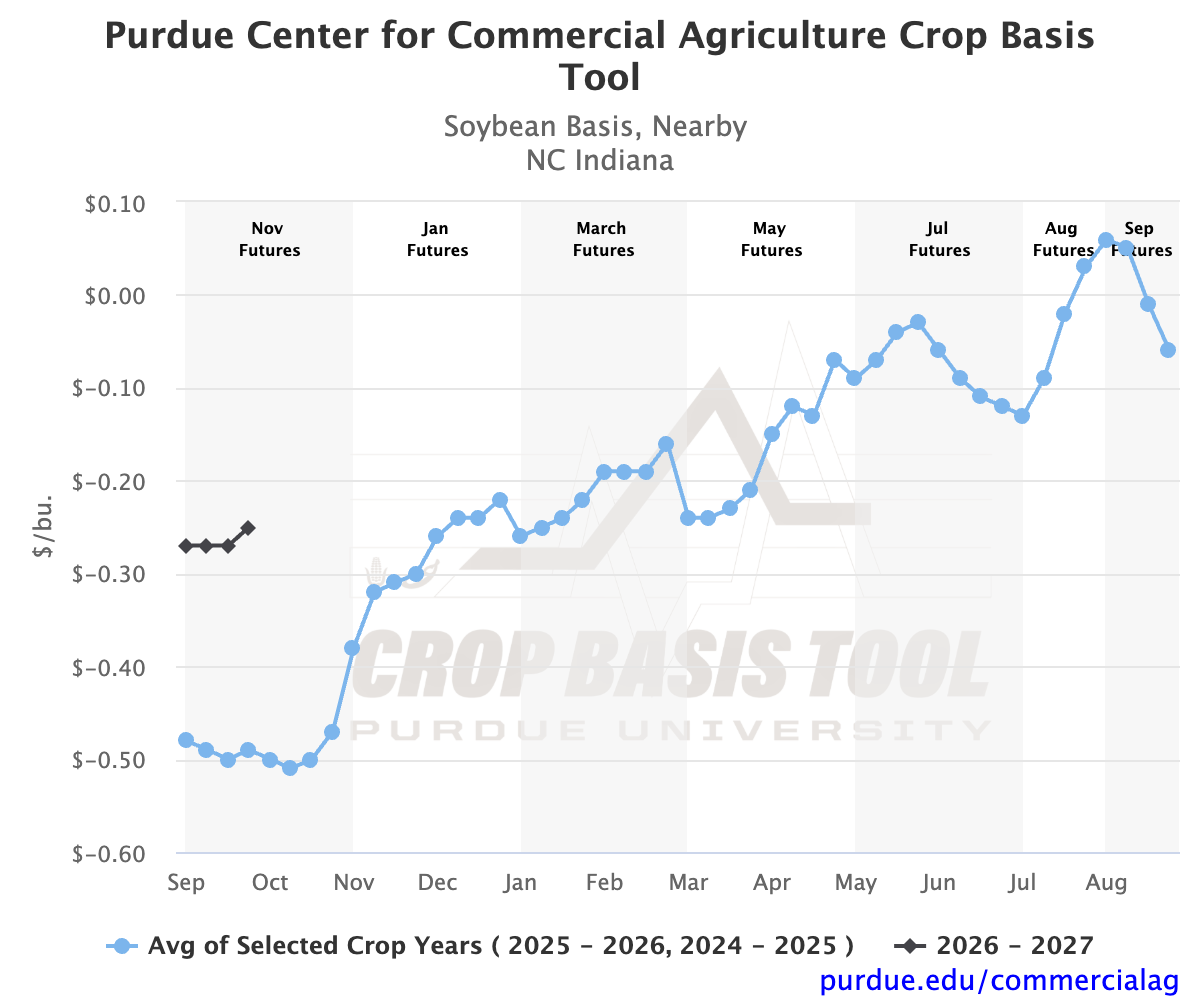
Figure 9. North Central Indiana soybean basis.
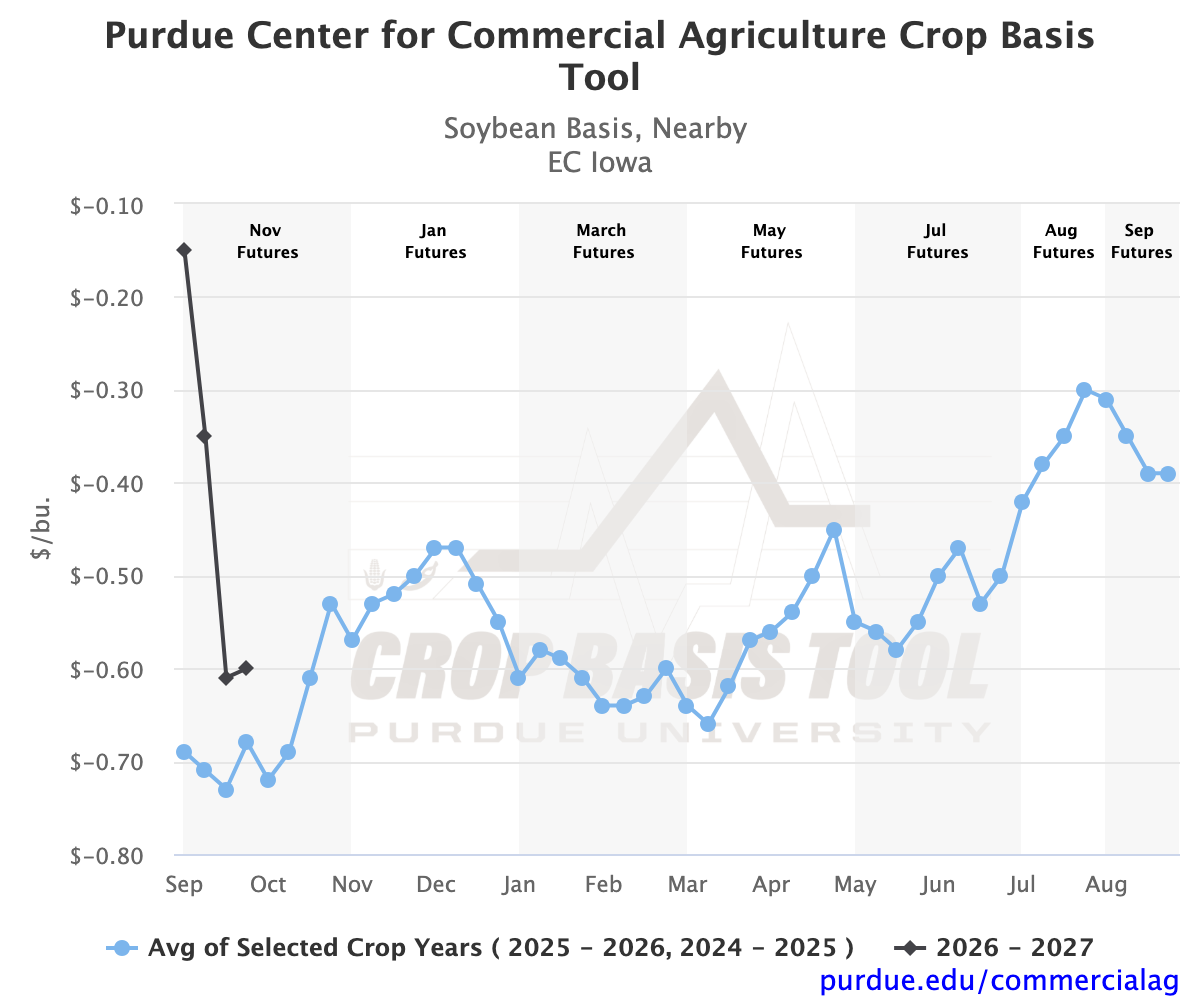
Figure 10. East Central Iowa soybean basis.
Looking Ahead
For anyone marketing grain, basis isn’t the only factor at play. Since the first week of September, December corn futures have fallen $0.14/bu to $5.29 but remain more than $1.00/bu above this time last year. November soybean futures have risen $0.08/bu and are more than $3.00/bu above this time last year. When basis is below its historical average, gains in futures relative to this time last year more than offset those losses, providing some support for local spot prices.
Looking ahead, expect volatility in corn and soybean basis. Corn basis will likely continue to weaken as harvest advances across the region. Using 16 years of data (2010–2025), Belman, Janzen, and Vizcarrondo (2026) found that corn basis typically bottoms in mid-October, around the same week harvest reaches 50% complete, with the low arriving earliest in Illinois. With harvest in the region still well short of that mark, the seasonal low in corn basis may still be ahead. For soybeans, two-year averages suggest that many districts may already have hit the seasonal low and will begin climbing into October. To explore your local crop basis more closely, visit the Purdue Center for Commercial Agriculture’s Crop Basis Tool.
References
Belman, A., J. Janzen, and E. Vizcarrondo. “Under Pressure: The Size and Timing of the Harvest Low in Corn Basis.” farmdoc daily (16):167, Department of Agricultural and Consumer Economics, University of Illinois at Urbana-Champaign, September 17, 2026. https://farmdocdaily.illinois.edu/2026/09/under-pressure-the-size-and-timing-of-the-harvest-low-in-corn-basis.html
U.S. Department of Agriculture, National Agricultural Statistics Service (USDA NASS) Quick Stats. 2026. https://quickstats.nass.usda.gov/
TAGS:
TEAM LINKS:

RELATED RESOURCES
UPCOMING EVENTS
Join educators from across the Midwest to build skills for communicating soil health concepts on Nov. 4-5, 2026. In the field, we’ll evaluate the relationship between soil health and water management focusing on irrigation and edge of field practices. The in-service will have both classroom and on farm demonstrations.
The Land of Opportunity: A Conference for Farmland Owners will be held at two locations on October 5 and October 6, providing farmland owners with valuable information and resources to help them make informed decisions about their land. The conference will feature keynote presentations, educational breakout sessions, and networking opportunities designed specifically for those who own, manage, or have an interest in farmland.