March 12, 2019
Factors Impacting Feeding Cost of Gain and Cattle Finishing Net Returns
by Michael Langemeier
![]()
![]()
![]()
![]()
![]()
A recent article examined the prospects for cattle finishing net returns in 2019 (February 2019). This article elaborates on the factors impacting feeding cost of gain and cattle finishing net returns. After dropping below $75 per cwt in May 2018, feeding cost of gain increased to $80.31 in December. Upcoming acreage decisions will have important ramifications on crop and forage prices, which will in turn, effect feeding cost of gain and net returns. In this article, we will quantify the impacts of changes in corn and alfalfa prices on feeding cost of gain and net returns.
Feeding Cost of Gain
Figure 1 illustrates feeding cost of gain from January 2009 to December 2018. Feeding cost of gain information was obtained from monthly issues of the Focus on Feedlots newsletter (here). Feeding cost of gain averaged $78.10 per cwt. in 2018 ranging from a low of $74.87 in May to a high of $80.31 in December. Given current corn and alfalfa price projections, feeding cost of gain is expected to range from $79 to $82 during the first 6 months of 2019.
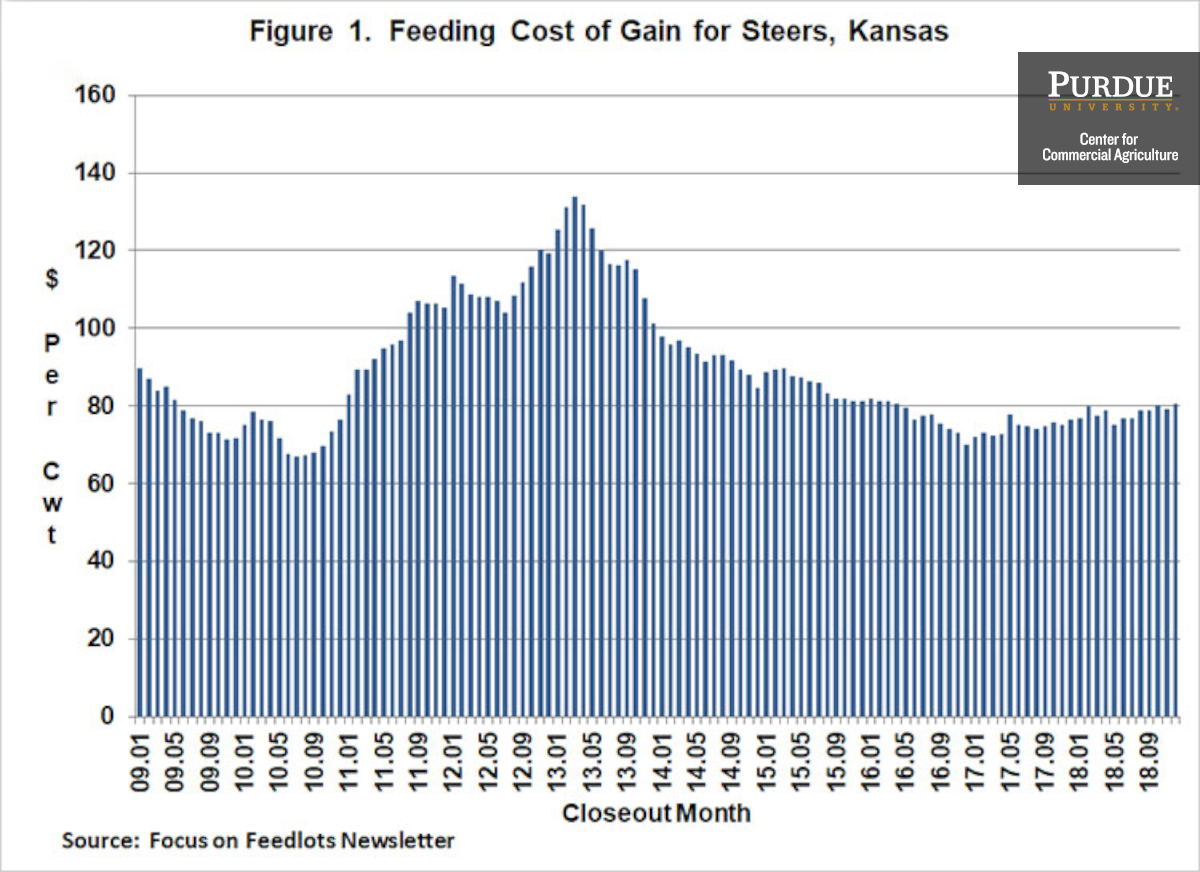
Figure 1. Feeding Cost of Gain for Steers, Kansas
Feeding cost of gain is sensitive to changes in feed conversions, corn prices, and alfalfa prices. Regression analysis using data for the last ten years was utilized to examine the relationship between feeding cost of gain, and feed conversion, corn prices, and alfalfa prices. Results are as follows: each 0.10 increase in feed conversion increases feeding cost of gain by $1.43 per cwt., each $0.10 per bushel increase in corn prices increases feeding cost of gain by $0.87 per cwt., and each $5 per ton increase in alfalfa prices increases feeding cost of gain by $0.55 per cwt.
Feeder to Fed Price Ratio
The ratio of feeder to fed cattle prices for the last ten years is illustrated in Figure 2. Feeder cattle and fed cattle prices were obtained from the Livestock Marketing Information Center (here). During the ten-year period, this ratio averaged 1.20. The feeder to fed price ratio was one standard deviation below (above) this average for 13 (18) months during the ten-year period. The average net return for the months in which the ratio was below one standard deviation of the average was $159 per head. In contrast, the average loss for the months in which the ratio was above one standard deviation was $238 per head. The average ratio for the 18 months with a feeder to fed price ratio that was above one standard deviation of the ten-year average was 1.47. Given current price projections, the feeder to fed price ratio is not expected to reach these levels. However, the projected ratio is expected to remain above the ten-year average for most of 2019, with the exception being June.
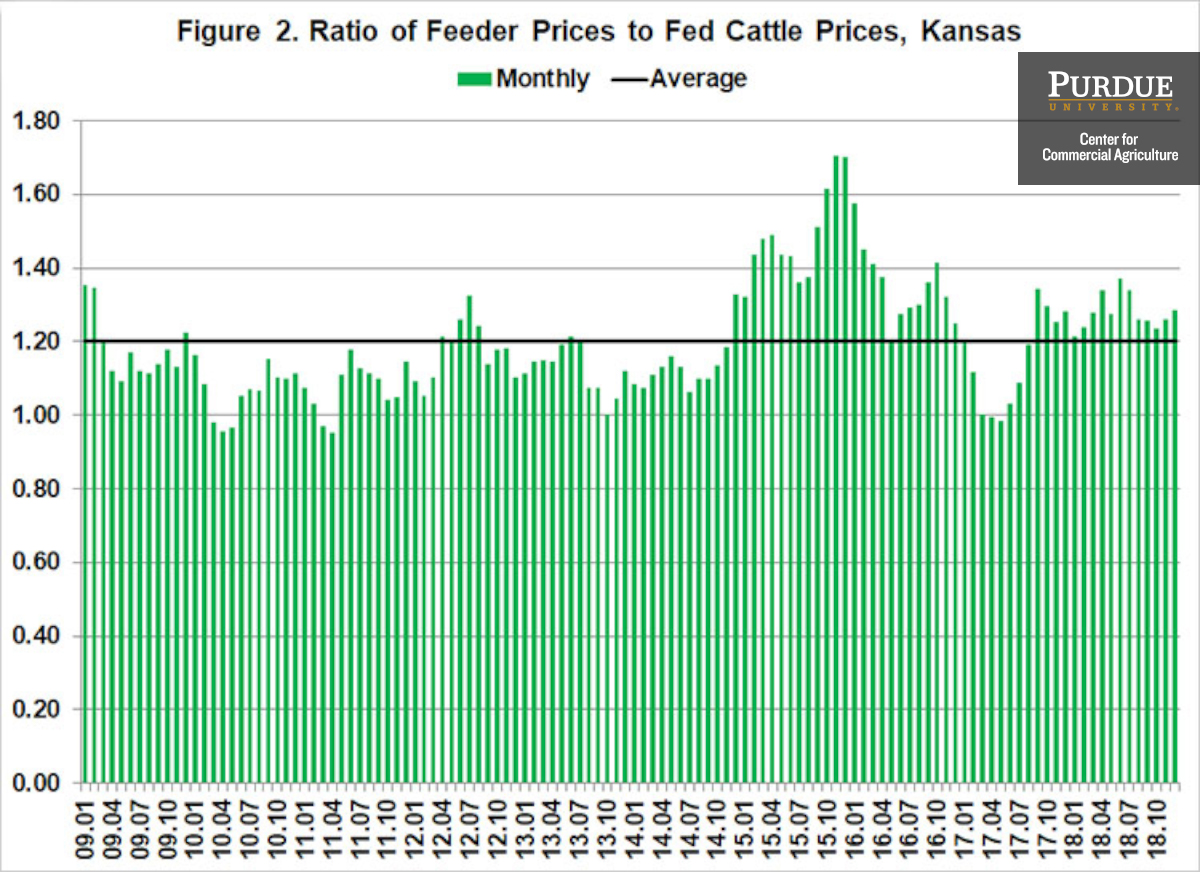
Figure 2. Ratio of Feeder Prices to Fed Cattle Prices, Kansas
As cattle feeders well know, if cattle are not purchased at the “right price”, losses will incur. Given the uncertainty in fed cattle prices, this is easier said than done. The strong correlation coefficient between cattle finishing net returns and the feeder to fed cattle price ratio almost guarantees that losses will occur when this ratio is relatively high.
Cattle Finishing Net Returns
Monthly cattle finishing net returns from January 2009 to December 2018 are presented in Figure 3. It is important to note that net returns were computed using closeout months rather than placement months. Several data sources were used to compute net returns. Average daily gain, feed conversion, days on feed, in weight, out weight, and feeding cost of gain were obtained from the Focus on Feedlots newsletter, feeder cattle and fed cattle prices from the Livestock Marketing Information Center, and interest rates from the Federal Reserve Bank of Kansas City.
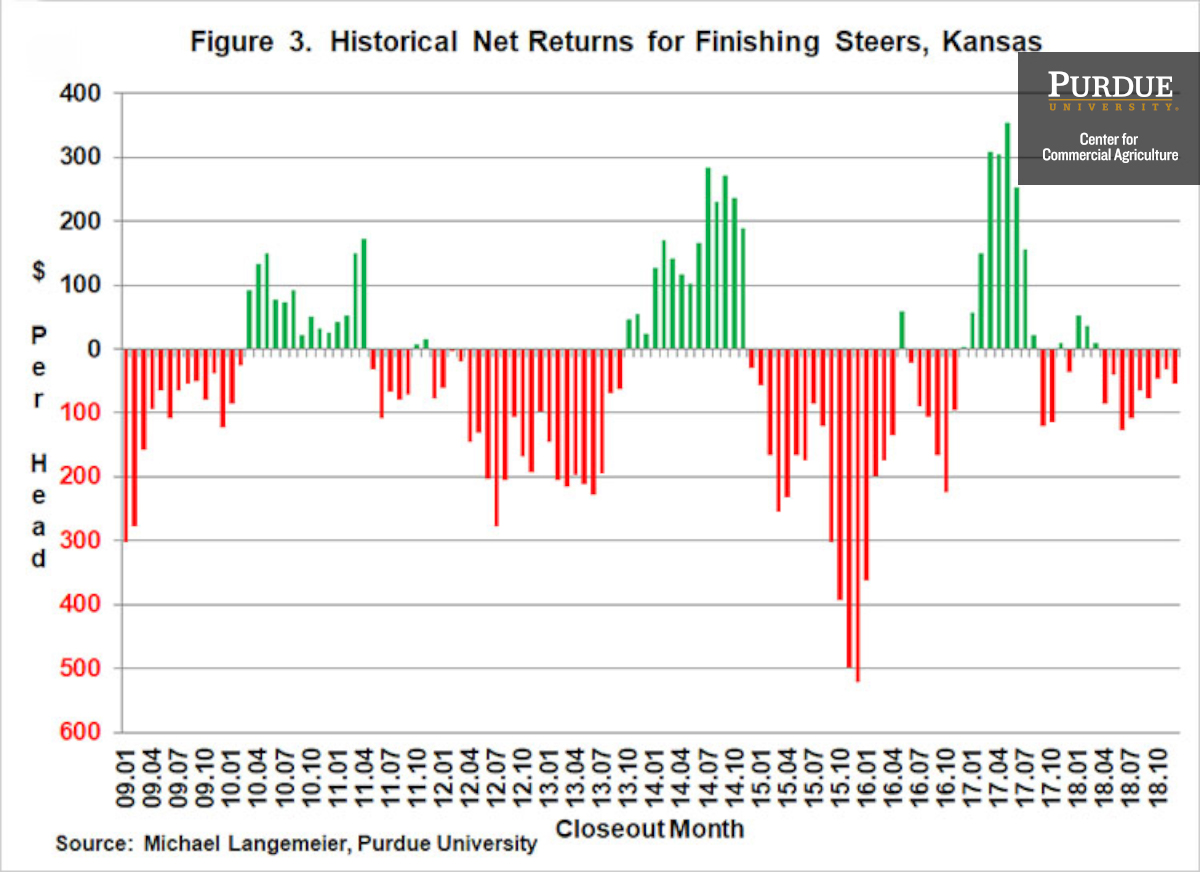
Figure 3. Historical Net Returns for Finishing Steers, Kansas
Net returns averaged $111 per head in 2017 and a negative $45 per head in 2018. Historical and breakeven prices for the last ten years, as well as projected breakeven prices for 2019 are illustrated in Figure 4. Breakeven prices in the first 4 months of 2019 are expected to range from $124 to $127 per cwt. Breakeven prices for the rest of the year are expected to range from $117 to $121.
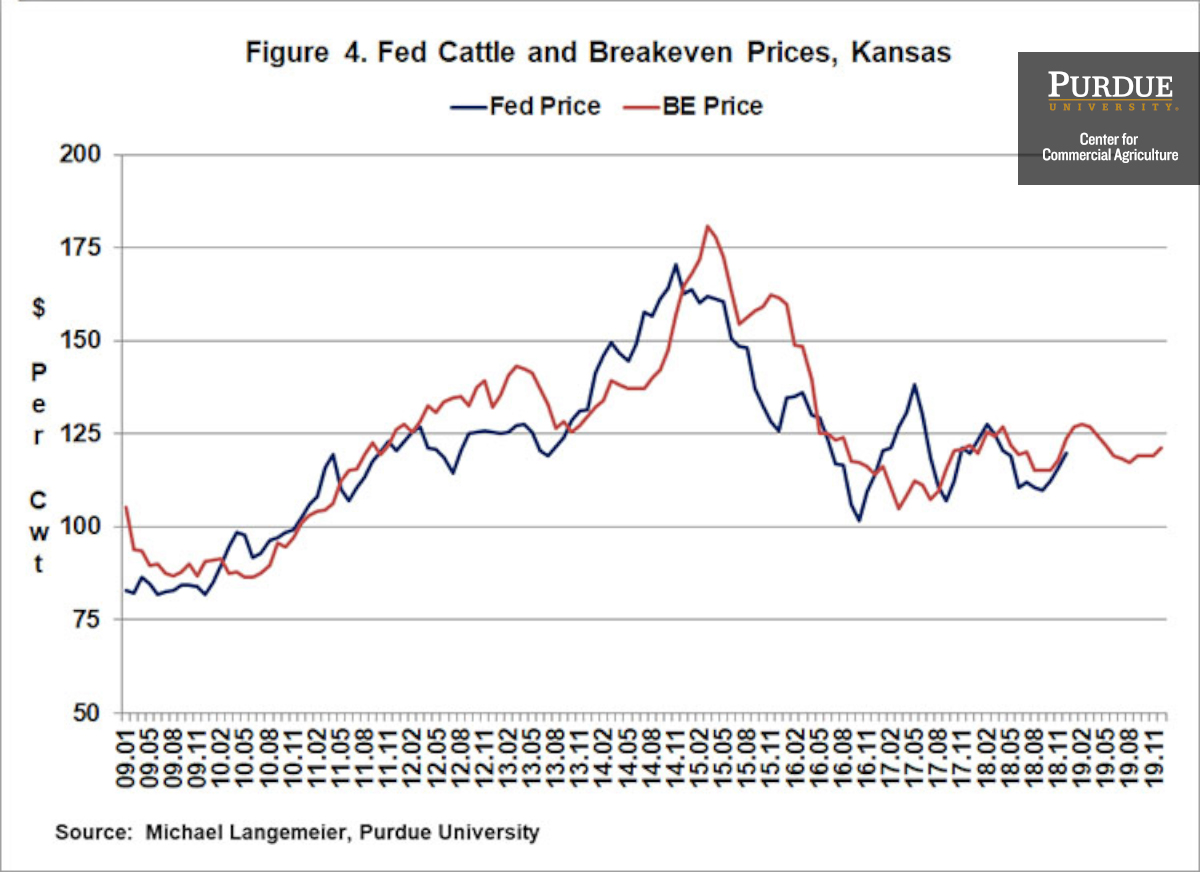
Figure 4. Fed Cattle and Breakeven Prices, Kansas
Correlation coefficients can be used to examine the relationship between net returns, feeding cost of gain, and the feeder to fed cattle price ratio. Correlation is a statistical measure of how variables move together and is bounded by -1.0 and 1.0. A value of -1.0 indicates two variables move together perfectly, but in opposite directions, while a value of 1.0 indicates two variables move up and down together proportionally. Values close to zero indicate two variables have little relationship to each other.
Net returns are significant and negatively correlated with feeding cost of gain (r = -0.230) and the feeder to fed cattle price ratio (r = -0.758). The strong correlation between net returns and the feeder to fed cattle ratio emphasizes the importance of purchasing feeders at the “right price”.
Cattle finishing net returns are sensitive to changes in feeding cost of gain and the feeder to fed cattle price ratio. Regression analysis using data for the last ten years was utilized to examine the relationship between these variables. Results are as follows: each $1 increase in feeding cost of gain results in a decrease in cattle finishing net returns of $3.70 per head, and each 1 percent increase in the feeder to fed cattle price ratio results in a decrease of $8.63 per head in cattle finishing net returns. Using relationships between corn prices, feeding cost of gain, and cattle finishing net returns; a $0.10 increase in corn prices, holding all else constant, would result in a decrease in cattle finishing net returns of approximately $3.20 per head. Similarly, a $10 increase in alfalfa prices would result in a decrease in cattle finishing net returns of approximately $4.05 per head.
Summary and Conclusions
This article examined the impact of changes in corn and alfalfa prices on feeding cost of gain and cattle finishing net returns. Each $0.10 increase in corn price results in a decrease in feeding cost of gain of approximately $0.87 per cwt. and a decrease in net returns of approximately $3.20 per head. Each $10 increase in alfalfa prices results in a $1.10 per cwt. decrease in feeding cost of gain and a decrease of $4.05 per head in net returns. The impact of changes in corn and alfalfa prices on cattle finishing net returns may seem small to some industry observers. It is important note that the impact of changes in corn and alfalfa prices on cattle finishing net returns is dampened by the fact that lower (higher) feed prices typically increase (decrease) feeder prices. These relatively higher feeder prices adversely impact cattle finishing net returns.
References
Focus on Feedlots, Animal Sciences and Industry, Kansas State University, www.asi.k-state.edu/about/newsletters/focus-on-feedlots, accessed March 7, 2019. .
Langemeier, M. “Net Return Prospects for Cattle Finishing in 2019.” Center for Commercial Agriculture, Purdue University, February 2019.
Livestock Marketing Information Center, www.lmic.info, accessed March 7, 2019.
![]()
![]()
![]()
![]()
![]()
TAGS:
TEAM LINKS:

RELATED RESOURCES
AgLease101.org helps both land owners and land operators learn about alternative lease arrangements and includes sample written lease agreements for several alternatives. Ag Lease 101 was created by and is maintained by the North Central Farm Management Extension Committee (NCFMEC).
READ MOREUPCOMING EVENTS
We are taking a short break, but please plan to join us at one of our future programs that is a little farther in the future.