September 8, 2013
The Business Climate for Agriculture: Positioning for Turbulent Times
![]()
![]()
![]()
![]()
![]()
Introduction
A key theme underlying the discussions and presentations at the 2013 Kansas City Federal Reserve Bank Agricultural Symposium – – the Shifting Nexus of Global Agriculture – – was the uncertainty the industry is facing in many dimensions: unpredictable global demand resulting from uncertainty in economic growth around the world; uncertain global supplies because of variability in climatic and weather conditions combined with expanded tillable acres and use of new technology in new production regions; changing public policies concerning biofuels and energy production, international trade and export restrictions, fiscal and monetary stimulus to foster economic growth; funding and investment in the capacity and reliability of the transportation/distribution structure to efficiently and effective move food and agricultural products from producers to end users/consumers, among others.
Given these increasingly complex and interconnected strategic uncertainties characterizing the industry, the admonition of Nassim Nicholas Taleb of Black Swan fame should be remembered – – “black swans” (highly unlikely but critically significant events) cannot be predicted, so the focus should be positioning for the unanticipated surprises with an emphasis on maintaining resiliency and reducing vulnerability rather than trying to predict the future. In that spirit this discussion will focus on the implications of the current and future uncertain market and financial conditions on the resiliency and vulnerability of the farming sector.
The Set-Up
Although the U.S. farming sector has exhibited very strong financial performance during the past 5-7 years in terms of income generation, cash flow and debt servicing capacity, and equity accumulation, that strong performance has been accompanied by increased volatility. This increased volatility is a result of wide fluctuations in crop and livestock product prices, input costs and product output (due to both more variable climatic conditions and losses from increased pest/disease outbreaks) that has created more operational and financial risk for farm businesses. Even though the variability of prices as a percentage of the average price has not changed much compared to the past, higher costs and the fixed nature of some of these costs has increased the variability of both operating margins and net income on both an absolute and relative basis dramatically.
The amount of leverage (debt relative to equity capital) used in the industry has declined over the last two decades, suggesting that the debt servicing risk for the sector is less than it was, for example, in the 1980’s. But industry averages may not accurately reflect the true financial risk for individual firms or even for the industry. Larger scale growing farmers who generate the majority of the agricultural output have leverage positions as reflected by the debt to asset ratio more than double the industry average of 10 percent (Hoppe, et al 2008). And “shadow bank” financing in the form of loans and leases from captive finance companies (for example Deere Financial Service) and merchant and dealer credit from input suppliers is not well documented and is likely under reported in the widely referenced USDA data.
Furthermore, interest rates on debt are at abnormally low levels, and when they rise will increase the debt servicing requirements for farmers who have not converted from variable to fixed rate loan terms. Operating credit lines have increased for many producers, and interest rates on these loans are reset at renewal, and t h u s will increase w h e n market rates rise. Some farmers have signed longer term (3-5 year), high fixed rate cash rent leases to obtain control of land rather than purchase that land–these arrangements result in fixed cash flow commitments irrespective of productivity and prices much like a principal and interest payment on a mortgage. Farmers are also facing more strategic risks than they have in the past–disruptions in market access and supplier relationships including loss of a lender relationship or a landlord, regulatory and policy changes, food safety disruptions and reputation risk, etc.
U.S. agriculture is notorious for its boom and bust cycles and appears to be in the midst of another golden era. Strong global food demand and robust biofuels markets have strained the current production capabilities of global agriculture. The prospects of tight global supplies have spurred booming farm incomes. Historically low interest rates have quickly capitalized these burgeoning incomes into record high farmland values. But past golden eras in agriculture quickly faded – the most recent being the decline in the 1980s from the boom of the 1970s. The promise of sustained global demand shifted with economic conditions, and capital investments in agriculture led to increased agricultural supplies that trimmed farm prices and incomes. At the same time, leaner farm incomes were unable to support the record-high farmland prices, especially at higher interest rates. As a result, many farmers that worked to seize the emerging opportunities were left empty-handed as market and financial conditions changed.
With current high farm net income ($128.2 billion projected for 2013 (USDA, 2013)), far- sighted farmers, lenders, policy makers, and the academic world are asking many “what if” questions: What if commodity prices turn down? What if fertilizer prices continue to increase? What if farmland cash rent continues to increase? What if land values decline? With all the “what if” questions in mind, farmers and economists are concerned about the incidence and intensity of financial stress the farming sector might encounter in the future.
Analysis
To obtain some insight into these questions, the financial performance of illustrative Midwest grain farms with different scales, tenure status, and capital structures was examined under the shocks of volatile crop prices, yields, fertilizer prices, farmland value, and cash rent (Boehlje and Li 2013). Monte Carlo methods were used to generate simulated crop prices and yields, fertilizer prices, farmland value and cash rent for the period from 2012 to 2015. Illustrative farms of 550, 1200, and 2500 acres were constructed reflecting the production activity for these farms with three different farmland ownership structures (15%, 50%, and 85% of land owned) and two capital structures measured by debt-to-asset ratio (25% and 50%). Absolute measures and financial ratios were used to evaluate the income, cashflow, debt servicing and equity position of these illustrative farms.
Given a specific tenure status and capital structure, the percentage of farms that have a positive cash balance after meeting all the financial obligations and family living expense increases with farm size (Table 1). In fact, almost 75% of the smaller farms (550 acres) have a negative cash position by the end of the planning horizon. The percentage with greater than 10% rate of return on equity is also higher for larger acreage farms. Larger farms have better profitability measured by net income and operating profit margin ratio, as well as lower volatility (standard deviation) of these measures. At the end of the simulation period, larger farms have a higher average working capital to value of farm production (WC/VFP) ratio, and a higher percentage of farms with the WC/VFP ratio exceeding 35% (99.9% for the 2500 acre farms compared to only 43.0% for the 550 acre farms). Repayment capacity is also higher for larger farms (87.9% for 2500 acre compared to 22.9% for the 550 acre farms). These results suggest that smaller farms with one- half or more of their farmland rented and even modest leverage (25% debt-to-asset ratio) as is typical with farmers early in their farming career, are very vulnerable to price, cost, yield and asset value shocks. Larger size farms with similar tenure and financial characteristics are much more financially resilient.
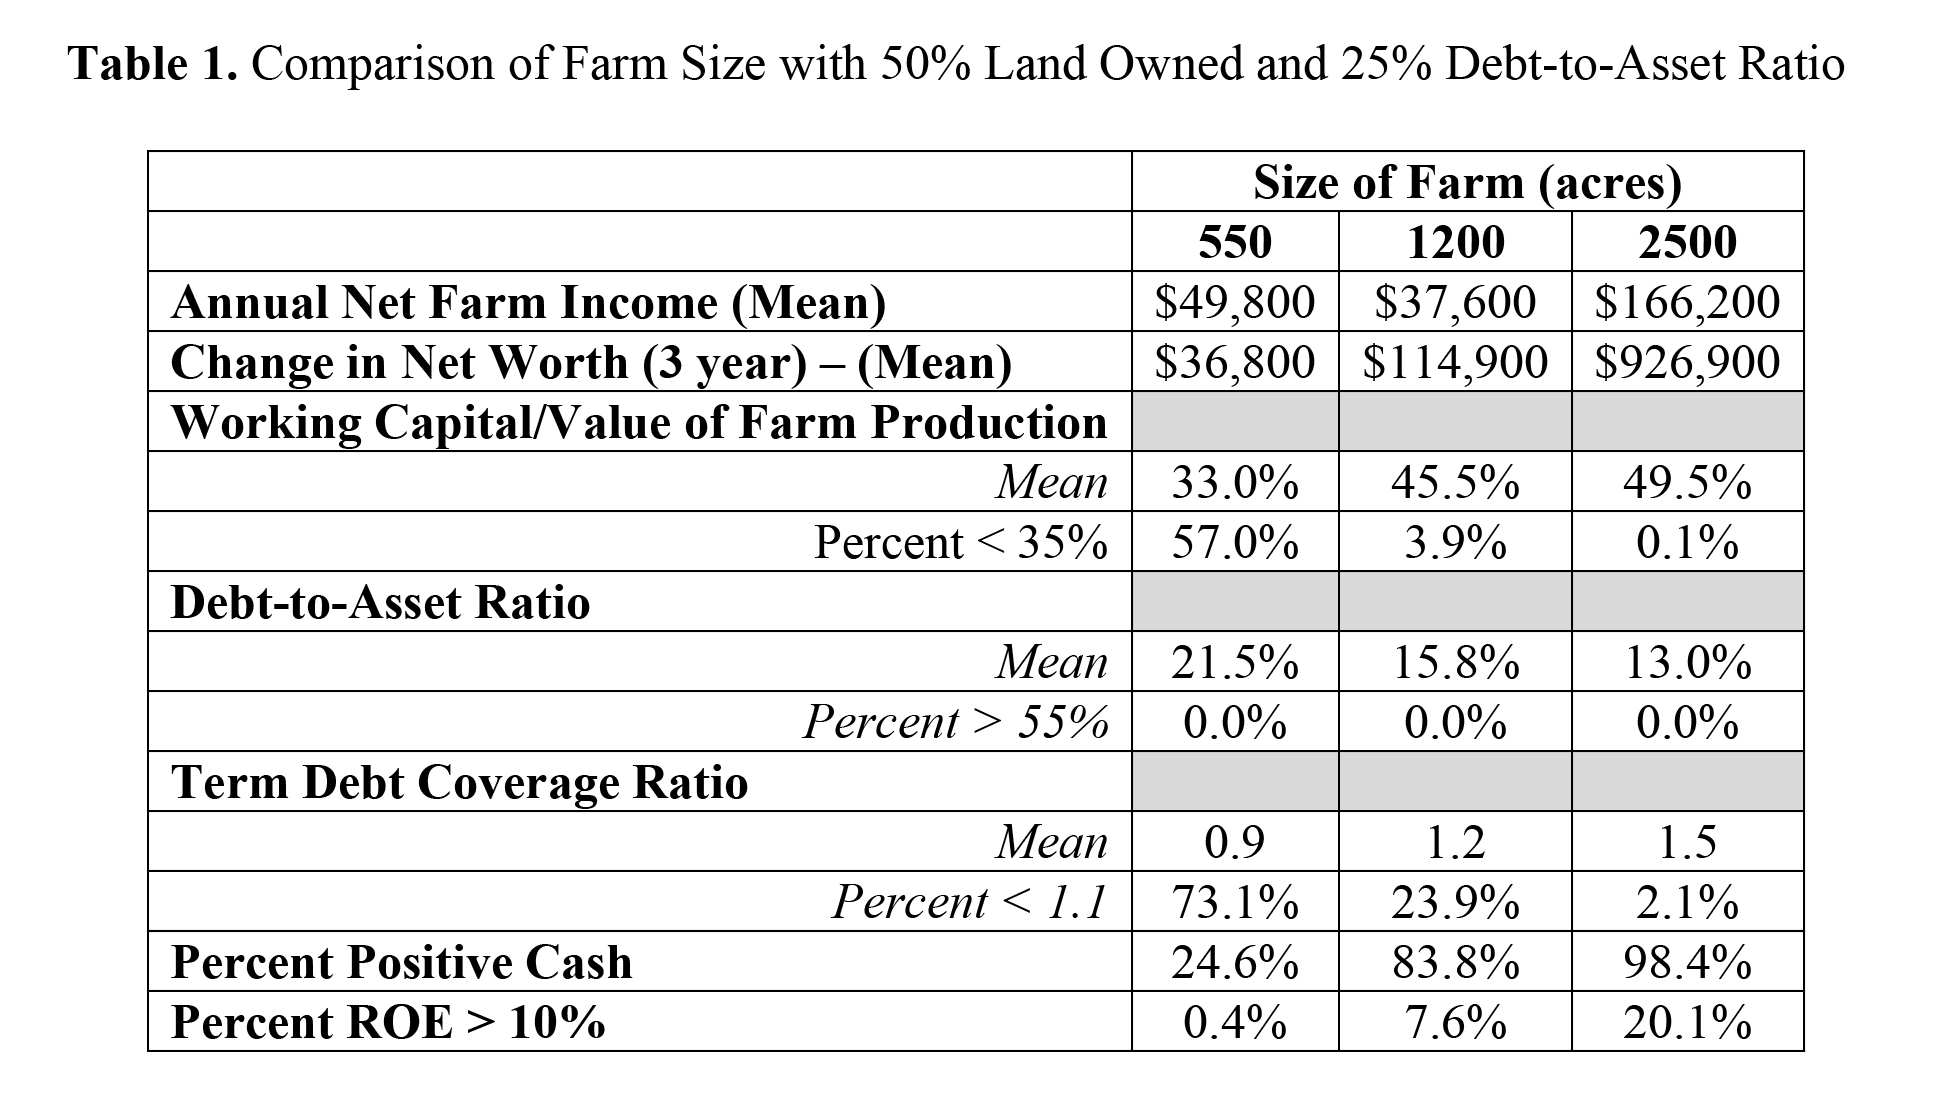
Table 1. Comparison of Farm Size with 50% Land Owned and 25% Debt-to-Asset Ratio
Different land tenure arrangements have a dramatic impact on the vulnerability of the smaller (550 acre) farming operations (Table 2). Those 550 acre farms with 85% of the land they operate owned not only have substantially higher incomes than those who rent a higher proportion of their farmland, they are able to accumulate additional equity over the three year period ($26,000), reduce their leverage position from 25% to 17.1% and have strong working capital and cash positions. In contrast, farms with only 15% of their acreage operated that is owned have negative net income ($2,100), lose equity ($130, 400), increase their leverage position from 25% to 32.6%, and have very weak term debt repayment capacity (an average TDRC of 0.6 with 99.5% less than 1.1). These farms that rent a large proportion of their land are very vulnerable to financial stress from price, cost, yield or asset value shocks even with crop insurance and hedging strategies in place.
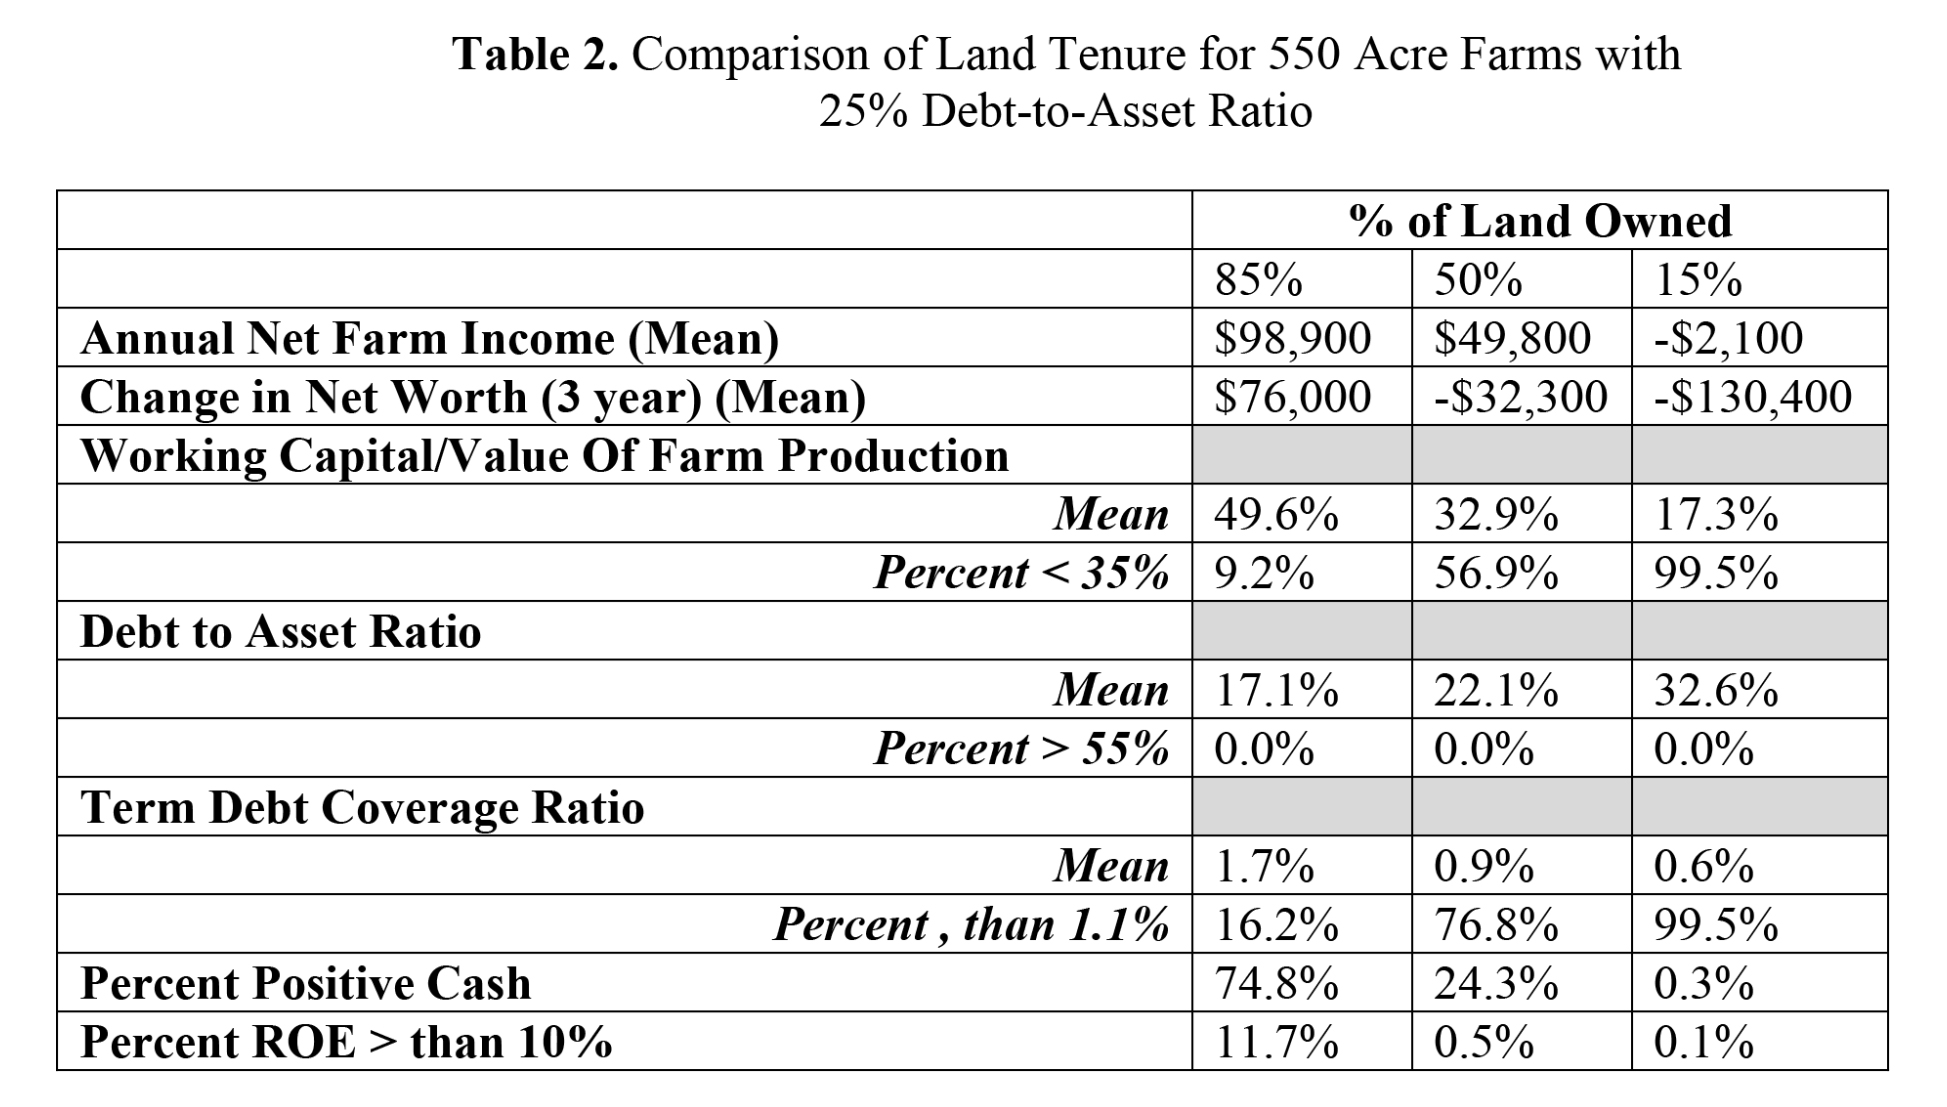
Table 2. Comparison of Land Tenure for 550 Acre Farms with 25% Debt-to-Asset Ratio
As expected, those operations with higher leverage are more vulnerable to price, cost, yield and asset value shocks (Table 3). For the larger farms of 2500 acres with 50% of their land owned, increasing the leverage position from 25% to 50% reduced income only modestly (from $160,500 with a 25% debt-to-asset ratio to $134,800 with a 50% debt-to-asset ratio); and equity accumulation even less (only $15,800 less change in net worth). Thus, larger farms as characterized in this study have only modest vulnerability to higher leverage positions and more resilience to shocks in prices, costs, yields and asset values.
These “stress test” results suggest that the financial vulnerability and resiliency of Midwest grain farms to price, cost, yield and asset value shocks are, not surprisingly, dependent on their size, tenure and leverage positions. Farms with modest size (i.e. 550 acres) and a large proportion of their land rented are very vulnerable irrespective of their leverage positions. These same modest size farms are more financially resilient if they have a higher proportion of their acreage that is owned rather than rented. Large size farms with modest leverage (25% debt-to-asset ratio) that combine rental and ownership of the land they operate have strong financial performance and limited vulnerability to price, cost, yield and asset value shocks. And these farms can increase their leverage positions significantly (from 25% to 50% in this study) with only modest deterioration in their financial performance and a slight increase in their vulnerability. These results suggest that the perspective that farmers are resilient to price, cost, yield and asset value shocks because of the current low use of debt in the industry (an average of approximately 10% debt-to-asset ratio for the farming sector) does not adequately recognize the financial vulnerable of many typical family farms to those shocks.
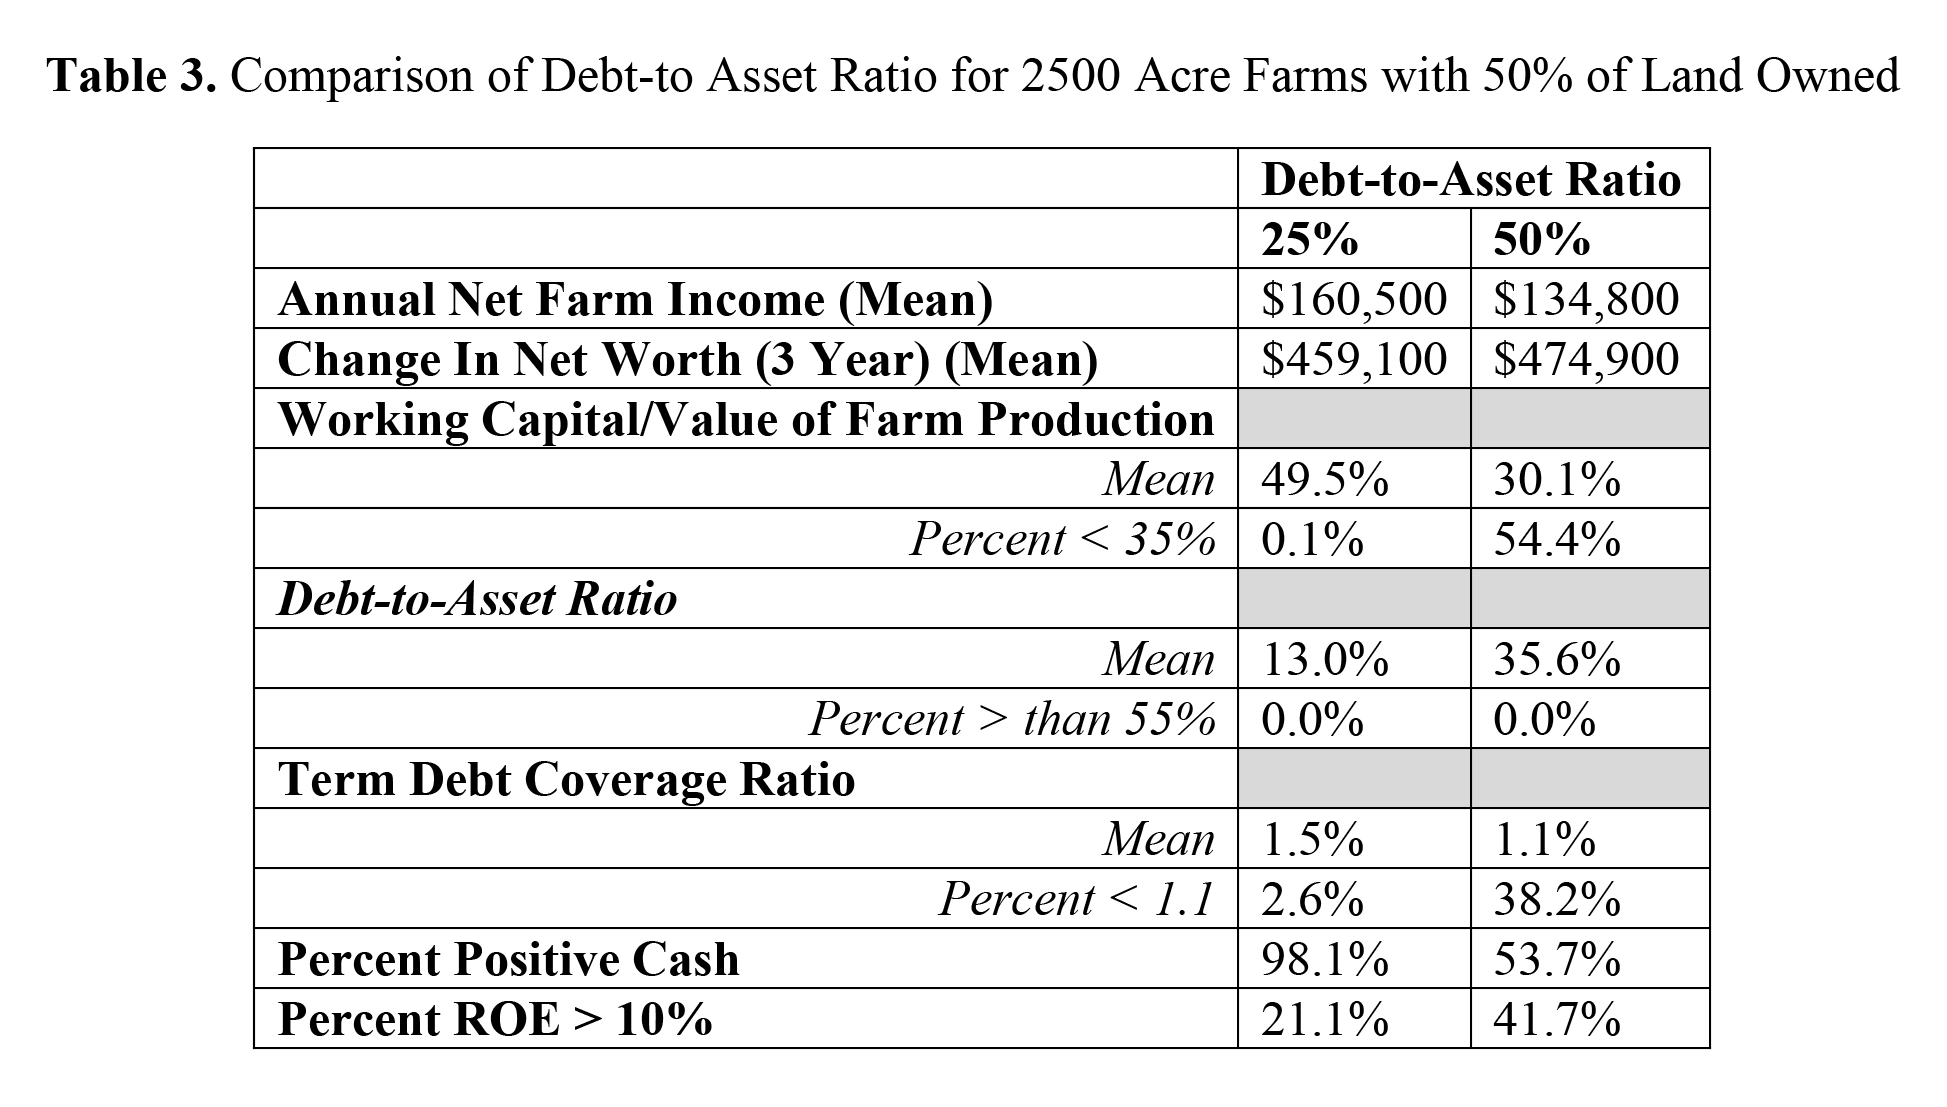
Table 3. Comparison of Debt-to-Asset Ratio for 2500 Acre Farms with 50% of Land Owned
The Insights
What insights does this “stress test” analysis provide concerning the current period of prosperity in agriculture and the prospects for a bust? How might future events evolve that would create a 1970’s-80’s boom- bust cycle?
Similar to past farm booms, today’s low interest rates have fostered the capitalization of rising farm incomes into record high farmland values. Accommodative monetary policy by the Federal Reserve has pushed nominal interest rates to historic lows. The capitalization of incomes into farmland values has accelerated, with the average price of U.S. farmland rising 25 percent from 2004 to 2011. The surge in U.S. farmland prices has outpaced the rise in cash rents. In fact, the average farmland price-to-cash rent multiple, which is similar to a price-to- earnings ratio on a stock, has surged to a record high of almost 30 in various Corn Belt states (Baker, et al 2013).
As noted earlier U.S. farm debt accumulation has not accelerated as it did during the 1970s.
But the financial markets do present a future risk to farm debt use and leverage. Higher interest rates could have two distinct impacts on U.S. agriculture (Henderson and Briggeman). Rising interest rates may place upward pressure on the dollar, which could indirectly trim U.S. agricultural exports, farm profits, and farmland prices. In addition, higher interest rates also boost the capitalization rate, which weights further on farmland prices. The impacts are compounded in highly leveraged environments when higher interest rates raise debt service burdens, as the 1920s and 1980s demonstrated.
And the distribution of debt among farmers is important. Recent analysis of the financial condition of farmers indicates that those who are younger (less than 35 years of age) have significantly higher debt loads and debt to asset ratios than the industry average. (Briggeman 2011; Ellinger 2011). And as indicated earlier, larger and rapidly growing farmers are more highly leveraged than the industry average. A future risk is that farmers could be increasing their leverage just as export growth and farm profits begin to slow.
Where to From Here?
How might events evolve from here? Farmers are likely to continue to be aggressive in buying land and bidding up land prices to not only acquire the income stream from that land, but also to capture the wealth effect benefits of capital gains resulting from rising land values. And the wealth effect doesn’t just show up in land purchases – – farmers are encouraged to continue to buy more machinery and facilities because of the wealth they have accumulated from rising land values. These purchases are most likely made by larger growth oriented farmers who have higher leverage positions. Even if they have sufficient cash to make sizeable down payments, these transactions change the structure of the balance sheet by reducing current assets while increasing non- current assets, and adding to current liabilities by the amount of the annual principal and interest debt servicing requirement. Thus, the liquidity position of the business as defined by working capital or the current asset/current liability ratio is reduced, making these firms more vulnerable to income shocks.
At the same time, farmers who are expanding rapidly have also been aggressive bidders in the land rental market — fixed cash rental arrangements have become increasingly common and many of these agreements are for multiple years (3-5 years) at relatively high fixed rates.
These high multi-year cash rents result in increased future fixed cash costs much like mortgage obligations on land debt. These “pseudo-debt” financial obligations are typically not reported on the balance sheet, but they are similar to capital lease obligations which increase the leverage and typically reduce the working capital/liquidity position of the business. Strong cash positions and concerns about high tax liabilities have also resulted in significant purchases of depreciable machinery and equipment, which has again moved assets from the current to non-current category without restructuring the liabilities, thus creating an additional imbalance in the balance sheet. And the higher prices of fertilizer, seed, chemicals and fuel have resulted in larger operating lines, which increases the leverage and reduces the liquidity position further yet.
This increasingly misaligned balance sheet with a higher portion of current vs. non-current liabilities contrasted with a lower portion of current vs. non-current assets increases the vulnerability of the business to income shocks from lower prices, lower yields or higher costs. Such shocks would decrease margins and cash flows as well as inventory positions, and could quickly result in a working capital position below lender underwriting standards. A typical response of the lender in this situation is to suggest liquidating inventories and using the proceeds to reduce operating debt. But for farmers who file Schedule F tax returns, this could trigger significant tax obligations (the tax basis in raised grain and livestock for Schedule F tax-filers is zero, so the full proceeds at sale are taxed as ordinary income) which reduces the liquidity position even further.
An alternative lender response is to restructure the debt and move some of the current obligations to non-current using the appreciated value of farmland as security. This approach in essence results in leveraging the capital gain in farmland – the leverage effect of capital gains. Lenders who may have previously resisted increasing loan to value ratios on farmland purchases to limit increased debt utilization by farmers paying higher and higher prices for farmland will now be encouraged to monetize capital gains in land by extending additional credit based on the higher land values. Higher land values and resulting increased equity positions would appear to provide adequate security and secondary repayment capacity to support the larger debt load, but the debt per dollar of revenue generated from the land will be higher if the income shock is permanent rather than temporary. The business is now very vulnerable to further income shocks or asset value deterioration — the working capital position has been destroyed and credit reserves have been fully used. Permanently lower incomes and/or higher interest rates will not only create debt servicing problems, but also reduce the discounted cash flow and thus weaken the demand for farmland. If debt servicing problems result in forfeitures or foreclosures in the farmland market, additional properties are likely to be offered to the market, and weakening demand and increased offerings (or forced sales) are likely to result in reduced farmland values.
Livestock producers may be even more vulnerable to income shocks than grain farmers. The significant losses suffered by both pork and dairy farmers in particular during the 2007-2009 period, substantially reduced the equity and working capital positions of many of these businesses. Some producers covered these losses with increased operating or term debt, thus increasing their leverage positions. Although profits improved significantly in 2010 and 2011, they have not been sufficient to rebuild equity and working capital positions. And asset values for specialized livestock facilities and breeding stock declined dramatically during the period of large losses, resulting in further deterioration of solvency and secondary repayment positions. These values have recovered only modestly from those distressed levels, so many livestock producers are very vulnerable to not meet lender liquidity/working capital as well as solvency underwriting standards even with modest price reductions or cost increases.
So What?
The sequence of events just described characterized the 1970’s-80s for the U.S. farming sector, resulting in a strong boom and a dramatic bust in financial performance and land values. Today we appear to be in the late stages of the boom – incomes are moderating and the wealth effect as a driver of land purchases remains muted. If incomes strengthen and/or the “wealth effect” becomes stronger (or both), land prices and capital asset purchases could continue to rise rapidly resulting eventually in more serious liquidity and working capital problems if/when income shocks occur. Even though lenders may be conservative in their credit policies, liquidity/working capital pressures could result in increased refinancing of land debt — the leverage effect. The end result would be a bust much like the 1980’s. Mitigating this end result requires continued muting of the wealth effect, maintaining or rebuilding the working capital of farm businesses and preempting the leverage effect.
References
Baker, T et al; 2013. “Farmland Price to Earnings Ratios for Indiana” Center for Commercial Agricultural Business, Purdue University
Boehlje, M.; and Li, S. 2013 “Financial Vulnerability of Midwest Grain Farms: Implications of Price, Yield and Cost Shocks” Staff Paper #13-1 ,Department of Agricultural Economics, Purdue University
Briggeman, B.C. 2011. “The Importance of Off-Farm Income in Servicing Farm Debt” Economic Review, Federal Reserve Bank of Kansas City, First Quarter, pp. 63-82.
Ellinger, P. 2011. “Weathering Unexpected Downturns in Agriculture’ Proceedings at the 2011 Agricultural Symposium, Federal Reserve Bank of Kansas City http://www.kansascityfed.org/publicat/rscp/Session3.pdf
Henderson, J. and Briggeman, B., 2011, “What are the Risks in Today’s Farmland Market?” The Main Street Economist, Federal Reserve Bank of Kansas City
Hoppe, R. et al 2008. “Million-Dollar Farms in the New Century” Economic Information Bulletin 42, Economic Research Service USDA
![]()
![]()
![]()
![]()
![]()
TAGS:
TEAM LINKS:
RELATED RESOURCES
UPCOMING EVENTS
We are taking a short break, but please plan to join us at one of our future programs that is a little farther in the future.