May 7, 2020
Impact of COVID-19 on Cattle Finishing Net Returns
by: Michael Langemeier
![]()
![]()
![]()
![]()
![]()
COVID-19 has resulted in a dramatic decline in fed cattle prices putting a damper on net return prospects for 2020. In an article published in early January (here), we were expecting net returns to average approximately $40 per head in the first quarter and approximately $10 per head in the second quarter of 2020. As discussed below, first quarter net returns were a negative $10 per head, and the prospects for the second quarter are very dismal. In addition to discussing net return prospects, this article discusses trends in feeding cost of gain, the feeder to fed price ratio, and breakeven prices.
Several data sources were used to compute net returns. Average daily gain, feed conversion, days on feed, in weight, out weight, and feeding cost of gain were obtained from monthly issues of the Focus on Feedlots newsletter (here). Futures prices for corn and seasonal feed conversion rates were used to project feeding cost of gain for the next several months. Net returns were computed using feeding cost of gain from monthly issues of the Focus on Feedlots newsletter, fed cattle prices and feeder cattle prices reported by the Livestock Marketing Information Center (LMIC) (here), and interest rates from the Federal Reserve Bank of Kansas City.
Feeding Cost of Gain
Figure 1 illustrates monthly feeding cost of gain from January 2010 to March 2020. Feeding cost of gain averaged $84.37 per cwt. in 2019 ranging from a low of $81.61 in October to $91.67 in March. During the first 3 months of 2020, feeding cost of gain averaged approximately $83.25 per cwt. Given current corn and alfalfa price projections, feeding cost of gain is expected to drop substantially later this year. In the second quarter, average feeding cost of gain is projected to be approximately $77.00. For the third and fourth quarters of this year, average feeding cost of gain is projected to be approximately $71.75. Feeding cost of gain is sensitive to changes in feed conversions, corn prices, and alfalfa prices. Regression analysis was used to examine the relationship between feeding cost of gain, and feed conversion, corn prices, and alfalfa prices. Results are as follows: each 0.10 increase in feed conversion increases feeding cost of gain by $1.24 per cwt., each $0.10 per bushel increase in corn prices increases feeding cost of gain by $0.88 per cwt., and each $5 per ton increase in alfalfa prices increases feeding cost of gain by $0.50 per cwt.
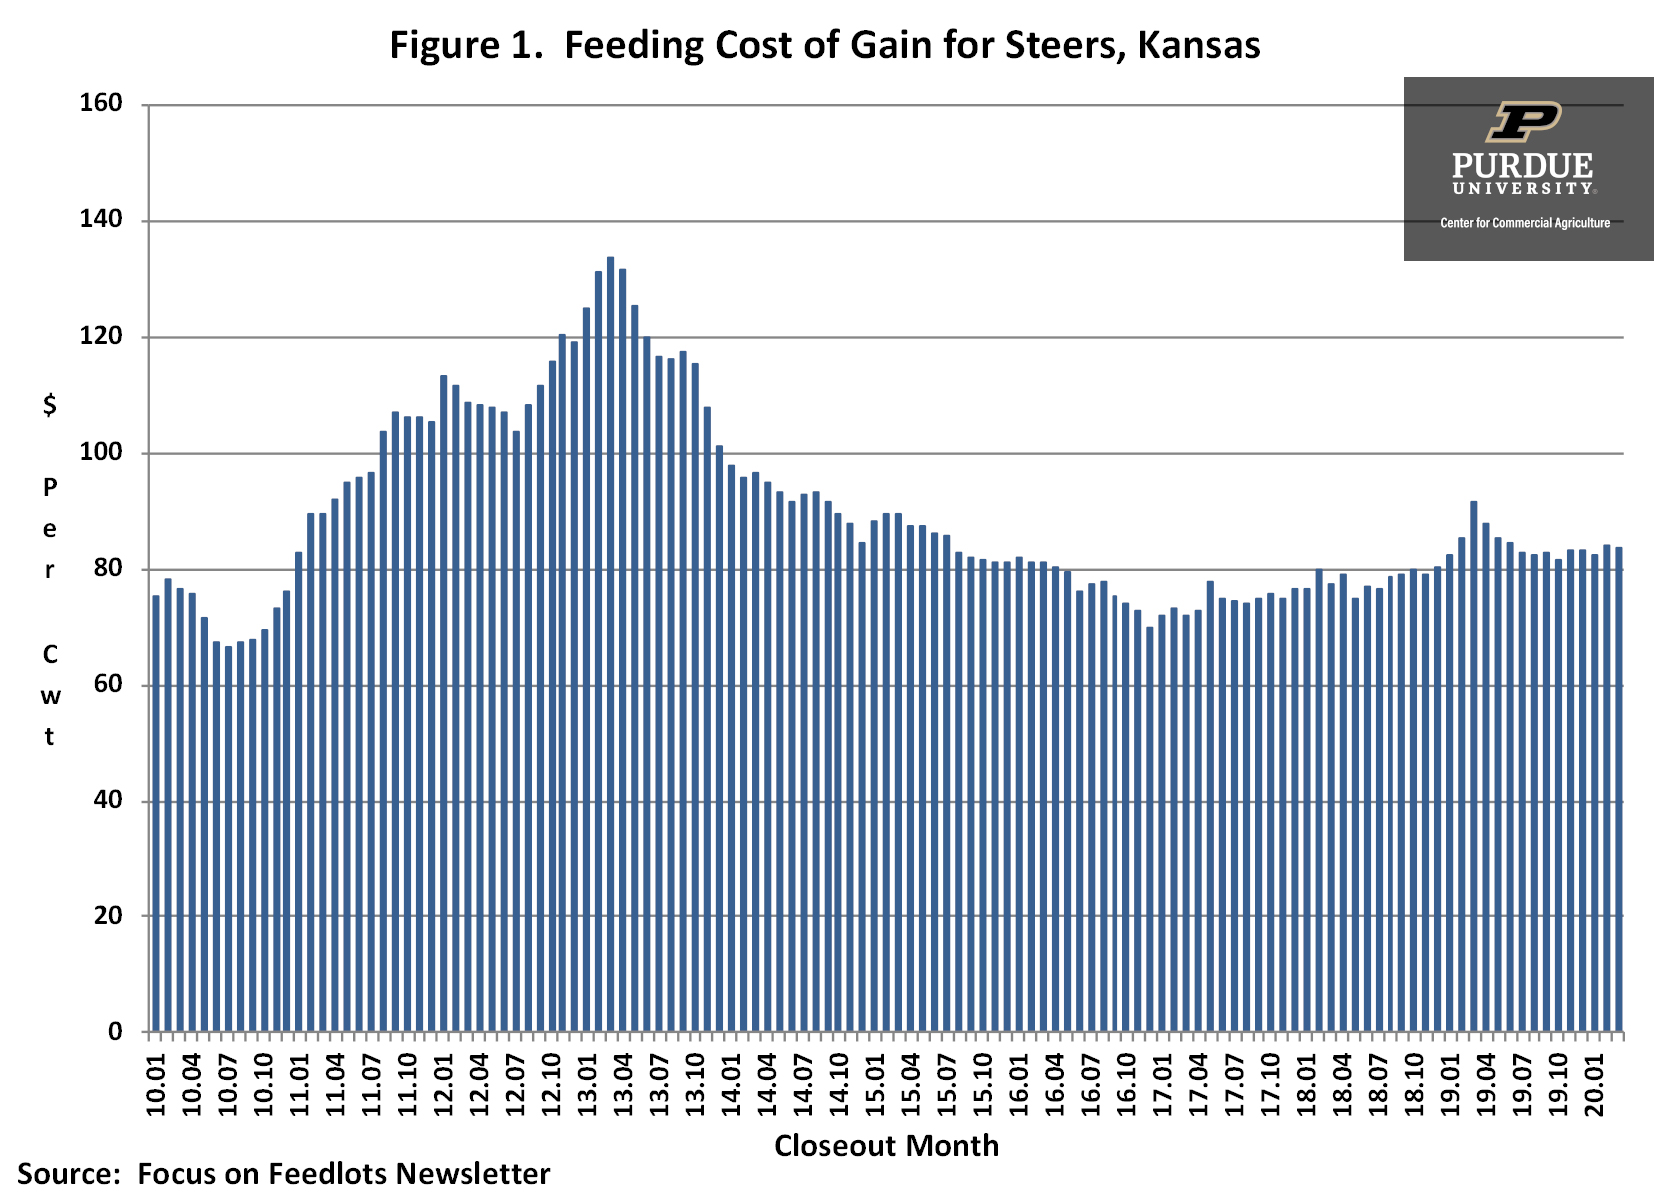
Figure 1. Feeding Cost of Gain for Steers, Kansas
Feeder to Fed Cattle Price Ratio
The ratio of feeder to fed cattle prices since 2010 is illustrated in figure 2. During the ten-year period, this ratio averaged 1.21. The feeder to fed price ratio was one standard deviation below (above) this average for 16 (17) months during the ten-year period. The average net return for the months in which the ratio was below one standard deviation of the average was $135 per head. In contrast, the average loss for the months in which the ratio was above one standard deviation was $256 per head. The average ratio for the 17 months with a feeder to fed price ratio that was above one standard deviation of the ten-year average was 1.49. The feeder to fed cattle ratio averaged 1.22 in the first quarter of this year. Since late March, fed cattle prices have dropped from $119 per cwt. to $98 per cwt., or 18 percent. As a result, the feeder to fed cattle ratio in the second quarter of this year is expected to increase sharply, from 1.22 in the first quarter to 1.45 in the second quarter. Using current LMIC fed cattle price projections, the feeder to fed cattle ratio in the third and fourth quarters is expected to be 1.23 and 1.06, respectively.
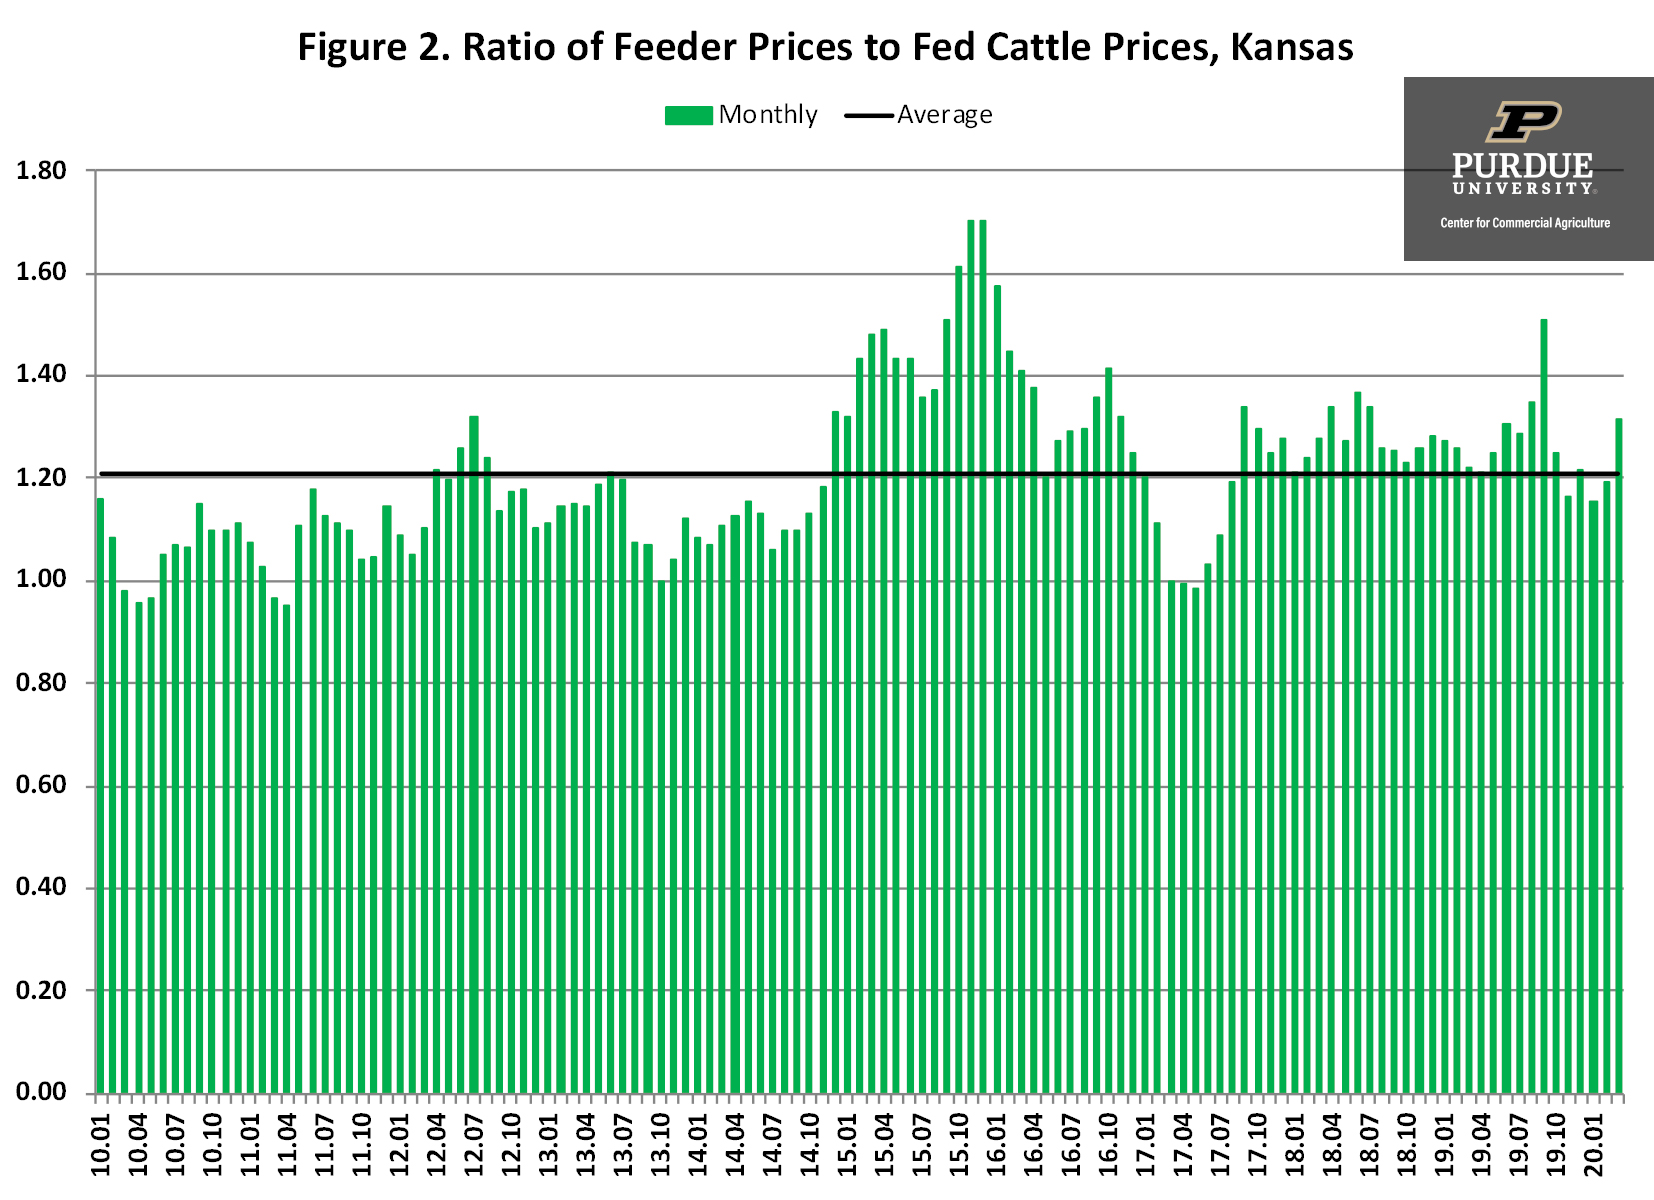
Figure 2. Ratio of Feeder Prices to Fed Cattle Prices, Kansas
Net Return Prospects
Monthly steer finishing net returns from January 2010 to March 2020 are presented in Figure 3. It is important to note that net returns were computed using closeout months rather than placement months. Net returns averaged a negative $80 per head in 2019. Net losses in the first quarter of this year averaged $10. The spread of COVID-19 resulted in a $50 per head decline in expected net returns for the first quarter, with most of the impact occurring in March. The anticipated impact of COVID-19 in the second quarter is substantially larger. In early January, we projected that net returns per head in the second quarter of this year would be approximately $10. The large drop in fed cattle prices and subsequent increase in the feeder to fed cattle ratio has resulted in a substantial revision in our projections for the second quarter. Unless fed cattle prices increase from their current levels, net losses in the second quarter could average more than $250 per head, with the largest losses expected to occur in May. This is a shift in our net return projections for the second quarter of $260 per head!

Figure 3. Historical Net Returns for Finishing Steers, Kansas
Before examining net return prospects for last six months of this year, we will discuss breakeven prices. Historical and breakeven prices for the last ten years, as well as projected breakeven prices through 2020, are illustrated in figure 4. Breakeven prices in the first quarter of this year averaged approximately $119 per cwt. Breakeven prices in the second quarter are expected to range from $118 to $121 per cwt. For the third and fourth quarters, breakeven prices are expected to average approximately $107 and $102, respectively. Combining these breakeven prices for the third and fourth quarters with LMIC fed cattle price projections results in expected losses ranging from $25 to $50 per head in the third quarter and expected positive net returns exceeding $100 per head in the fourth quarter. We would be remiss if we did not caution the reader regarding the projections for the second half of 2020. The amount of uncertainty in the current market environment is extremely high.
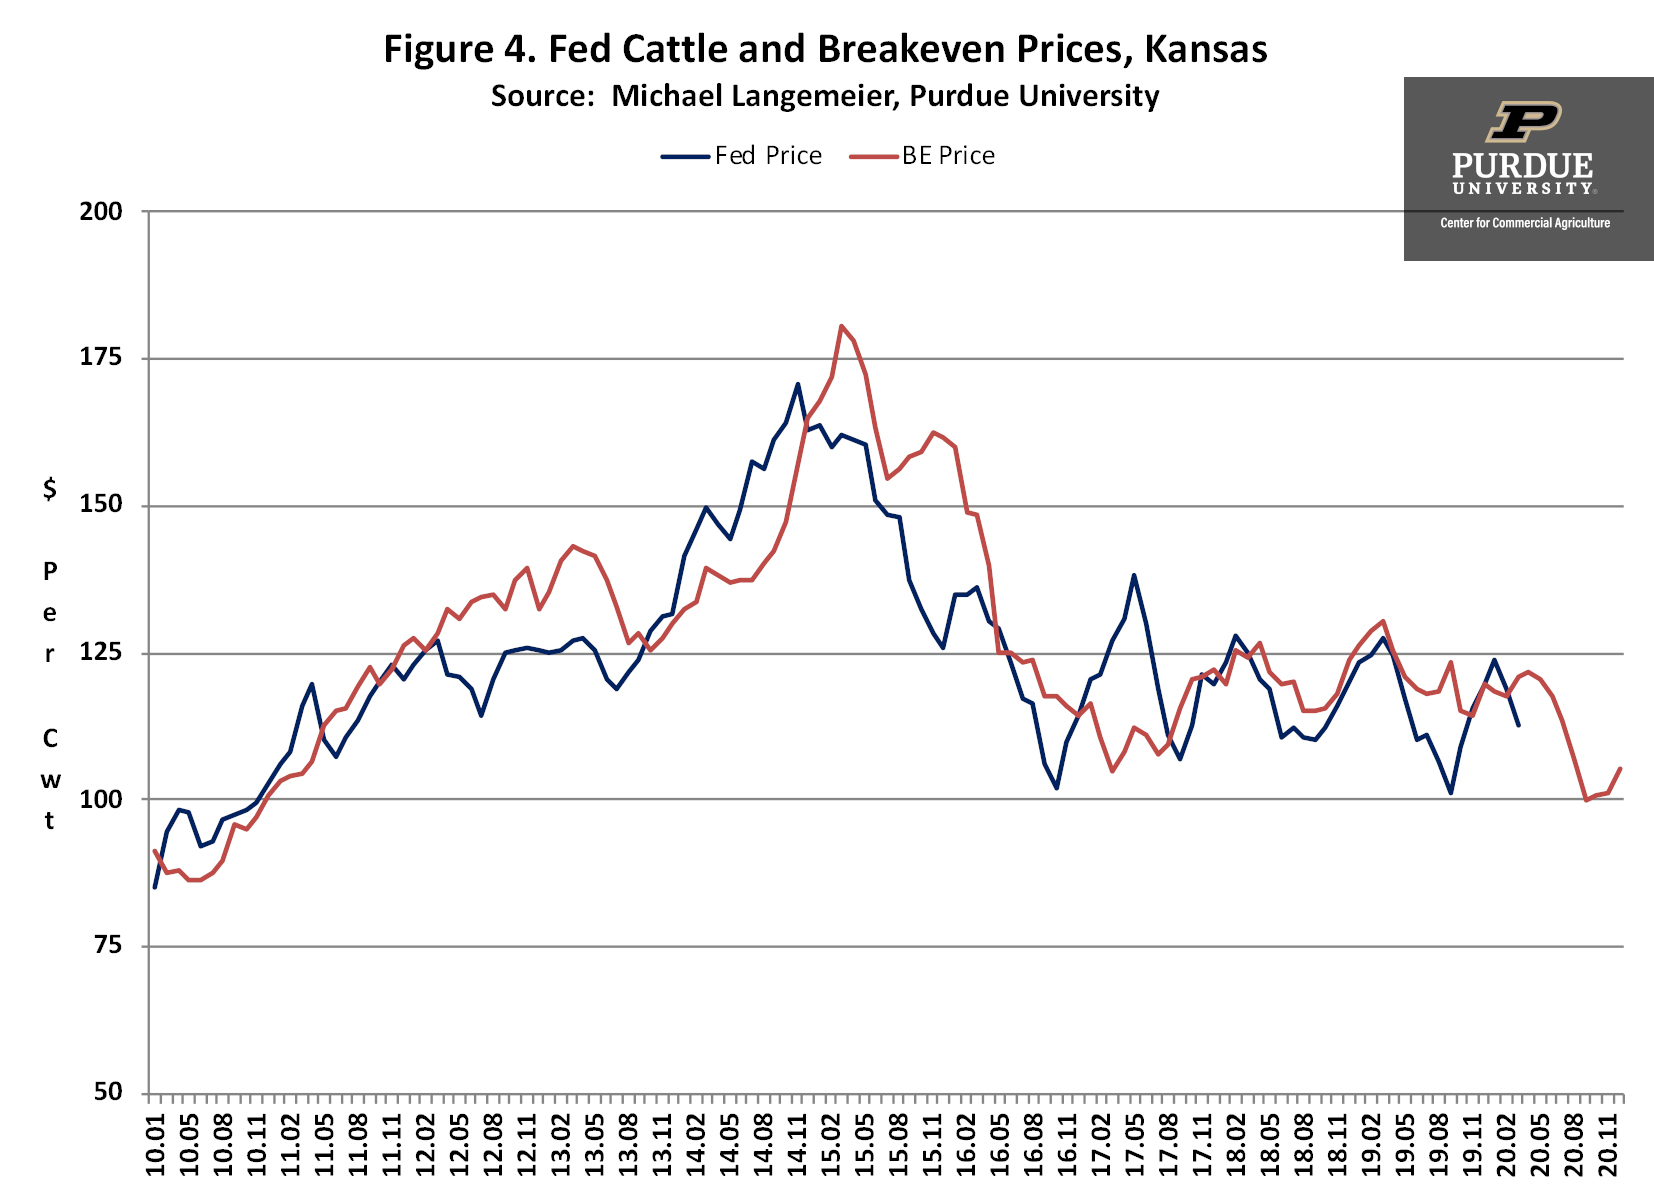
Figure 4. Fed Cattle and Breakeven Prices, Kansas
Conclusions
This article discussed recent trends in feeding cost of gain, the feeder to fed price ratio, breakeven prices, and cattle finishing net returns. Average cattle finishing losses in 2019 were estimated to be approximately $80 per head. Average losses in the first quarter of this year were approximately $10 per head. Current breakeven and fed cattle price projections suggest that large losses will occur in the second quarter. Though highly uncertain, prospects for the remainder of 2020 look much better.
Citations
Focus on Feedlots, Animal Sciences and Industry, Kansas State University, www.asi.k-state.edu/about/newsletters/focus-on-feedlots, accessed May 5, 2020.
Langemeier, M. “Cattle Finishing Net Return Prospects for 2020.” Center for Commercial Agriculture, Department of Agricultural Economics, Purdue University, January 2020.
Livestock Marketing Information Center, www.lmic.info/, accessed May 5, 2020.
![]()
![]()
![]()
![]()
![]()
TAGS:
TEAM LINKS:

RELATED RESOURCES
AgLease101.org helps both land owners and land operators learn about alternative lease arrangements and includes sample written lease agreements for several alternatives. Ag Lease 101 was created by and is maintained by the North Central Farm Management Extension Committee (NCFMEC).
READ MOREUPCOMING EVENTS
We are taking a short break, but please plan to join us at one of our future programs that is a little farther in the future.