October 12, 2020
Examining Trends in Liquidity for a Sample of Kansas Farms
by Michael Langemeier and Allen Featherstone
![]()
![]()
![]()
![]()
![]()
Liquidity measures help gauge whether a farm or group of farms has the ability to meet short-term debt obligations. In addition to examining average liquidity values over time, most analysts want to know how many farms fall below specific liquidity thresholds. This article examines differences in liquidity among Kansas Farm Management Association (KFMA) farms with continuous data from 2000 to 2019. There were 178 KFMA farms with continuous data for the 20-year period. Farm types represented in this sample of farms include crop farms, crop/beef farms, and beef farms.
Estimating and Analyzing Liquidity
Commonly used liquidity measures include working capital to value of farm production, working capital per acre, and the current ratio. Working capital is measured by subtracting current liabilities from current assets. Current assets include cash, accounts receivable, supply inventories, crop inventories, and market livestock inventories. Current liabilities include accounts payable, operating lines of credit, and the portion of non-current loans due within the next year. The current ratio is computed by dividing current assets by current liabilities. The working capital to value of farm production measure can also be computed using gross income, gross revenue, or total expenses. Value of farm production is considered a more appropriate measure of gross income when the sample of farms includes both crop and livestock farms. This article uses working capital to value of farm production and the current ratio to measure liquidity.
Liquidity thresholds are typically used by analysts to determine whether a farm has an adequate liquidity position. The two thresholds examined for the working capital to value of farm production were 0.20 and 0.35. The second threshold (0.35) is a commonly used threshold by financial analysts and would be considered an adequate level of working capital to weather a one or two year downturn. The first threshold (i.e., 0.20) depicts a situation where a farm may have trouble repaying loans. As with the working capital to value of farm production threshold of 0.35, a current ratio above 2.0 is considered adequate. A farm with a current ratio below 1.0 is not able to cover their current liabilities by selling all of their current assets, and therefore may have trouble repaying loans.
Trends in Liquidity Measures
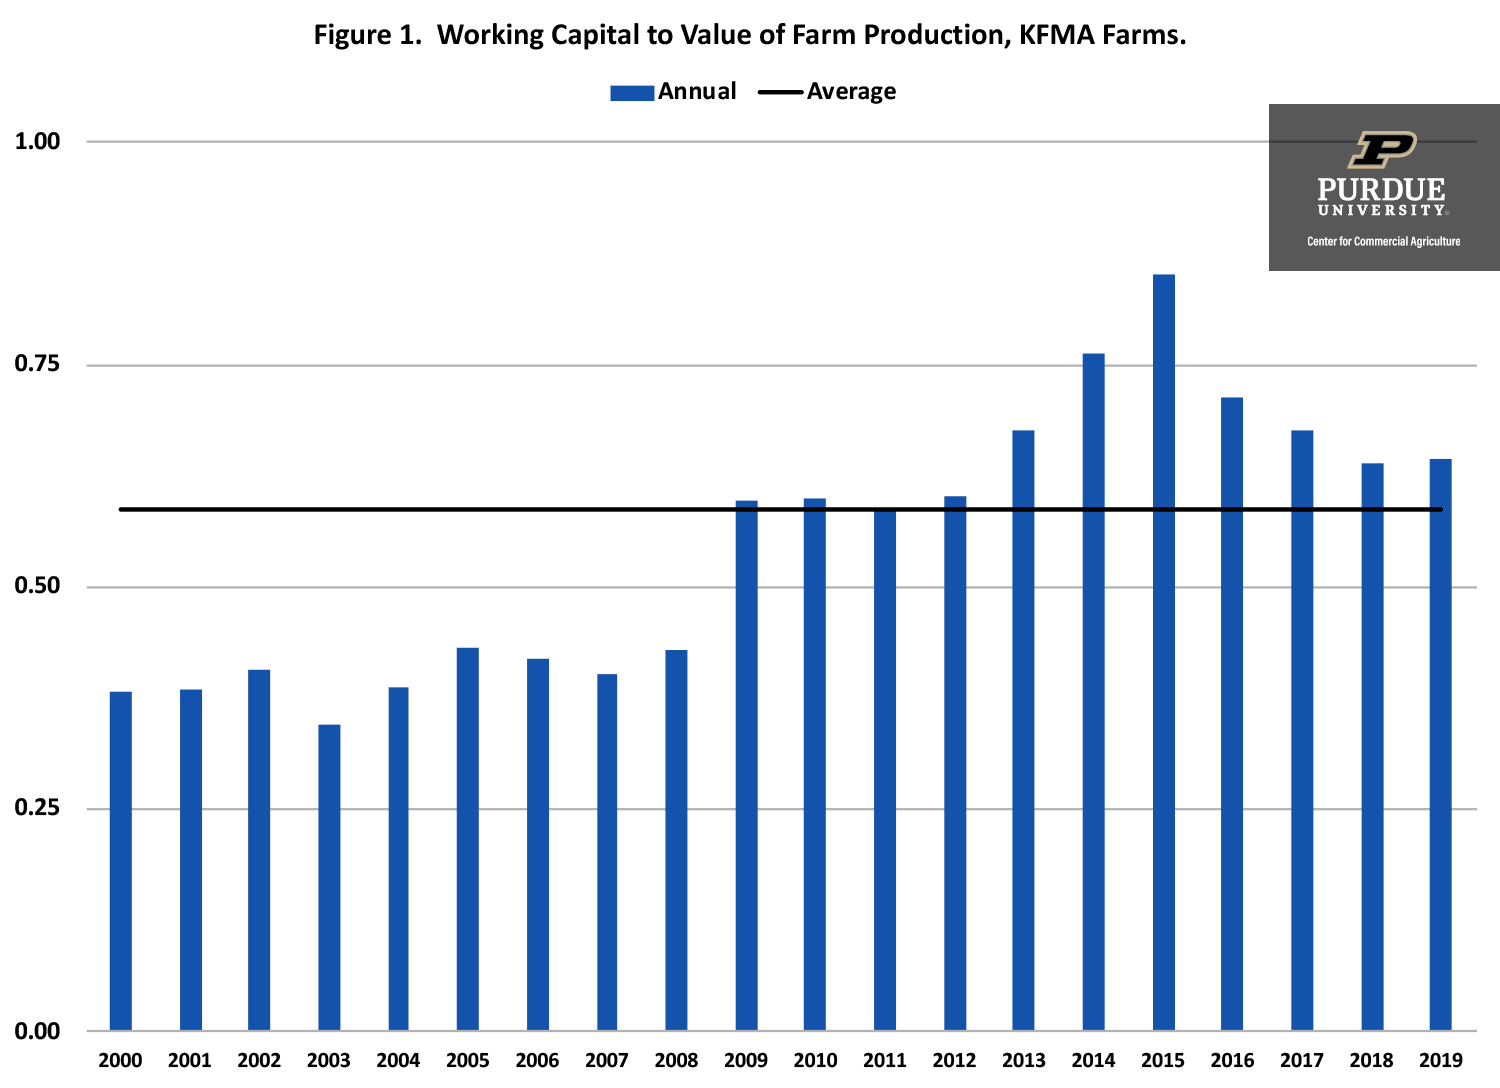
Figure 1. Working Capital to Value of Farm Production, KFMA Farms.
Figure 1 illustrates the average for working capital to value of farm production for the sample of KFMA farms. Working capital reached a peak of $464,468 in 2014. Average working capital was $381,034 in 2019. Working capital to value of farm production averaged 0.588 over the 20-year period. The working capital to value of farm production measure was above the average for each year from 2009 to 2019, and below the average prior to 2009.

Figure 2. Current Ratio, KFMA Farms.
Trends in the average current ratio for the sample of KFMA farms are depicted in Figure 2. The average current ratio during the 20-year period was 2.83. The current ratio was above the average ratio from 2009 to 2015. The current ratio peaked in 2013 at 4.04, and dropped to 2.60 in 2019. Though relatively lower in 2019 compared to its peak value, the current ratio in 2019 was still higher than the averages experienced prior to 2008.
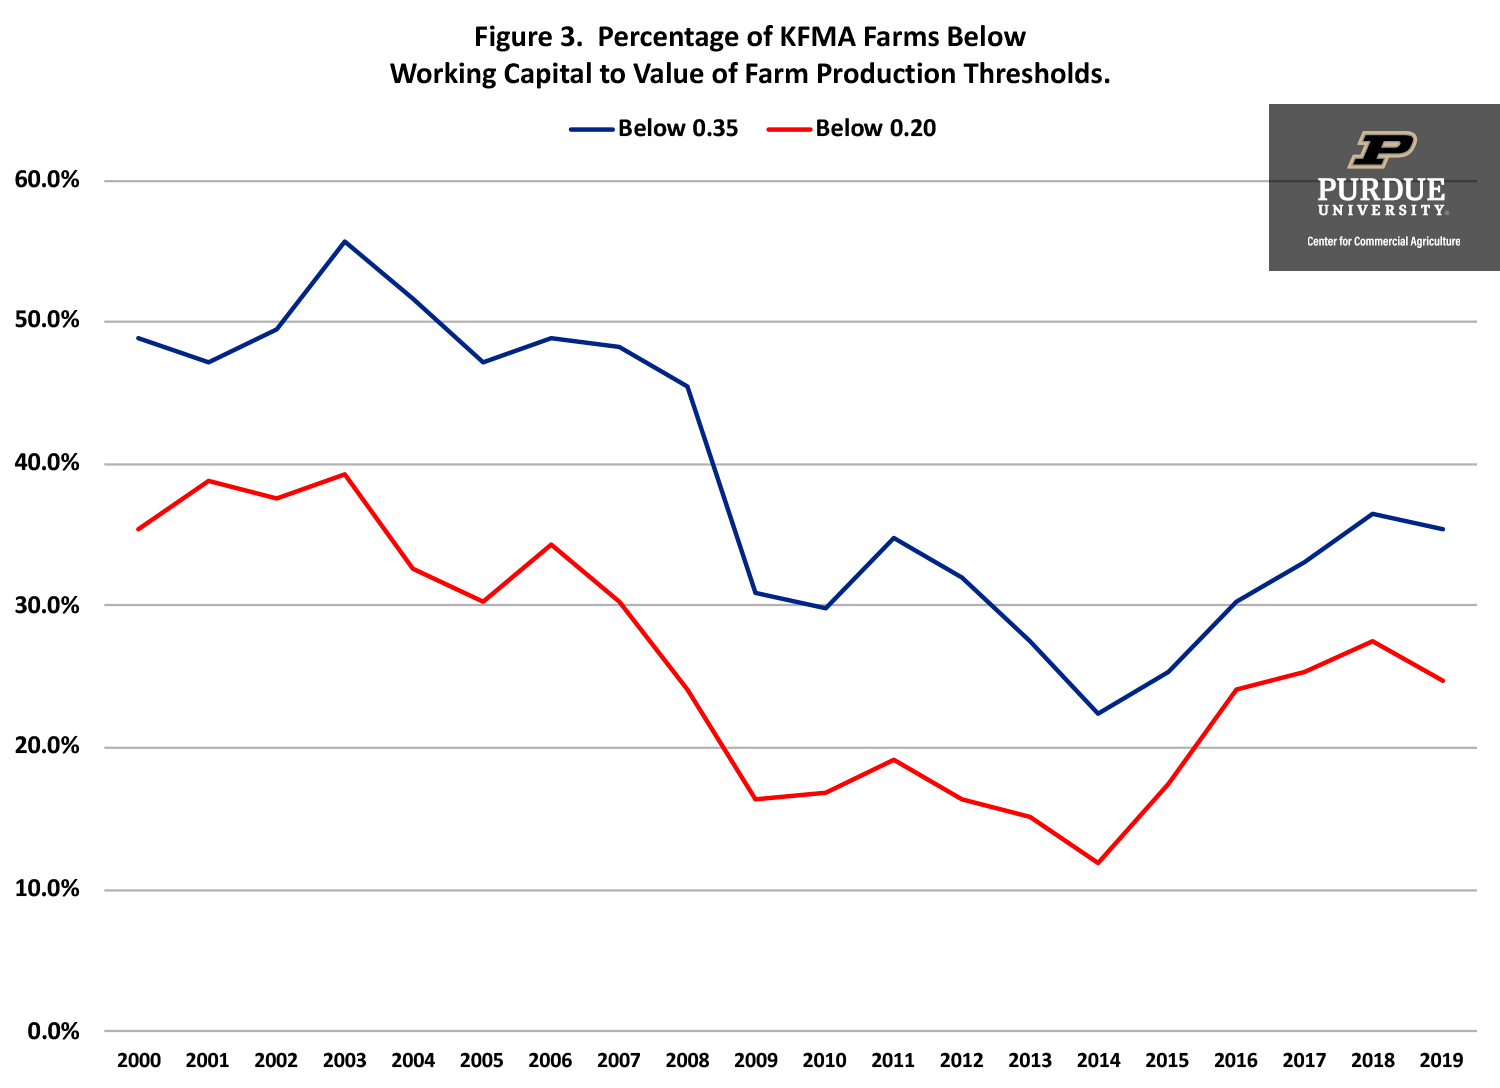
Figure 3. Percentage of KFMA Farms Below Working Capital to Value of Farm Production Thresholds.
As noted in the introduction, most analysts are interested in how liquidity measures vary among farms. To examine liquidity differences among farms, we identified the percentage of farms below the two thresholds for working capital to value of farm production. The two thresholds examined were 0.20 and 0.35. Figure 3 illustrates the trends in these two thresholds over the 20-year period. On average, over the 20-year period, the percentages of farms with a working capital to value of farm production below 0.20 and 0.35 were 25.9% and 39.0%, respectively. The percentage of farms below the two thresholds has increased substantially since 2014. The 2019 percentages were 24.7% below the 0.20 threshold and 35.4% below the 0.35 threshold. It is important to note, however, that the 2019 threshold percentages were still smaller than they were prior to 2008, and were smaller than the 20-year averages.

Figure 4. Percentage of KFMA Farms Below Current Ratio Thresholds.
The two thresholds examined for the current ratio were 1.0 and 2.0. The trends in these two thresholds are illustrated in Figure 4. On average, over the 20-year period, the percentages of farms with a current ratio below 1.0 and 2.0 were 12.6% and 34.8%, respectively. Farms with a current ratio below 1.0 are in a difficult situation. To repay debt, these farms would need to increase value of farm production, reduce expenses, refinance intermediate or long-term debt, sell intermediate or long-term assets, or infuse capital from off-the-farm to ensure that the current debt obligations are repaid. The percentage of farms with ratios below 1.0 and 2.0 were high from 2000 to 2007 and low from 2008 to 2016. The percentage of farms with a ratio below 1.0 increased dramatically in 2017 and 2018, but declined in 2019. The percentage of farms with a ratio below 2.0 was above the 20-year average in 2017, 2018, and 2019.
Concluding Comments
This article examined trends in liquidity for a sample of KFMA farms. Liquidity, measured using the current ratio, has declined substantially since its peak in 2013. The percentage of farms with a current ratio below 1.0 and 2.0 was 7.9% and 37.6% in 2019. In contrast, these percentages were only 6.2% and 20.2% in 2014. It is important to note that the liquidity situation improved slightly during 2019. Farms are finding it increasingly difficult to repay loans in a timely fashion. Though not illustrated in this article, correlation coefficients between the liquidity measures and farm characteristics were also computed. Liquidity was negatively related to the debt to asset ratio and the asset turnover ratio, and positively related to the percentage of acres owned. Farms with more leverage (i.e., a higher debt to asset ratio) and a higher asset turnover ratio had weaker liquidity positions. Farms that owned a larger percentage of the acres they operated had stronger liquidity positions. It is important to note that liquidity did not significantly differ based on farm size, farm type, or the operating profit margin ratio.
![]()
![]()
![]()
![]()
![]()
TAGS:
TEAM LINKS:


RELATED RESOURCES
UPCOMING EVENTS
We are taking a short break, but please plan to join us at one of our future programs that is a little farther in the future.