May 31, 2022
Explaining Fluctuations in DDG Prices
Michael Langemeier
![]()
![]()
![]()
![]()
![]()
Distiller’s dried grains (DDGs) are a co-product of dry-milled ethanol production. U.S. ethanol plants have the capacity to produce more than 17 billion gallons of ethanol and 35 million tons of DDG (Ag MRC). DDGs from corn contain, on average, 30 percent protein, 10 percent fat, and 7 percent fiber. Approximately 18 pounds of DDGs (10 percent moisture content) are produced from one bushel of corn. Because their protein content is higher than that of corn, DDGs can be substituted for corn and soybean meal in livestock diets. More information pertaining to the substitution of DDG for corn and soybean meal in the U.S. can be found in Hoffman and Baker (2011).
Given the substitutability of DDGs for corn and soybean meal; we would expect DDG prices to be significantly related to these feedstuffs. To help explain fluctuations in DDG prices, this article examines the relationship between DDG prices, and corn and soybean meal prices. Price data used below were obtained from monthly issues of Feed Outlook, which reports DDG, corn, and soybean meal prices for central Illinois.
Variability of DDG Prices and Other Feedstuffs
Figure 1 depicts monthly DDG and corn prices from January 2007 to December 2021. The average DDG and corn prices over this period were $165 per ton and $159 per ton, respectively. These two price series are highly correlated (r = 0.824). DDG and corn prices tend to move in the same direction. However, there are times when the two prices diverge. For example, from January 2017 to May 2017, corn prices were from $23 to $27 per ton higher than DDG prices. From December 2017 to June 2018, corn prices were from $29 to $48 lower than DDG prices. More recently, due to capacity utilization issues associated with COVID-19, corn prices were $37 to $93 lower than DDG prices from March 2020 to July 2020, and from $42 to $46 lower than DDG prices in November and December 2020.
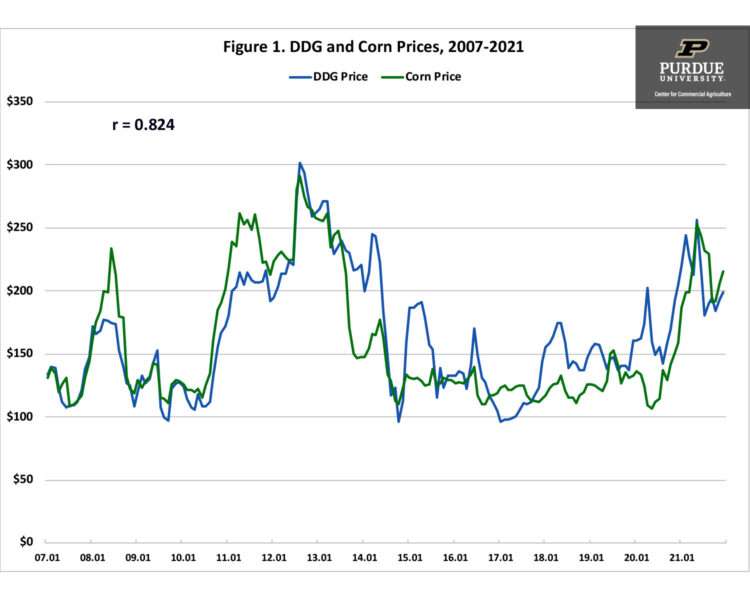
Figure 1. DDG and Corn Prices, 2007-2021
Monthly DDG and soybean meal (SBM) prices are illustrated in figure 2. Average DDG and soybean meal prices over the period were $165 per ton and $352 per ton, respectively. On average, soybean meal prices were 123 percent higher than DDG prices. These two price series are highly correlated (r = 0.667). However, the correlation is lower than that for DDG prices and corn prices. Having said that, the correlation between corn and SBM prices is 0.493, substantially lower than the correlation between DDG and SBM prices. The difference between soybean meal and DDG prices ranged from 35 percent in November 2011 to 338 percent in September 2014.
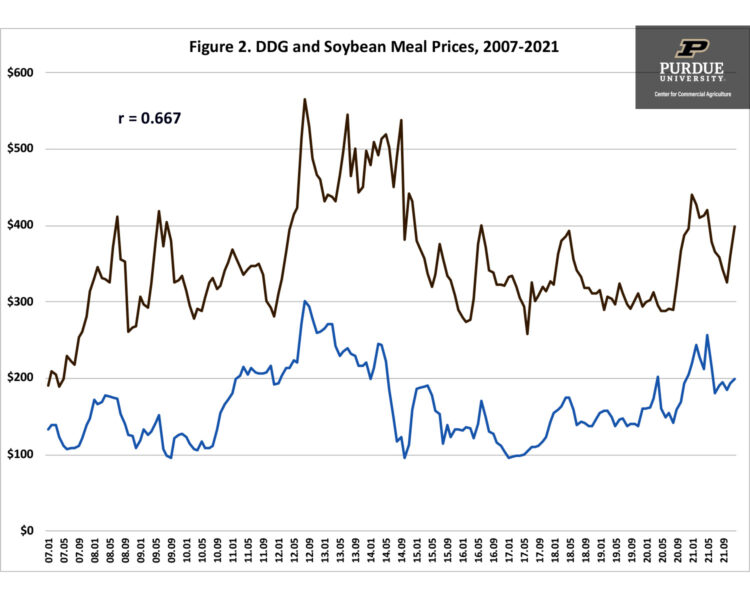
Figure 2. DDG and Soybean Meal Prices, 2007-2021
Factors Impacting DDG Prices
From the information above, it is evident that DDG prices are sensitive to changes in corn and soybean meal prices. Regression analysis using data from January 2007 to December 2021 for central Illinois was used to examine the relationship between these variables. Results are as follows: each $0.10 per bushel ($3.57 per ton) increase in corn price results in a $2.19 per ton increase in DDG prices, and each $10 per ton increase in soybean meal prices results in a $2.20 increase in DDG prices. To more fully understand the impact of corn and SBM prices on DDG prices, we computed coefficients of separate determination (Langemeier et al., 1992). These coefficients can be used to measure the influence of each independent variable upon the dependent variable. The sum of the coefficients of separate determination for each variable equals the R-square goodness of fit measure, which was 0.770 for the DDG price regression. This goodness of fit statistic indicates that 77.0 percent of the variation in DDG prices was explained by fluctuations in corn and SBM prices. Computed coefficients of separate determination indicated that corn price and SBM price explained approximately 54 and 23 percent of the variation in DDG prices, respectively.
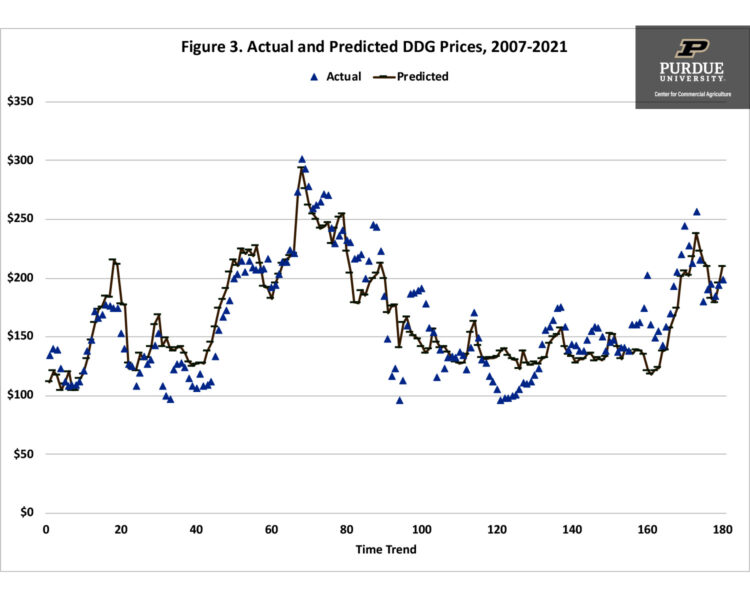
Figure 3. Actual and Predicted DDG Prices, 2007-2021
Figure 3 presents the actual and predicted DDG prices. There are times when the predicted DDG prices are either substantially below or above actual DDG prices, revealing the difficulty associated with predicting DDG prices with just corn price and soybean price information. For example, during much of 2020, predicted DDG prices were well below actual DDG prices. In 2021, as ethanol plants started producing at levels closer to capacity, actual DDG prices more closely matched predicted prices.
Projected DDG Prices
As noted above, DDG prices are sensitive to changes in both corn and SBM prices. Using projected corn and soybean meal prices for the second half of 2022 (i.e., $7.00 corn and $400 SBM), DDG prices are projected to range from $230 to $250 per ton. Of course, there is a wide band around projected corn and SBM prices. If corn and SBM prices are 10 percent lower than projections, predicted DDG prices would range from $200 to $220 per ton. Predicted DDG prices would range from $260 to $280 if corn and SBM prices are 10 percent higher than current projections.
Summary and Conclusions
DDGs are an important feedstuff in the U.S. DDGs often substitute for both corn and soybean meal in livestock rations. Because DDG prices are not as readily available as corn and soybean meal prices, it can be difficult to gauge the impact of DDG prices on projected feed costs. This article examined fluctuations in DDG prices since 2007, and related movement in DDG prices to movements in corn and soybean meal prices. DDG prices were significantly correlated with corn prices and soybean meal prices.
References
Agriculture Marketing Resource Center, www.agmrc.org, accessed May 31, 2022.
“Feed Outlook,” United Department of Agriculture, Economic Research Service, various issues.
Hoffman, L.A. and A. Baker. “Estimating the Substitution of Distillers’ Grains for Corn and Soybean Meal in the U.S. Feed Complex.” FDS-11-I-01, United States Department of Agriculture, Economic Research Service, October 2011.
Langemeier, M., T. Schroeder, and J. Mintert. “Determinants of Cattle Finishing Profitability.” Southern Journal of Agricultural Economics. 24(December 1993):41-47.
![]()
![]()
![]()
![]()
![]()
TAGS:
TEAM LINKS:

RELATED RESOURCES
Sorry, we couldn't find any closely related posts. Please try a different search.
UPCOMING EVENTS
We are taking a short break, but please plan to join us at one of our future programs that is a little farther in the future.