July 1, 2022
Trends in Working Capital
by Michael Langemeier
![]()
![]()
![]()
![]()
![]()
Introduction
Working capital represents the liquid funds that a business has available to meet short-term financial obligations. The amount of working capital a business has is calculated by subtracting current liabilities from current assets. Current assets include cash, accounts receivable, inventories of grain and market livestock, prepaid expenses (e.g., feed, fertilizer, and seed inventories), and investment in growing crops. Current liabilities include accounts payable, unpaid taxes, accrued expenses, including accrued interest, operating lines of credit, and principal payments due in the upcoming year on longer term loans.
Working capital provides the short-term financial reserves that a business needs to quickly respond to financial stress as well as to take advantage of opportunities. It provides a buffer to financial downturns that might impair the farm’s ability to purchase inputs, service debt obligations, or to follow through on its marketing plan. It also provides the financial resources to quickly take advantage of opportunities that might develop (e.g., rent additional ground; purchase land; add a family member to the operation).
This article discusses recent trends in working capital and differences in working capital among farms, and provides working capital benchmarks. Data from USDA-ERS as well as the Center for Farm Financial Management in Minnesota is utilized.
Working Capital Benchmarks
How much working capital does a farm need? The answer to this question depends on both the risk and size characteristics of the farm, and volatility of the business climate. In a volatile business climate and when a farm engages in enterprises that exhibit relatively more variability of net returns, more working capital is needed. Larger farms also need more working capital, so it is best to determine the amount of working capital buffer relative to either gross revenue, value of farm production, or total expense. Working capital to gross revenue, working capital to value of farm production, or working capital to total expense ratios above 0.35 are commonly used thresholds by financial analysts and would be considered an adequate level of working capital to weather a one- or two-year downturn. When the working capital ratios fall below 0.20, a farm may have trouble repaying loans. An individual can also measure working capital sufficiency using the current ratio, which is computed by dividing current assets by current liabilities. A current ratio above 2.0 is a commonly used threshold. When the current ratio falls below 1.0, a firm does not have sufficient current assets to cover current liabilities.
Trends in Working Capital
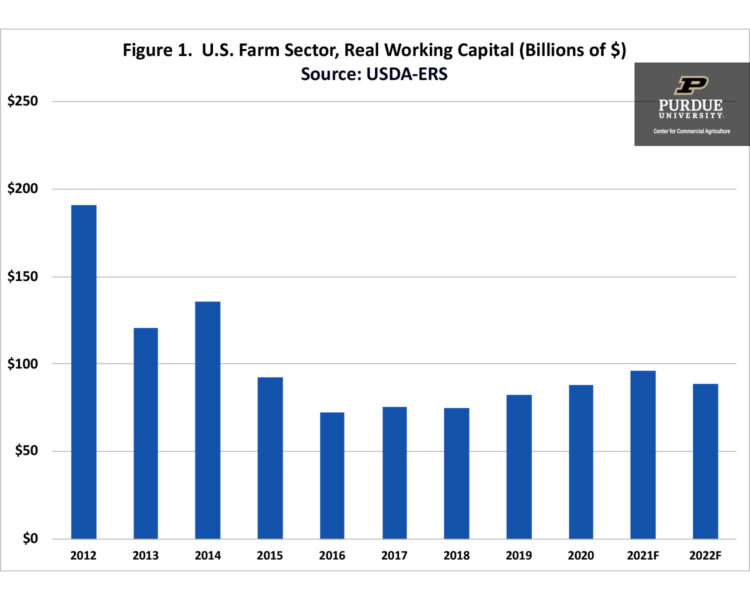
Figure 1. U.S. Farm Sector, Real Working Capital (Billions of $)
Figure 1 illustrates the trend in working capital for the U.S. farm sector since 2012. Working capital dropped from $165 billion in 2012 to an estimated value of $65 billion in 2016, and then increased to $96 billion in 2021. Working capital is projected to be approximately $93 billion in 2022, down 3.3% from the 2021 level.
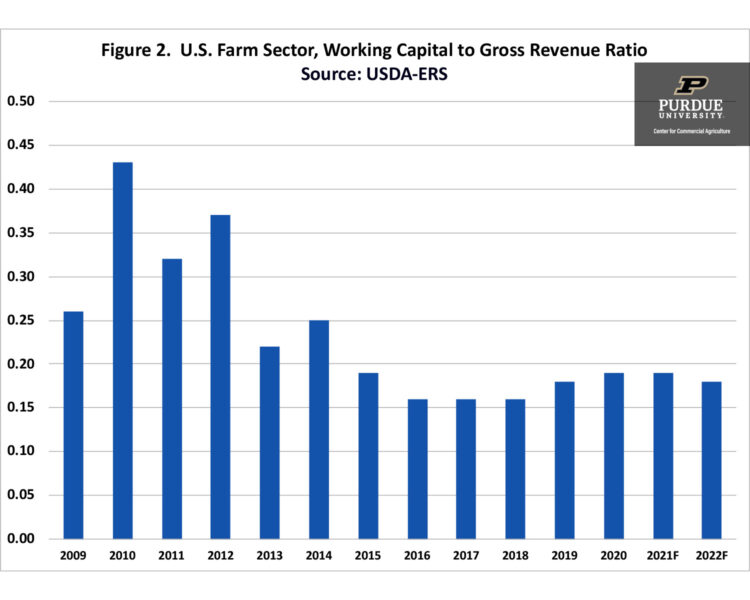
Figure 2. U.S. Farm Sector, Working Capital to Gross Revenue Ratio
The working capital to gross revenue ratio for the U.S. farm sector since 2009 is depicted in figure 2. From 2009 to 2014, the working to gross revenue ratio ranged from 0.22 in 2013 to 0.43 in 2010. The ratio was above the 0.35 threshold in 2010 and 2012. Since 2015, the working capital to gross revenue ratio has been below 0.20. The 2022 projected ratio is 0.18, which is below 0.20, indicating that some farms may be having difficulty repaying loans.
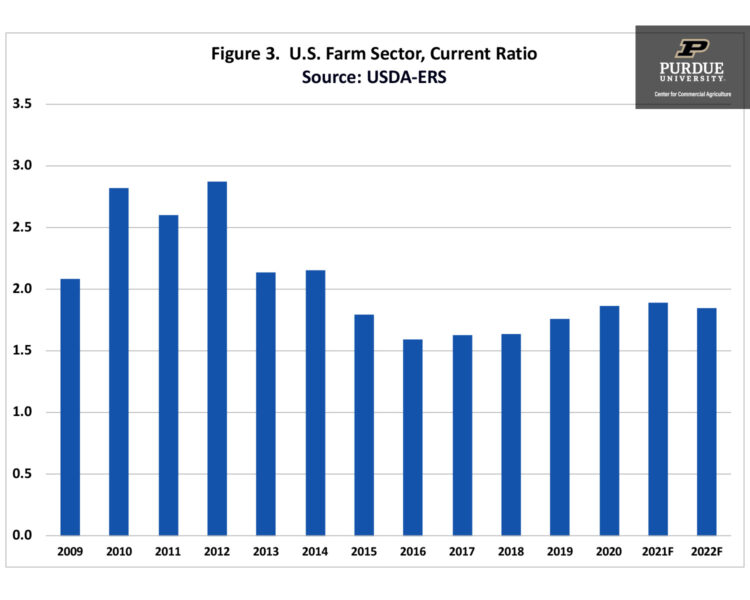
Figure 3. U.S. Farm Sector, Current Ratio
Figure 3 illustrates the average current ratio for the U.S. farm sector since 2009. The current ratio was above 2.0 from 2009 to 2014. The current ratio bottomed out in 2016 at 1.59. Since 2020, the current ratio has ranged from 1.85 to 1.89.
Obviously, the U.S. data is highly aggregated. The FINBIN data summarized by the Center for Farm Financial Management at the University of Minnesota can be used to provide a more regional snapshot of trends in working capital over the last 10 years (i.e., from 2012 to 2021). The average working capital to gross revenue ratio using the FINBIN data declined from 0.431 in 2012 to 0.256 in 2018 and 2019, and then increased to 0.326 in 2020 and to 0.406 in 2021. Similarly, the average current ratio dropped from 2.65 in 2012 to 1.58 in 2018. The average ratio in 2019 increased to 1.60, and then increased to 1.97 in 2020 and to 2.43 in 2021. The strong net farm income experienced in 2021 improved liquidity to levels not seen since 2012.
Difference in Working Capital among Farms
The working capital to gross revenue ratio as well as other liquidity measures vary substantially among farms. Using FINBIN data summarized by the Center for Farm Financial Management at the University of Minnesota, the median working capital to gross revenue ratio in 2021 was 0.367 or 36.7%. Approximately one-half of the farms had a ratio above 0.35. However, approximately one-third of the farms had a ratio below 0.20. Of the farms that had a ratio below 0.20, approximately one-half of this group had a negative ratio, indicating that their current liabilities exceeded their current assets.
The median current ratio for the farms in the FINBIN database was 2.32 in 2021. Over one-half of the farms had a ratio above 2.0. Approximately 15% of the farms had a current ratio below 1.0.
The FINBIN results discussed above illustrate the tremendous differences in liquidity among farms. Farms with lower liquidity levels need to very cautious in taking on more debt and when investing in capital assets such as machinery, buildings, and land.
Conclusions
This article provided working capital benchmarks and discussed trends in working capital and differences in working capital among farms. Even with a strong net farm income in 2021, there still are farms with a very weak liquidity position (i.e., current ratio below 1.0 and/or working capital to gross revenue ratio below 0.20). When the working capital to gross revenue is below 0.20 and/or the current ratio is below 1.0, farms will have difficulty repaying loans. Just as importantly, when liquidity becomes very tight, farms have very little flexibility with regard to their input purchases, or the timing of their commodity sales. In this situation, it also becomes increasingly difficult to borrow funds to replace machinery and equipment, or to rent or purchase land.
______________________________________________________
Citations
Center for Farm Financial Management, University of Minnesota, FINBIN website, accessed June 23, 2022.
![]()
![]()
![]()
![]()
![]()
TAGS:
TEAM LINKS:

RELATED RESOURCES
UPCOMING EVENTS
We are taking a short break, but please plan to join us at one of our future programs that is a little farther in the future.