December 19, 2025
Corn Basis Shows Volatility While Soybean Basis Stabilizes
by Josh Strine
![]()
![]()
![]()
![]()
![]()
Across the Eastern Corn Belt, local corn basis has become more volatile, while soybean basis levels continue to stabilize. Until recently, we had observed consistent strengthening in corn basis across the region. In some areas, this pattern has persisted. For example, in Northwest Indiana, the basis to March futures has increased by $0.23/bu to -$0.25/bu in the past four weeks (Figure 1). This continued strengthening can be found across North and Central Indiana and Ohio and all of Michigan and Iowa. While basis continued to increase in Iowa over the past month, local basis levels in the state remain the lowest in the region and below the three-year average.
In Southern Indiana and Ohio, basis strengthening has slowed since the beginning of December. In fact, the five local basis levels tracked for the southern parts of Indiana and Ohio have stayed within a $0.02/bu range over the past three weeks. While a stable or slightly strengthening basis can also be found in Illinois, it is the only state with predominantly weakening local basis levels. For example, corn basis to March futures has weakened by $0.04/bu in Northwest Illinois, and by $0.08/bu in Southwest Illinois (Figure 2) since the first week of December.
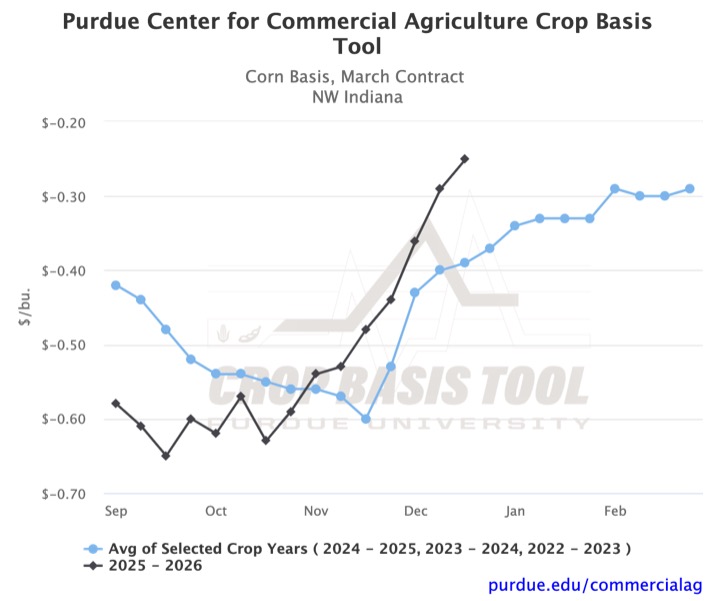
Figure 1. Corn Basis, March Contract for Northwest Indiana
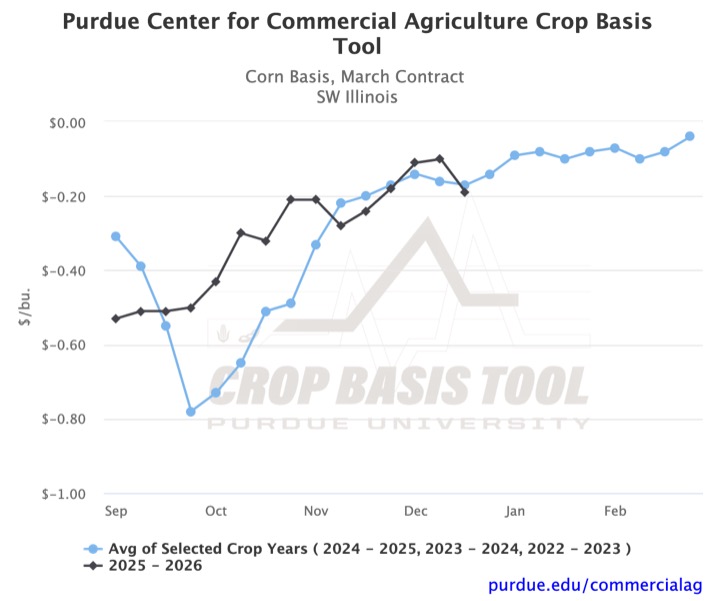
Figure 2. Corn Basis, March Contract for Southwest Illinois
While corn basis across the region is highly variable, local soybean basis trends are much more consistent. Across the Eastern Corn Belt, local soybean movement has leveled off from the consistent strengthening that started in October. In Central Indiana, Soybean basis to March futures has remained within a $0.02/bu range since the third week of November and currently stands at -$0.29/bu (Figure 3). As a result of recent stability, the local basis is below the two-year average for the first time since the first week of October. Due to recent stability across Indiana, the local soybean basis is below the two-year average in each part of the state. In Central Ohio, we see soybean basis movement very similar to Central Indiana (Figure 4). Since the third week of November, the basis has stayed within a range of $0.02/bu and currently sits at -$0.30/bu to March futures.
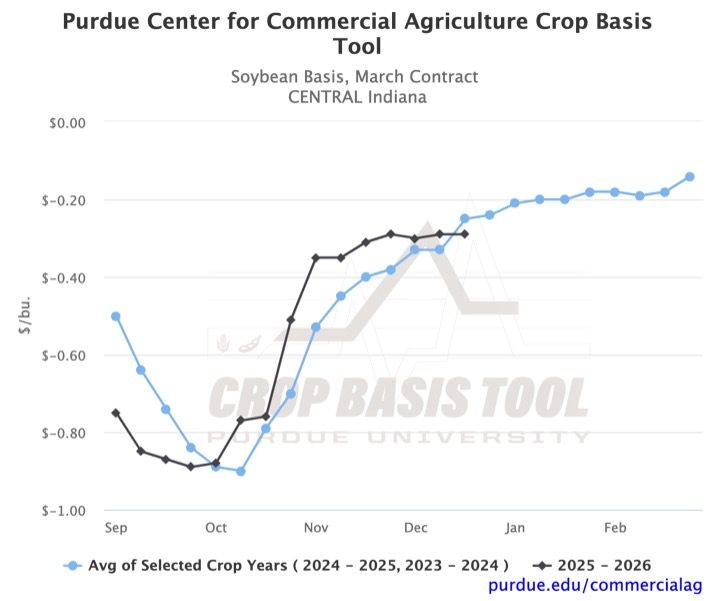
Figure 3. Soybean Basis, March Contract for Central Indiana

Figure 4. Soybean Basis, March Contract for Central Ohio
Looking at the basis to March futures, basis volatility appears highest between September and December, based on historical trends. Therefore, we may expect to see continued stability as we head into the new year. However, the recent weakening of corn basis in parts of Illinois runs counter to historical trends and may warrant caution. An additional concern for future local soybean basis in Ohio and Iowa may arise from soybean processor basis that have decreased over the past six weeks, which again goes against the historical trend. To stay up to date on your local corn or soybean basis, you can visit the Purdue Center for Commercial Agriculture’s Crop Basis Tool.
![]()
![]()
![]()
![]()
![]()
TAGS:
TEAM LINKS:

RELATED RESOURCES
UPCOMING EVENTS
We are taking a short break, but please plan to join us at one of our future programs that is a little farther in the future.