December 12, 2025
Crop Machinery Investment
by Michael Langemeier


A previous article discussed crop machinery costs and investment (Langemeier, 2024). Crop machinery investment is computed by dividing total crop machinery investment (i.e., investment in tractors, combines, and other machinery) by crop acres or harvested acres. In regions where double cropping is prevalent, using harvested acres give a more accurate depiction of machinery investment. This article examines crop machinery investment and net annual investment per acre by crop farm size.
Crop Machinery Investment
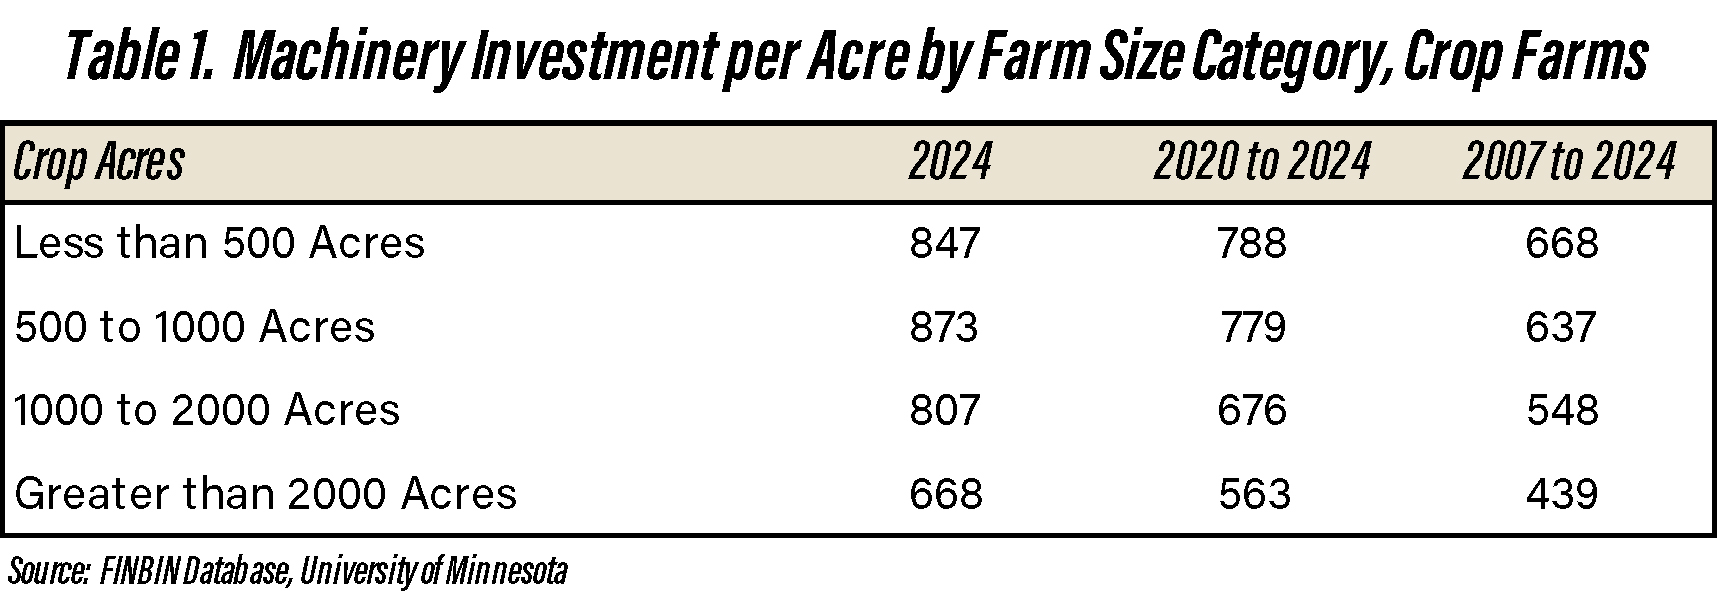
Table 1. Machinery Investment per Acre by Farm Size Category, Crop Farms
Table 1 presents average crop machinery investment per acre by farm size category for 2007 to 2024, 2020 to 2024, and 2024. Machinery investment per acre for the largest farm size category (i.e., greater than 2000 acres) is substantially lower than machinery investment per acre for the other farm size categories. It is thus important for farms to benchmark with farms that are similar in size to their own operation. For farms with greater than 2000 acres in 2024, average machinery investment per acre was $668. For farms with less than 2000 acres, average machinery investment per acre was over $800.
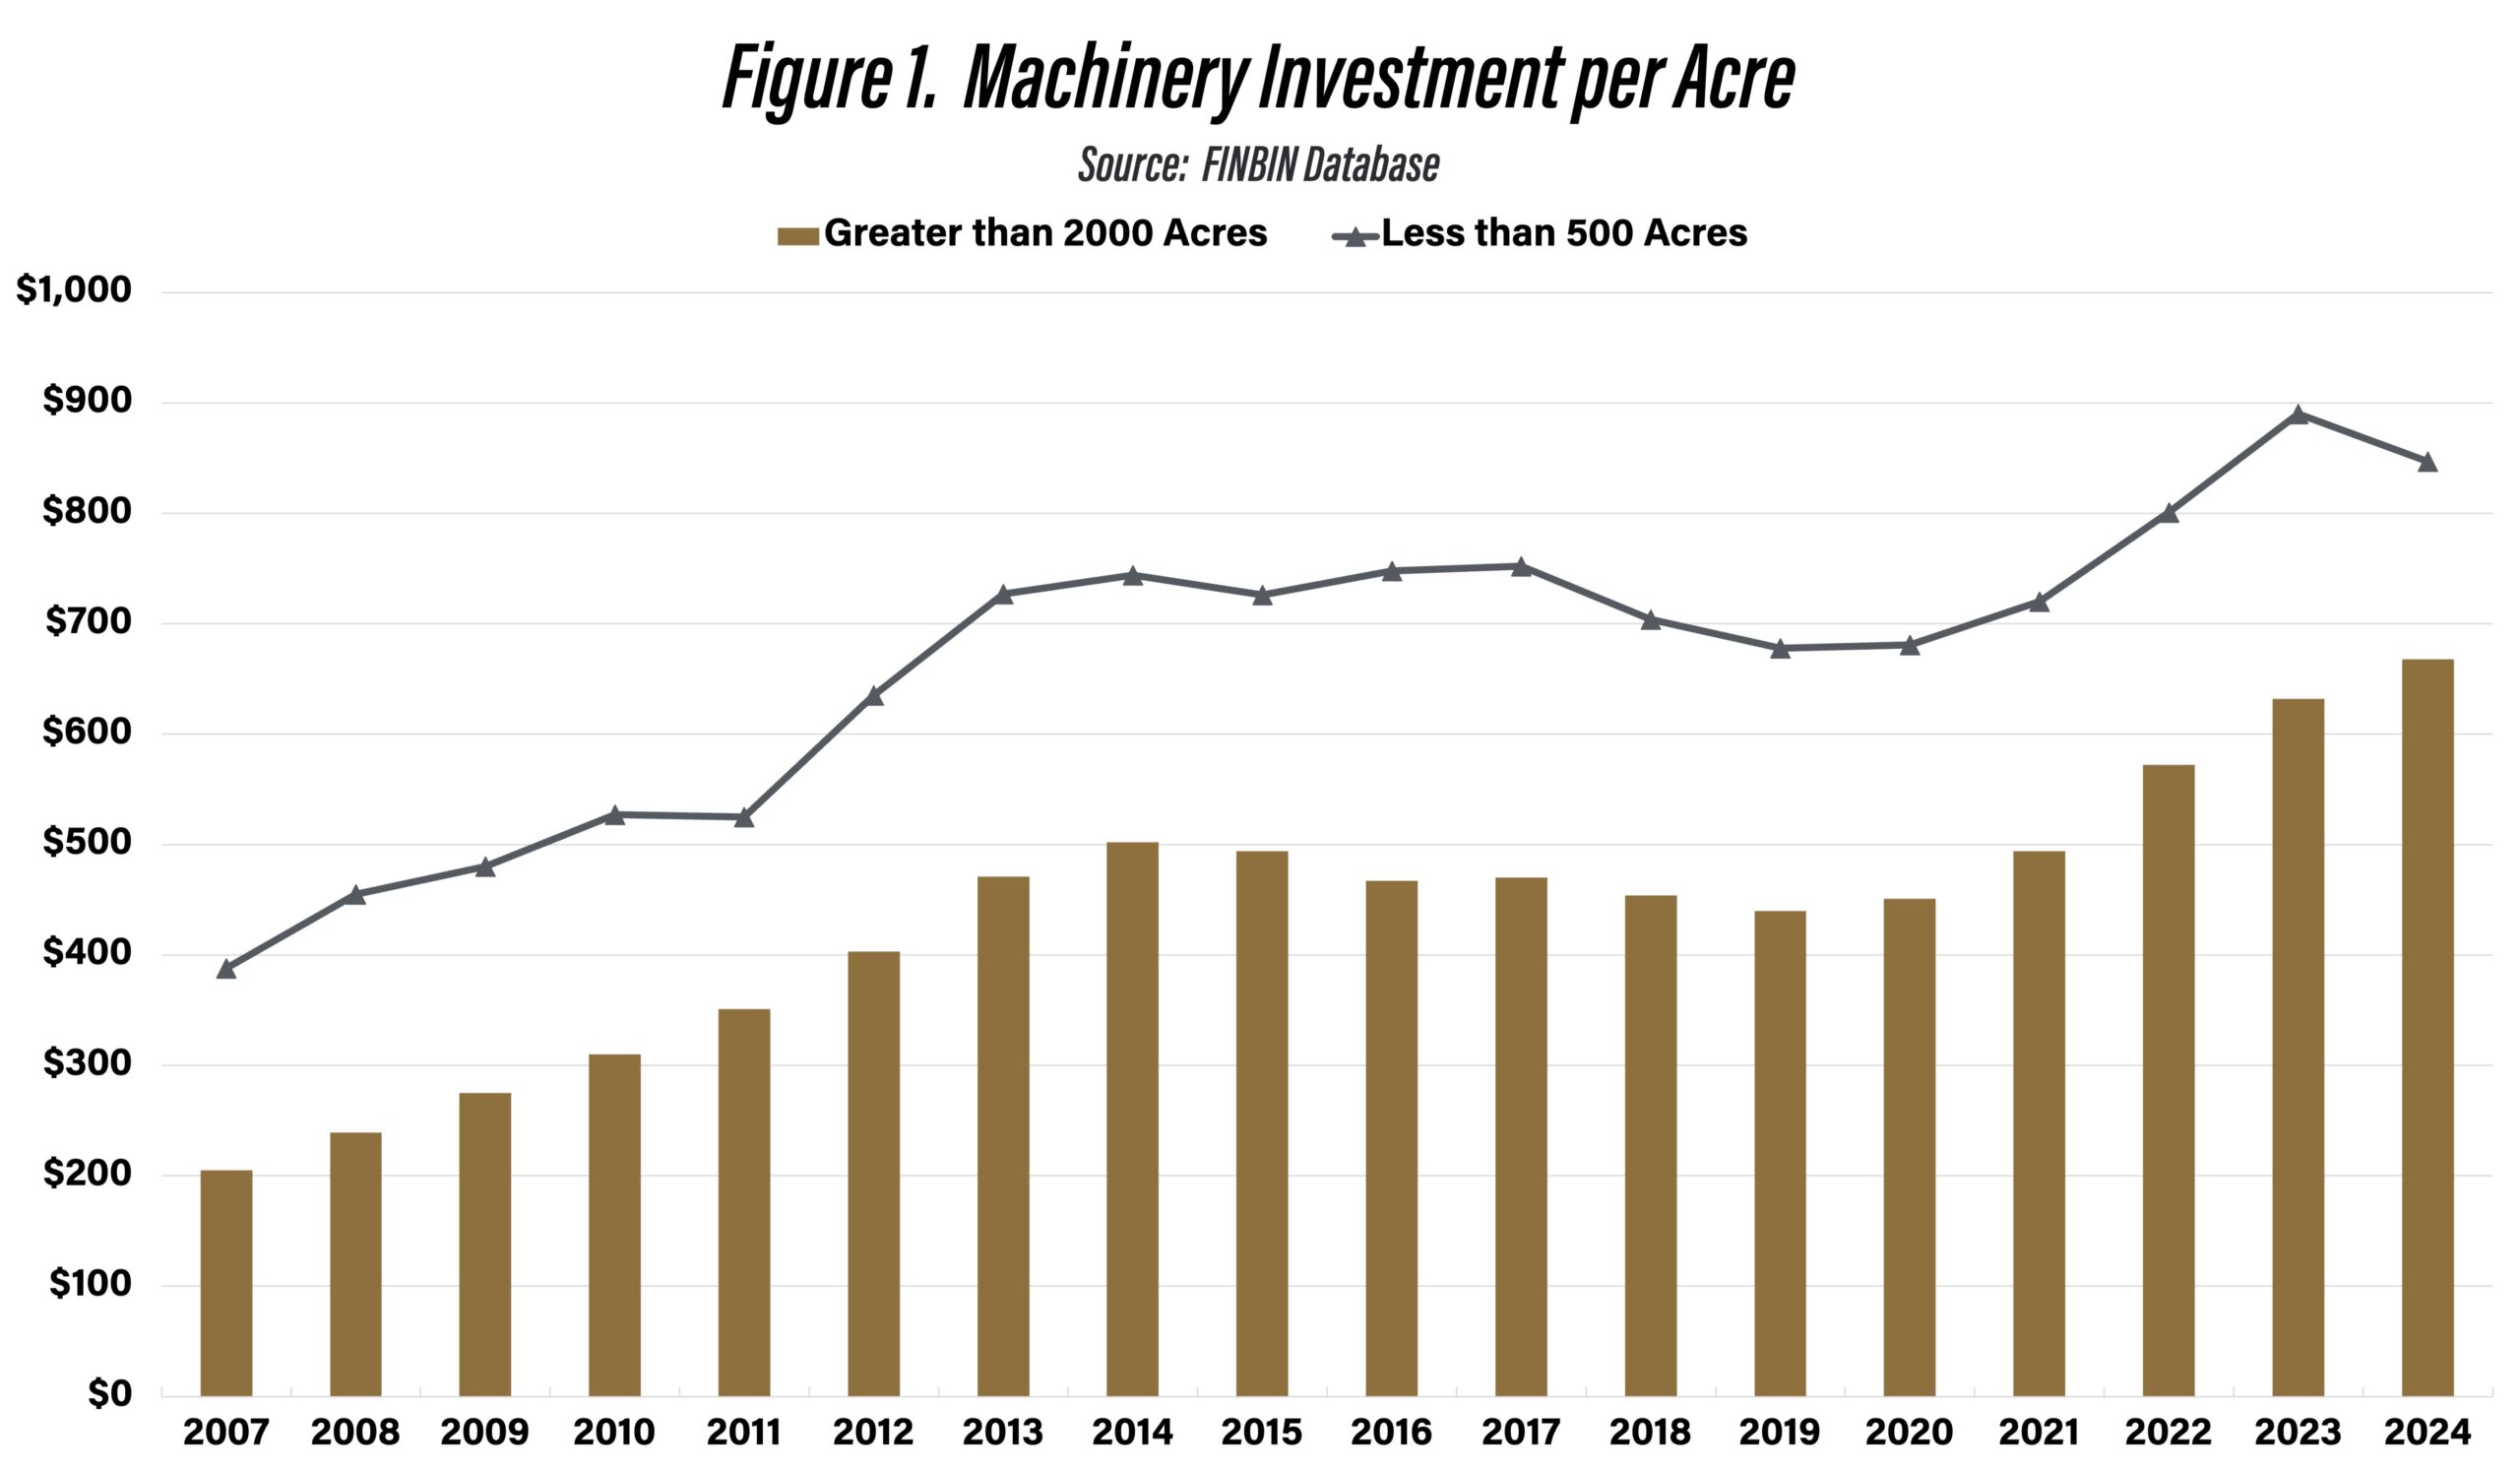
Figure 1. Machinery Investment per Acre
Figure 1 illustrates average machinery investment per acre for farms with less than 500 acres and farms with greater than 2000 acres from 2007 to 2024. From 2014 to 2021, for the largest farm size category, average machinery investment ranged from $440 in 2019 to $502 in 2014. Since 2021, average machinery investment per acre for the largest farm size category has increased 35%. There was a significant difference in machinery investment per acre for farms with less than 500 crop acres and farms with greater than 2000 crop acres over the 2007 to 2024 period. The average difference over the period was $229, suggesting that there are strong economies of scale related to machinery investment per acre.
Net Annual Investment
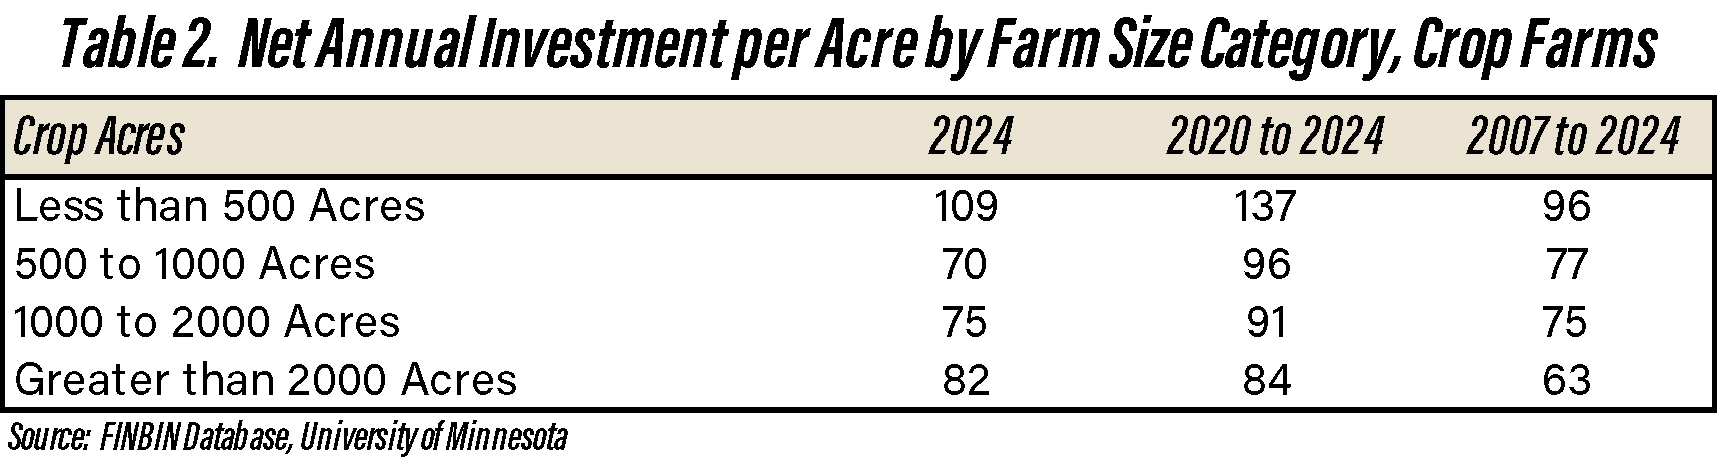
Table 2. Net Annual Investment per Acre by Farm Size Category, Crop Farms
Net annual investment per acre by farm size category is presented in table 2. Net annual investment is computed by adding machinery and titled vehicle purchases and subtracting machinery and titled vehicle sales. Thus, net investment refers to investment in machinery and equipment, and excludes building and land purchases and sales. Even though absolute investment in machinery and equipment is much higher for larger farms, net investment per acre tends to decline with farm size.
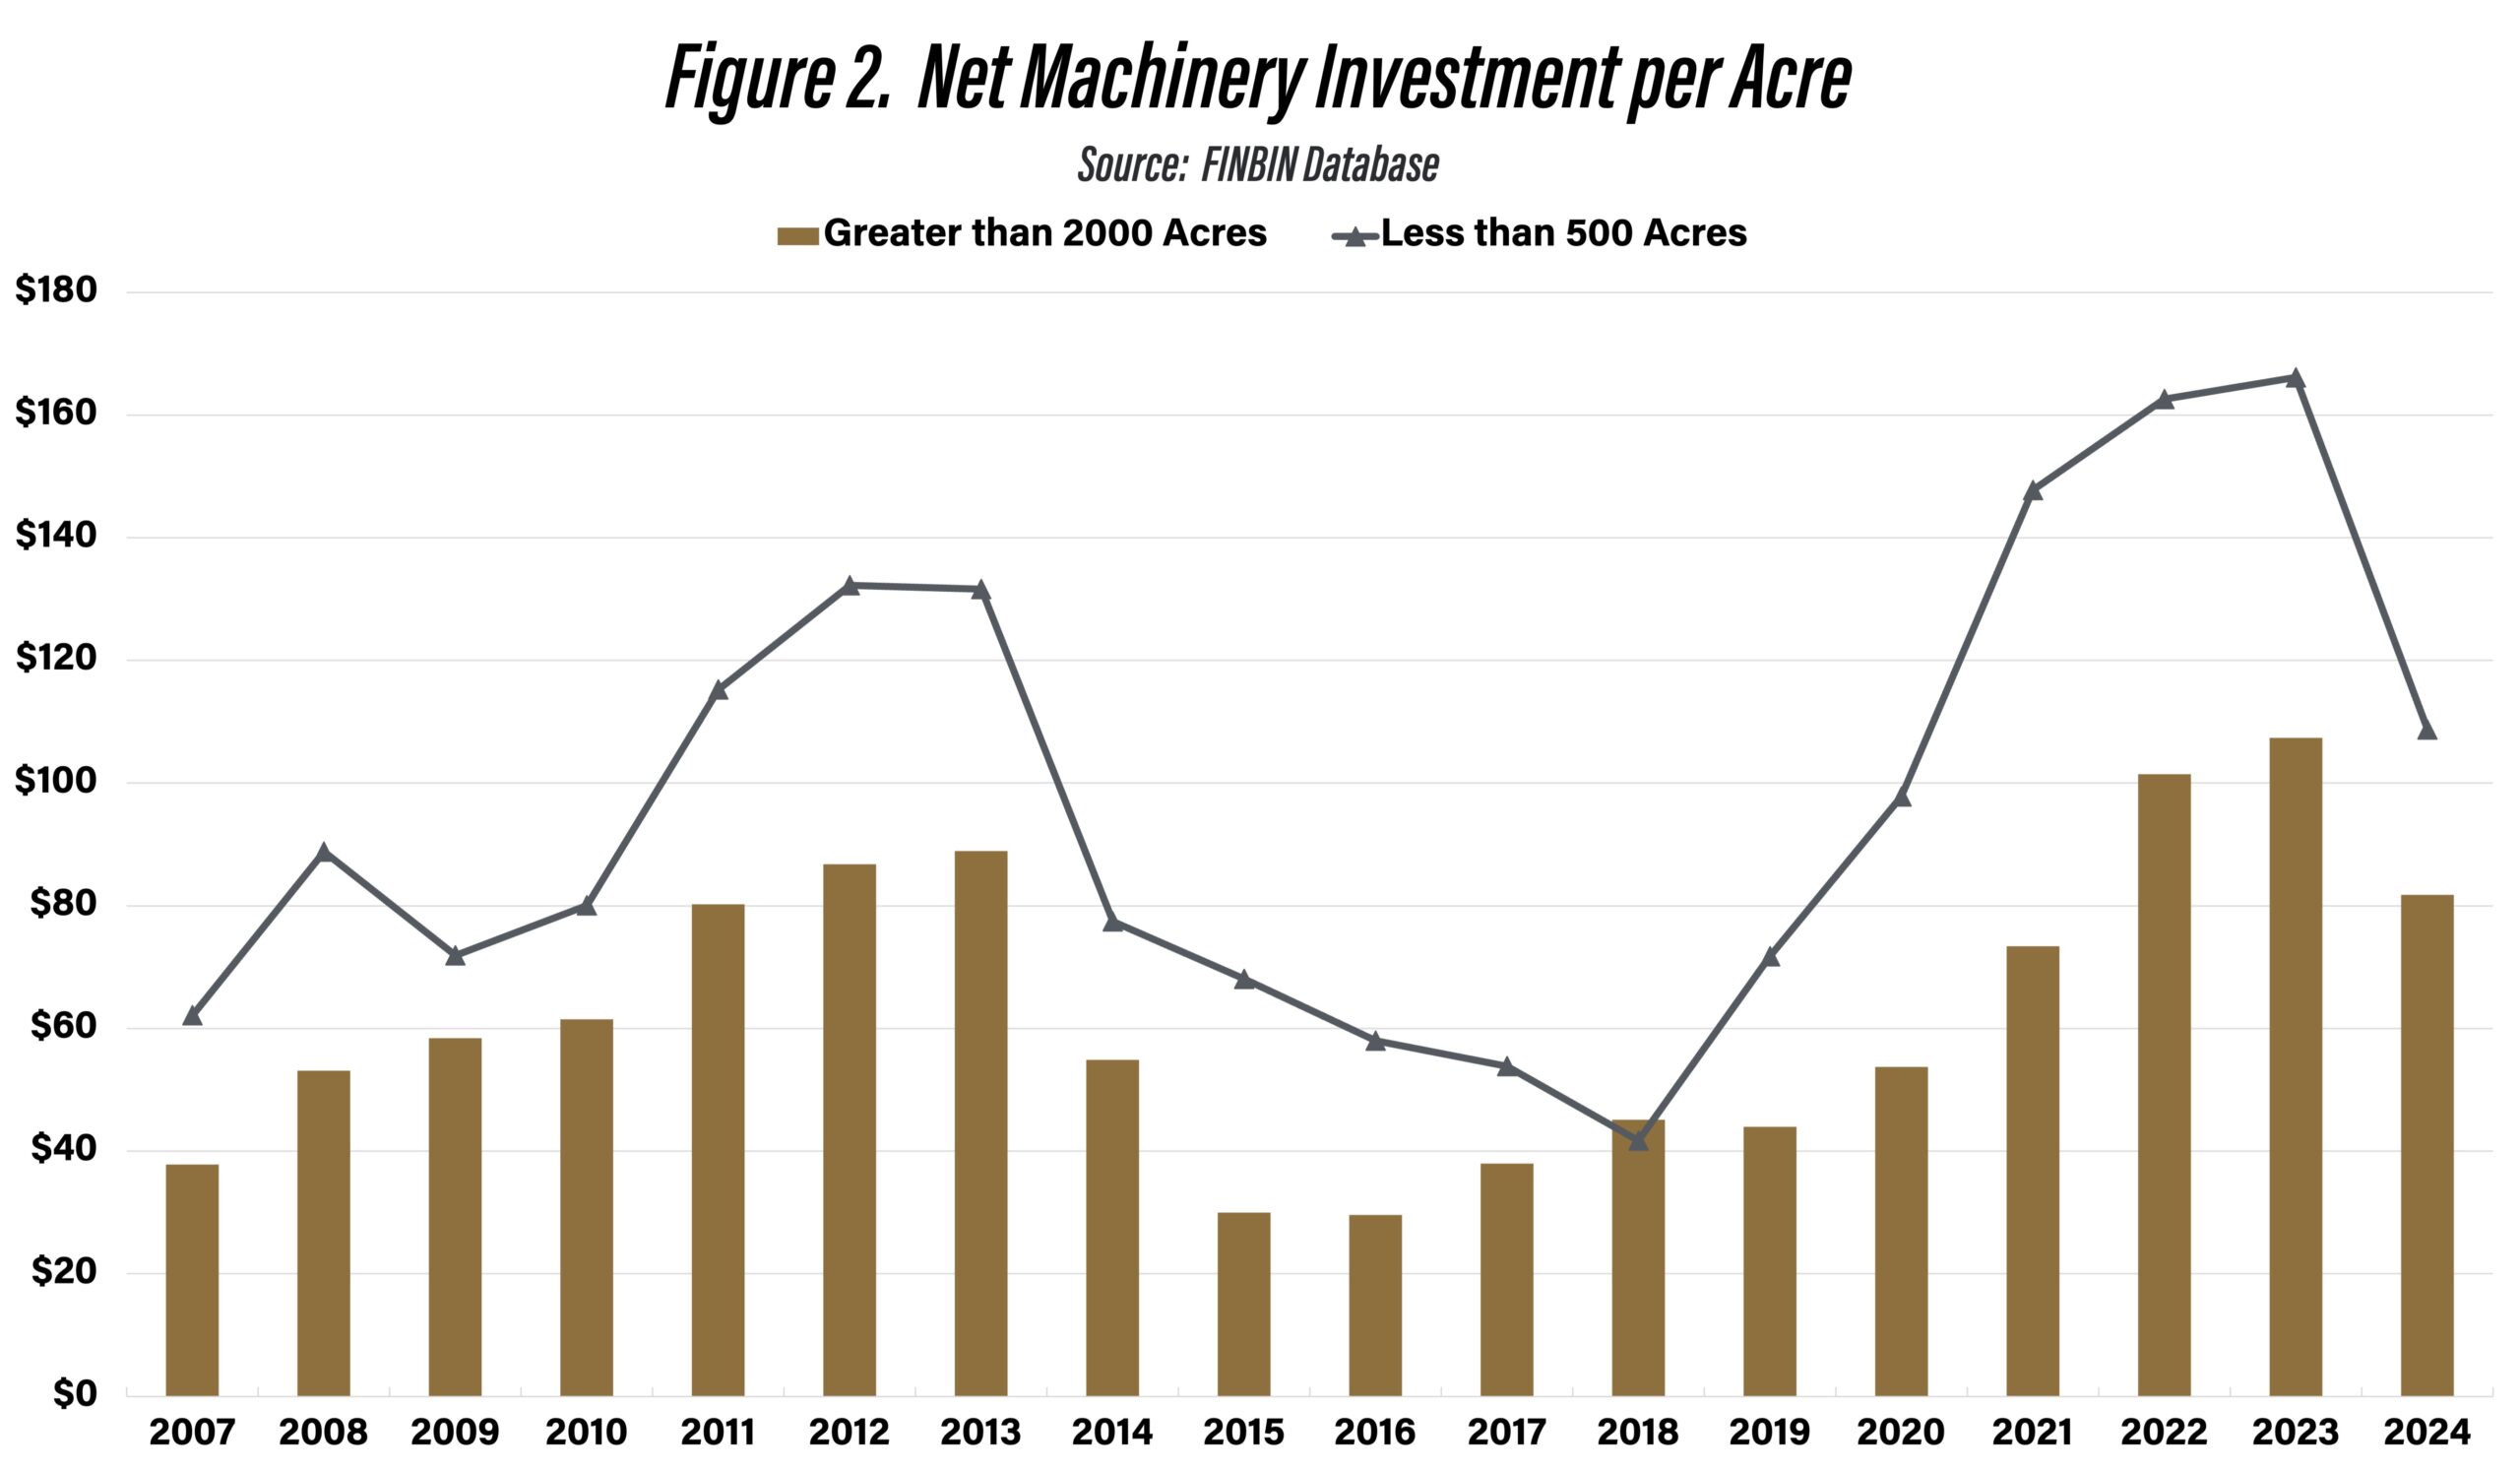
Figure 2. Net Machinery Investment per Acre
Net machinery investment per acre for farms with less than 500 acres and for farms with greater than 2000 acres are illustrated in figure 2. Net machinery investment closely follows net cash income. In years with relatively higher net cash income (e.g., 2011-2013 and 2022-2023), net machinery investment tends to be higher, and vice versa. Net machinery investment per acre for the large farm size category was over $100 in 2022 and 2023. During these same two years, net machinery investment was over $160 per acre for the small farm size category. There was significant difference in net investment per acre for farms with less than 500 crop acres and farms with greater than 2000 crop acres over the 2007 to 2024 period. On average, small farms spent $96 per acre on machinery and equipment while large farms only spent $63 per acre, a difference of $33 per acre. As with the results for machinery investment per acre, the results for net investment per acre suggest that there are strong economies of scale related to net investment per acre. The large difference in net investment over time translates into large differences in economic depreciation, interest, and machinery costs per acre between small and large farms.
Summary
This article examines crop machinery investment and net annual investment per acre for various crop farm sizes. Larger farms tend to have lower benchmarks with regard to crop investment per acre and spend less on a per acre basis on machinery and equipment. The large differences in crop machinery investment and net investment per acre between small and large crop farms suggest that there are substantial economies of size regarding machinery and equipment costs.
Citations
Center for Farm Financial Management, University of Minnesota, FINBIN web site, accessed October 14, 2025.
Langemeier, M. “Benchmarking Crop Machinery Cost and Investment.” Center for Commercial Agriculture, Purdue University, December 20, 2024.
TAGS:
TEAM LINKS:

RELATED RESOURCES
UPCOMING EVENTS
Join educators from across the Midwest to build skills for communicating soil health concepts on Nov. 4-5, 2026. In the field, we’ll evaluate the relationship between soil health and water management focusing on irrigation and edge of field practices. The in-service will have both classroom and on farm demonstrations.
The Land of Opportunity: A Conference for Farmland Owners will be held at two locations on October 5 and October 6, providing farmland owners with valuable information and resources to help them make informed decisions about their land. The conference will feature keynote presentations, educational breakout sessions, and networking opportunities designed specifically for those who own, manage, or have an interest in farmland.