February 16, 2026
USDA’s First Forecast of the 2026 U.S. Farm Balance Sheet
by Josh Strine
![]()
![]()
![]()
![]()
![]()
Last week, the USDA ERS Farm Income Team released the first Farm Income and Wealth Statistics update of 2026. The data provides us with the first opportunity to evaluate US farm balance sheet trends heading into the next production cycle. While farm equity and assets have increased annually since 2020, the percent change between 2025 and 2026 is forecast to be the lowest since 2019 to 2020 (Figure 1). On the other hand, the percent change in farm debt is forecast to increase between 2025 and 2026, marking the third time debt accumulation has accelerated in the past four years.
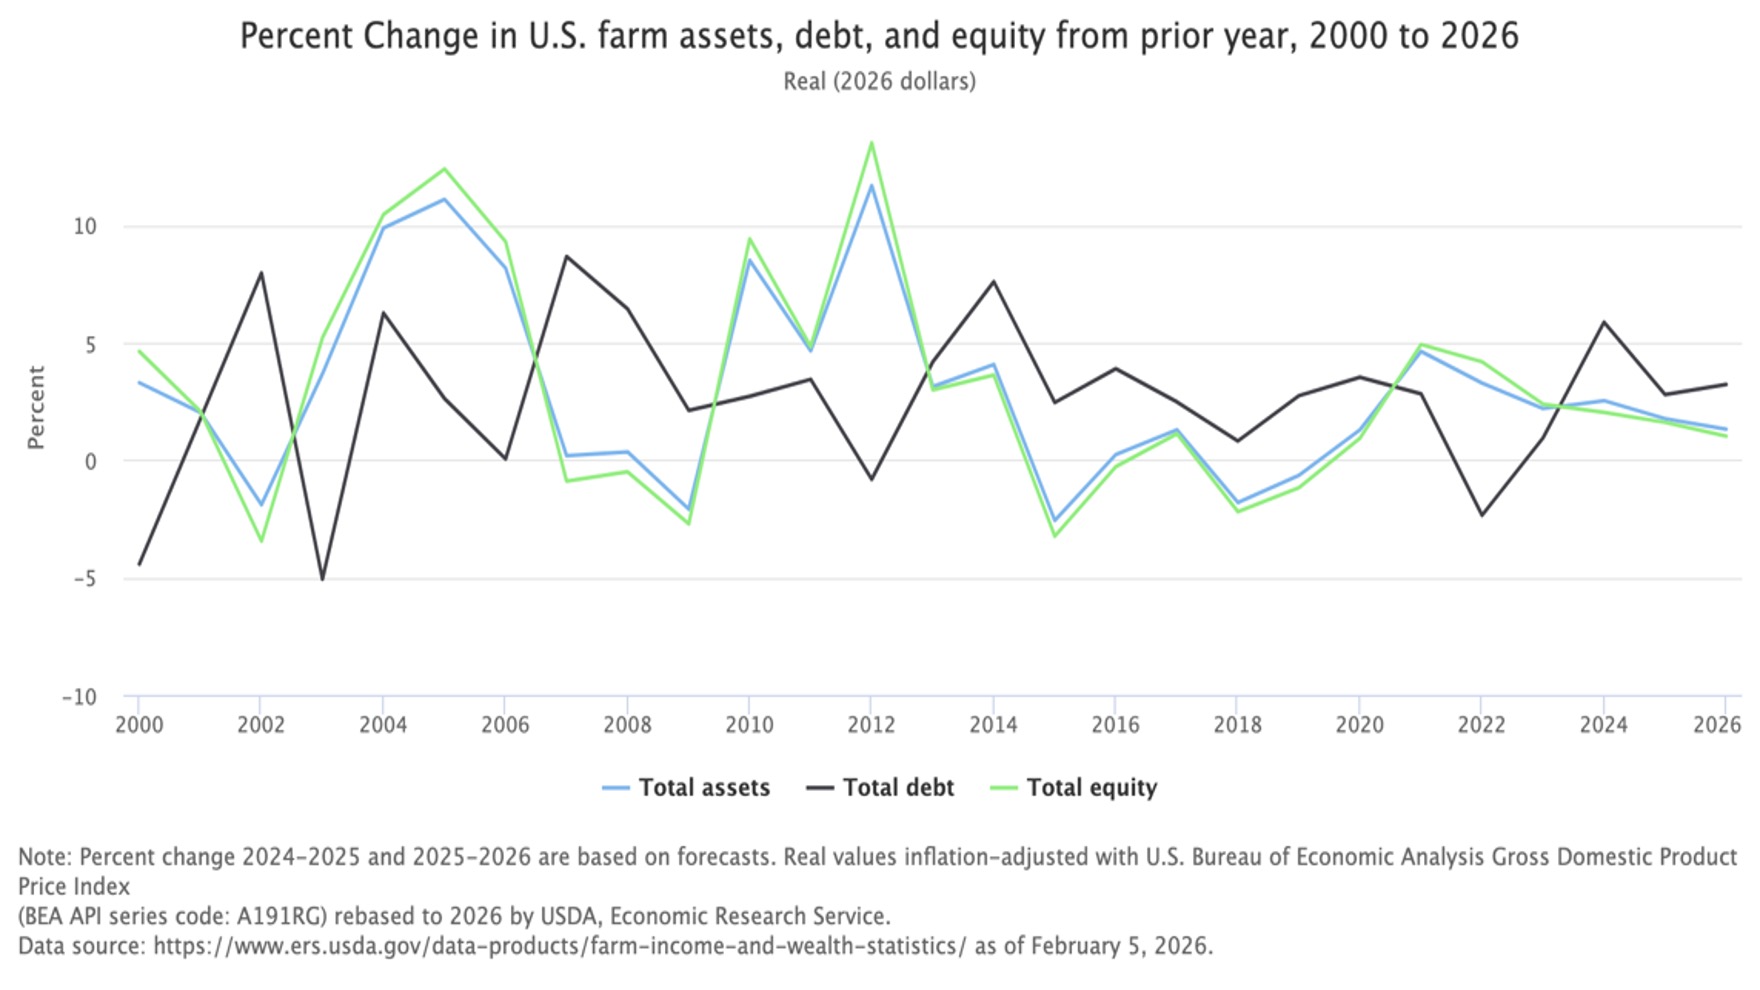
Figure 1. Percent Change in U.S. Farm Assets, Debt & Equity from Prior Year, 2000-2026
Non-real estate assets are expected to decline in 2026, driven by a decrease in animal, animal products, and crop inventory (Figure 2). Animal and animal product inventory is forecast to decline by $15 billion between 2025 and 2026, ending three straight years of asset growth in the livestock category. While total non-real estate assets are declining, a few categories are forecast to expand in 2026. Farm machinery and vehicles are expected to increase by $12 billion, continuing a four-year trend of growth.
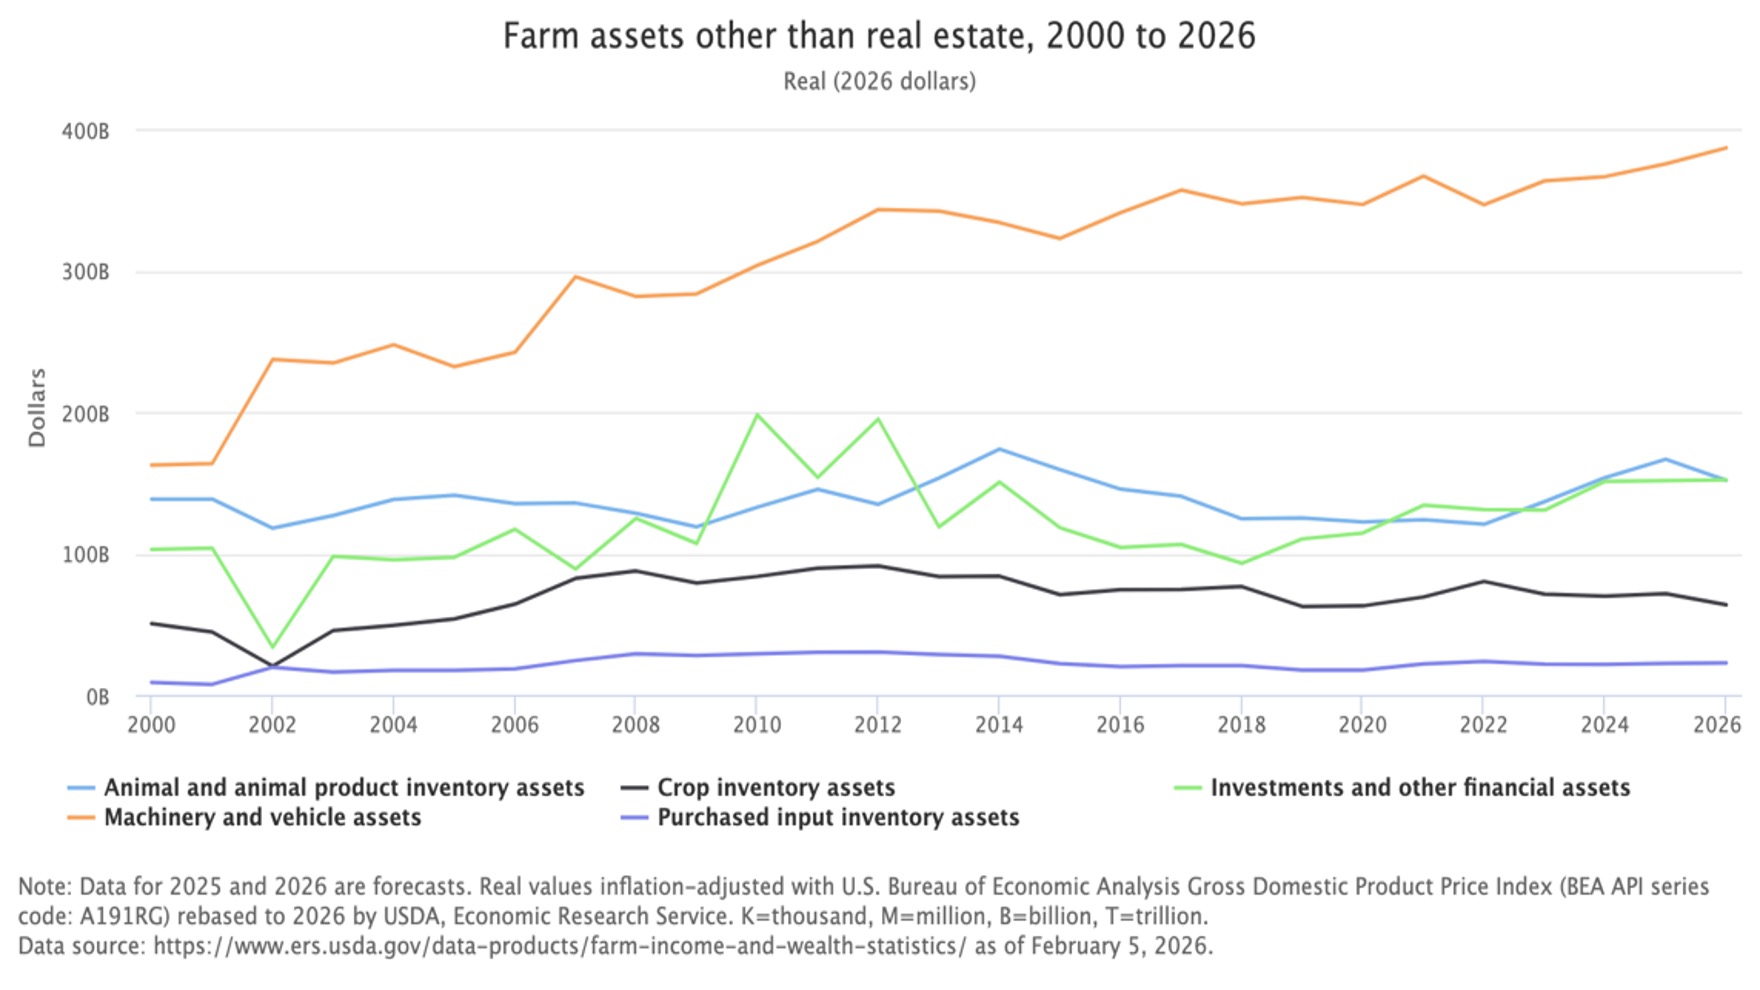
Figure 2. Farm Assets Other Than Real Estate, 2000-2026
Finally, looking at farm financial ratios, several trends and historic values appear. For the 10th straight year, the capital consumption ratio has not increased and currently stands at 0.03 (Figure 3). This is the lowest the ratio has been since data began in 1960, indicating capital consumption is being spread over more production value than ever before. Additionally, the asset turnover ratio is forecasted to be 0.14, which matches the historic low in the 60-year data series. The low asset turnover ratio indicates a lower value of production per dollar of assets on the farm balance sheet.
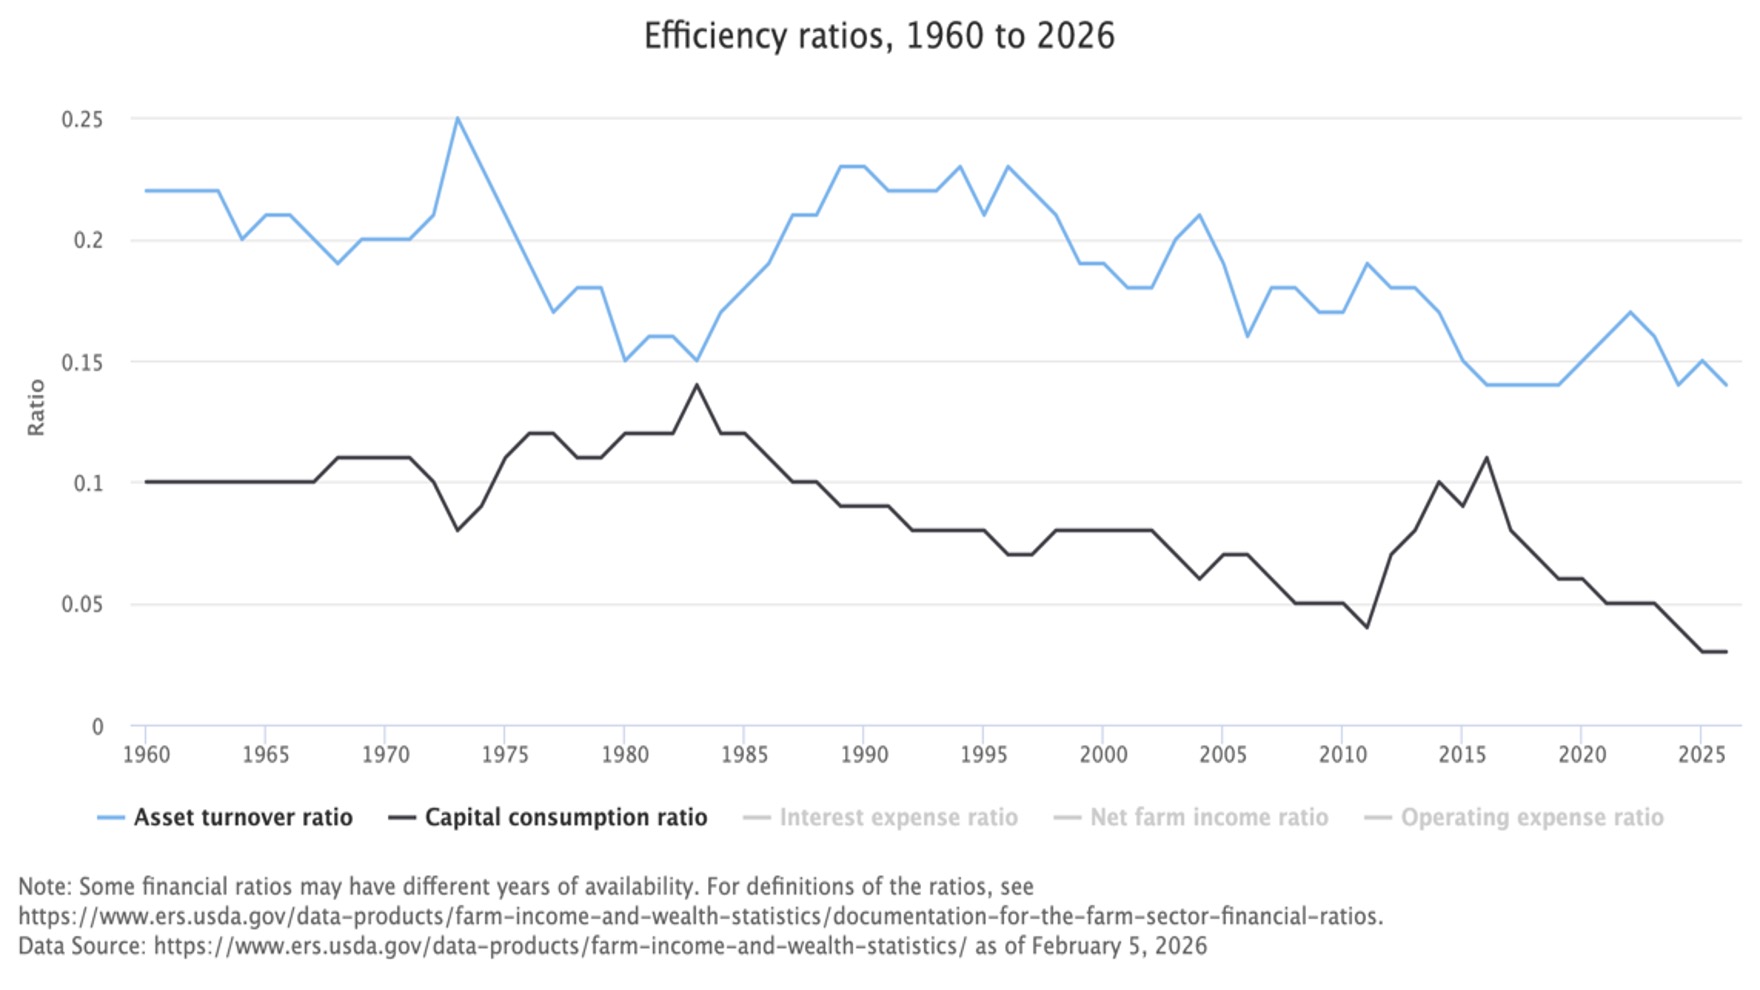
Figure 3. Efficiency Ratios, 1960-2026
To look further into the US farm balance sheet, check out the CCA’s Trends in the US Farm Balance Sheet data visualization. The data tool will be updated again with NASS’s release of Agricultural Land Values in August.
Data Source
USDA ERS Farm Income Team. 2026. Farm Income and Wealth Statistics.
![]()
![]()
![]()
![]()
![]()
TAGS:
TEAM LINKS:

RELATED RESOURCES
UPCOMING EVENTS
We are taking a short break, but please plan to join us at one of our future programs that is a little farther in the future.