July 20, 2026
July Crop Basis Update: Strengthening Continues, But Seasonal Decreases Loom
by Josh Strine


Since the third week of June, corn basis relative to September futures and soybean basis relative to August futures have generally strengthened across the Eastern Corn Belt. Indiana and Ohio continue to set the benchmark for corn basis, while soybean basis strength is more dispersed. Iowa remains the weakest for both crops. Over the past month, corn and soybean basis have strengthened most broadly in Illinois. However, in the past week, several local basis levels across Ohio, Indiana, Illinois, and Iowa have fallen. Looking ahead to next month, we may expect the basis to weaken, consistent with common seasonal trends.
Corn Basis Trends
Over the past four weeks, corn basis to September futures increased in 39 of the 41 crop reporting districts tracked by the Crop Basis Tool. The largest basis gains were in Illinois and Michigan. In Illinois, basis strengthened by at least $0.07/bu in each district, with many rising by more than $0.10/bu. For example, in Southwest Illinois, corn basis to September futures increased by $0.20/bu over the past four weeks (Figure 1). Across the five states, the largest district-level gains occurred in West Central Michigan, where basis increased by $0.24/bu (Figure 2).
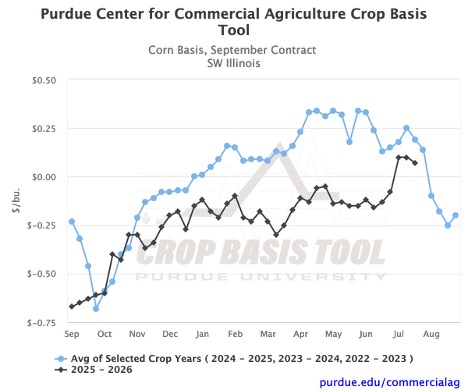
Figure 1. Corn Basis, September Contract for Southwest Illinois, Purdue Crop Basis Tool
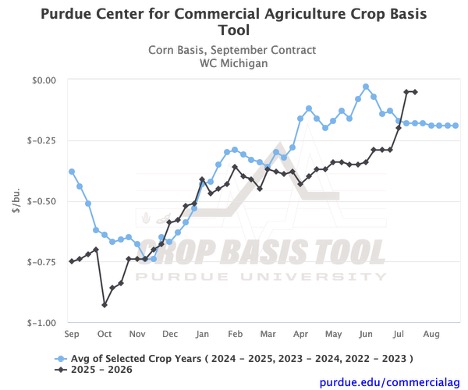
Figure 2. Corn Basis, September Contract for West Central Michigan, Purdue Crop Basis Tool
While gains in Ohio and Indiana were more moderate, the two states continue to have the highest district-level basis across the region (Figure 3). In Ohio, every district has an average spot corn price at or above the September futures level ($0.00/bu basis), with Central Ohio at a positive $0.20/bu basis. In Indiana, basis ranges from -$0.14/bu in the Northwest to $0.15/bu in the East Central. Although Indiana has among the highest basis levels, Southeast Indiana is the only district where basis has decreased month-over-month. Between the third week of June and the third week of July, the basis to September futures in the district fell by $0.07/bu (Figure 4). The decrease is largely driven by a sharp $0.22/bu decline in the past week alone. Gains were also more muted in the other southern Indiana districts.
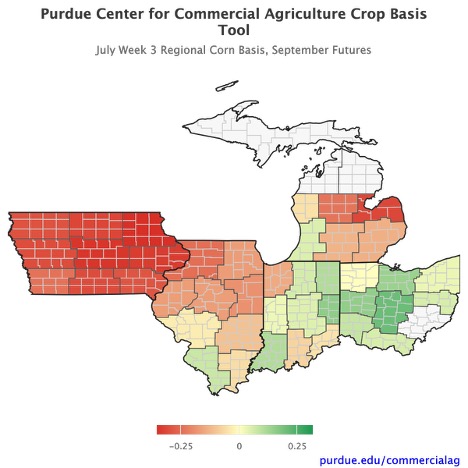
Figure 3. July Week 3 Regional Corn Basis, September Futures, Purdue Crop Basis Tool
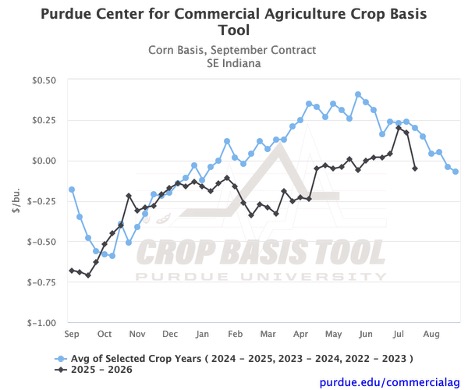
Figure 4. Corn Basis, September Contract for Southeast Indiana, Purdue Crop Basis Tool
Iowa remains the weakest in the Eastern Corn Belt, and minor strengthening over the past month did little to close the gap with the rest of the region. Basis across the state ranges from -$0.24/bu to -$0.36/bu. Gains in the state were capped at $0.07/bu, while the other four states all recorded double-digit increases in at least one district. Iowa is also the only state where the average spot price at ethanol plants is below the September futures price (Figure 5).
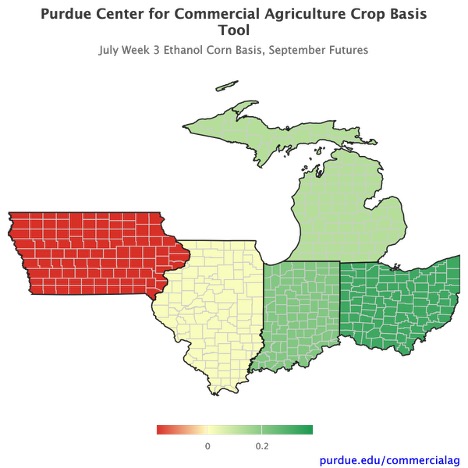
Figure 5. July Week 3 Ethanol Corn Basis, September Futures, Purdue Crop Basis Tool
Soybean Basis Trends
Soybean trends and strength are more varied across the region than corn’s. Four districts tracked by the Crop Basis Tool saw soybean basis to August futures increase by at least $0.20/bu over the past four weeks. The four districts with the greatest increases were East Central Iowa, West and Southwest Illinois, and Southwest Michigan. A $0.21/bu strengthening in Southwest Illinois pushed the district-level basis to $0.11/bu, among the highest in the region (Figure 6). However, the $0.21/bu strengthening in East Central Iowa moved the basis to -$0.33/bu, which remains among the lowest in the region (Figure 7).
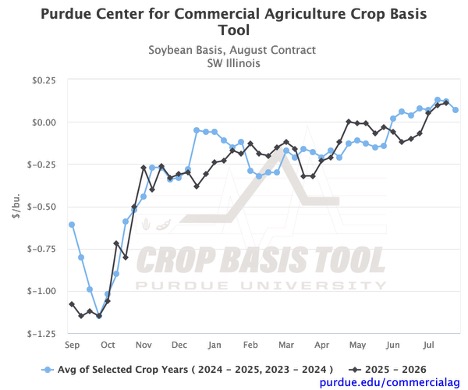
Figure 6. Soybean Basis, August Contract for Southwest Illinois, Purdue Crop Basis Tool
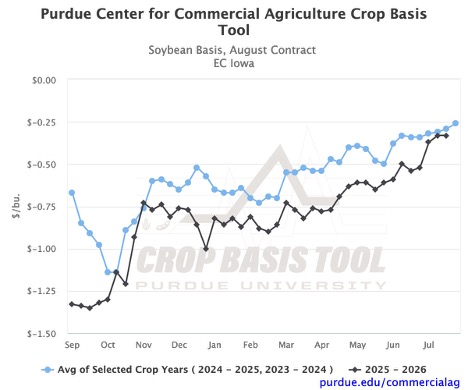
Figure 7. Soybean Basis, August Contract for East Central Iowa, Purdue Crop Basis Tool
As with corn, basis gains in Indiana and Ohio were more modest. In fact, the two states are the only ones where basis decreased between the third week of June and the third week of July. Month-over-month changes in Indiana basis ranged from -$0.04/bu in the Northeast (Figure 8) to $0.08/bu in the Southwest. In Ohio, changes ranged from -$0.01/bu to $0.11/bu. Ohio is also the only state where the average soybean processor basis has decreased over the past four weeks (Figure 9).
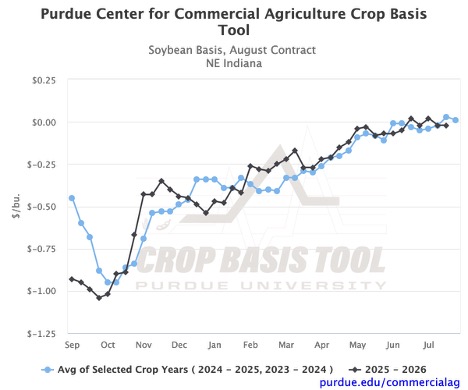
Figure 8. Soybean Basis, August Contract for Northeast Indiana, Purdue Crop Basis Tool
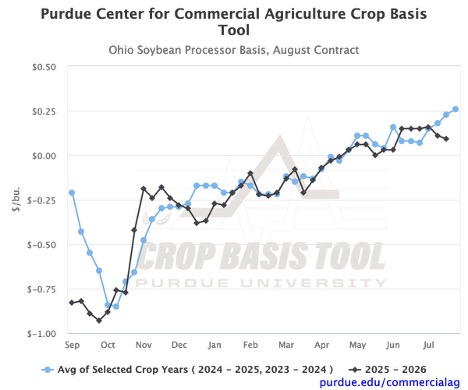
Figure 9. Ohio Soybean Processor Basis, August Contract, Purdue Crop Basis Tool
The strongest soybean basis in the region is found in districts along the Ohio River (Figure 10). In the southwestern parts of Illinois and Indiana, basis exceeds $0.10/bu. In South Central Ohio, basis is $0.05/bu. Among terminals directly on the river, basis to August futures is $0.22/bu (Figure 11). Southwest Michigan is an outlier on the map, the only other district with a positive district-level basis. This is made more interesting by a -$0.38/bu basis in neighboring South-Central Michigan, which is among the weakest in the region, along with Iowa.
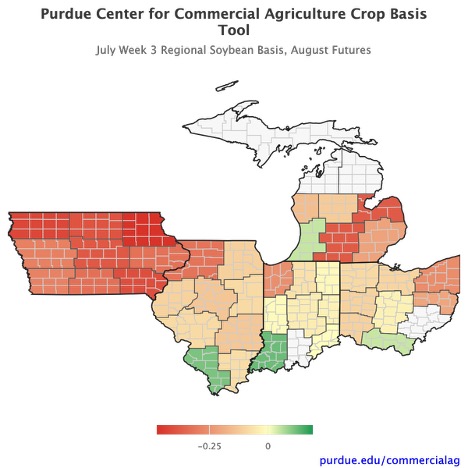
Figure 10. July Week 3 Regional Soybean Basis, August Futures, Purdue Crop Basis Tool
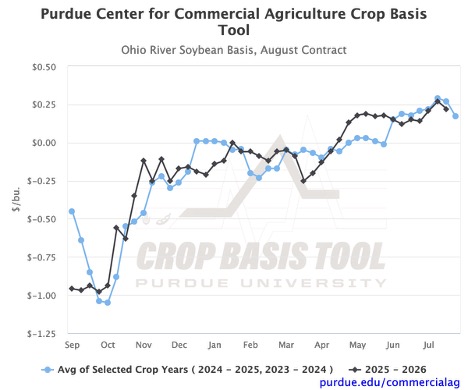
Figure 11. Ohio River Soybean Basis, August Contract, Purdue Crop Basis Tool
Looking Ahead
As we move through the second half of summer, seasonal trends suggest the strongest basis is behind us. Historical trends for both corn and soybeans indicate a weekly decline in basis across the region over the next month. Decreases are already evident in corn basis across several districts over the past week. In the three southern districts of Indiana, the drops were $0.04/bu, $0.10/bu, and $0.22/bu. With a weakening basis in mind, you can visit the Purdue Center for Commercial Agriculture’s Crop Basis Tool to see what your local market looks like and how that may affect any remaining open grain contracts.
TAGS:
TEAM LINKS:

RELATED RESOURCES
UPCOMING EVENTS
Join educators from across the Midwest to build skills for communicating soil health concepts on Nov. 4-5, 2026. In the field, we’ll evaluate the relationship between soil health and water management focusing on irrigation and edge of field practices. The in-service will have both classroom and on farm demonstrations.
The Land of Opportunity: A Conference for Farmland Owners will be held at two locations on October 5 and October 6, providing farmland owners with valuable information and resources to help them make informed decisions about their land. The conference will feature keynote presentations, educational breakout sessions, and networking opportunities designed specifically for those who own, manage, or have an interest in farmland.